


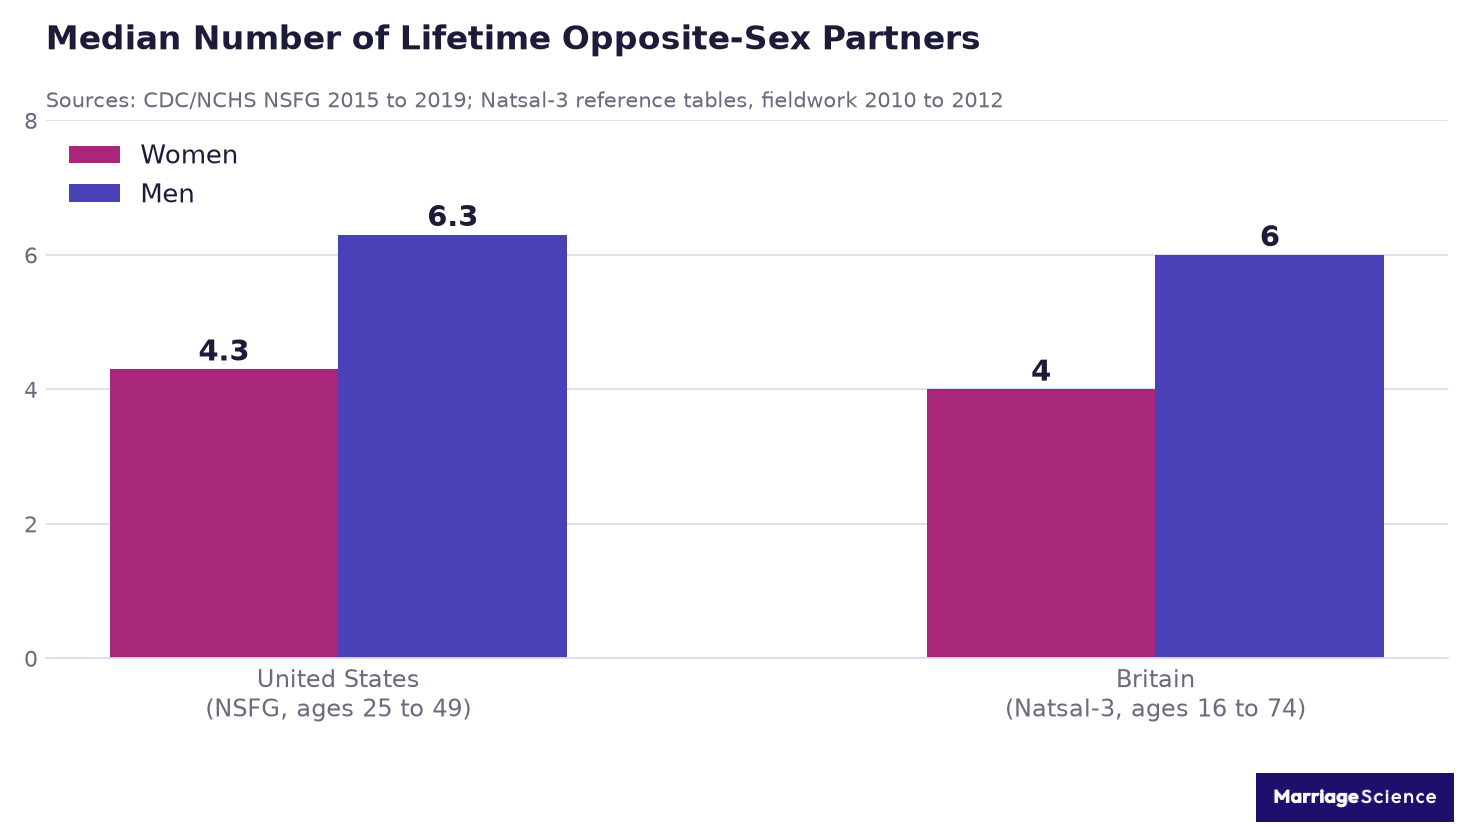
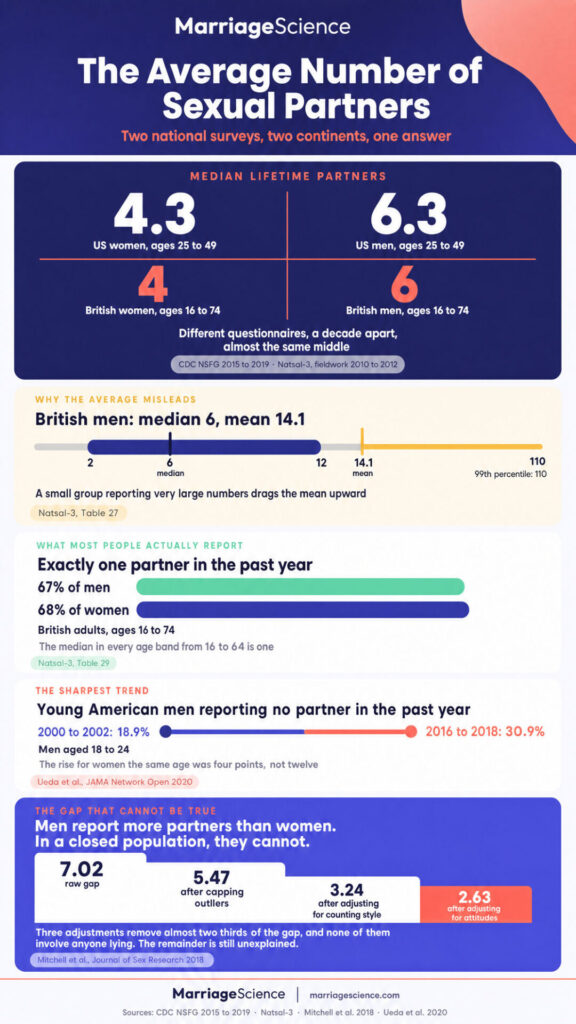
The median American aged 25 to 49 reports 4.3 lifetime opposite-sex partners if she is a woman and 6.3 if he is a man (CDC/NCHS, National Survey of Family Growth 2015 to 2019). Britain’s national survey lands in the same place, at 4 for women and 6 for men across ages 16 to 74 (Natsal-3, fieldwork 2010 to 2012).
The averages are much higher. That is a property of the distribution, not a second finding that contradicts the first. British men average 14.1 lifetime partners against a median of 6, because a small group reporting very large numbers drags the mean upward.
We aggregated data from the CDC’s National Survey of Family Growth, the British National Survey of Sexual Attitudes and Lifestyles, the General Social Survey at NORC, and peer-reviewed analyses in the Journal of Sex Research, Archives of Sexual Behavior, Sexually Transmitted Diseases and JAMA Network Open.
Core Insights
- Median lifetime opposite-sex partners in the U.S. are 4.3 for women and 6.3 for men, ages 25 to 49 (CDC/NCHS, NSFG 2015 to 2019, sexually experienced respondents).
- Britain reports 4 for women and 6 for men across ages 16 to 74, from a sample of 8,530 women and 6,028 men (Natsal-3, fieldwork 2010 to 2012).
- British men average 14.1 lifetime partners with a standard deviation of 69.6, a spread larger than the mean itself (Natsal-3 reference tables).
- 28.3% of U.S. men aged 25 to 49 report 15 or more lifetime partners, against 12.9% of women (CDC/NCHS, NSFG 2015 to 2019).
- The raw gender gap in reported partners is 7.02, and adjusting for capped outliers, counting style and sexual attitudes cuts it to 2.63 (Mitchell et al., Journal of Sex Research 2018).
- By 2011 to 2013 the U.S. median no longer differed significantly between men and women, while the male 95th percentile climbed from 38 partners to 50 (Harper et al., Sexually Transmitted Diseases 2017).
- 67% of British men and 68% of British women report exactly one opposite-sex partner in the past year (Natsal-3, ages 16 to 74).
- Median lifetime partners peak at ages 35 to 54, not in the twenties: 8 for British men in both bands, against 3 at ages 16 to 24 (Natsal-3).
- Sexual inactivity among U.S. men aged 18 to 24 rose from 18.9% to 30.9% between 2000 to 2002 and 2016 to 2018 (Ueda et al., JAMA Network Open 2020, General Social Survey).
- Mean past-year partners for U.S. men aged 15 to 44 fell 7% between 2008 and 2019, from 1.45 to 1.35, with no significant change for women (Katz et al., Archives of Sexual Behavior 2022).
- 95% of British men and 94% of British women report no same-sex partner in their lifetime (Natsal-3, ages 16 to 74).
- People with nine or more premarital partners show the highest divorce risk, and the pattern held equally for men and women (Smith and Wolfinger, Journal of Family Issues 2024, Add Health).
1. The Median Number of Sexual Partners
Two national probability surveys, run on different continents with different questionnaires a decade apart, produce almost the same median. That agreement is the strongest evidence available that the middle of the distribution sits somewhere between four and six partners.
The single most common answer in the U.S. data is two to four partners for women (29.2%) and 15 or more for men (28.3%). Those two modal categories describe very different distributions sitting behind medians only two partners apart.
| Metric | Value | Source |
| Median lifetime opposite-sex partners, U.S. women 25 to 49 | 4.3 (SE 0.10) | CDC/NCHS, NSFG 2015 to 2019 |
| Median lifetime opposite-sex partners, U.S. men 25 to 49 | 6.3 (SE 0.39) | CDC/NCHS, NSFG 2015 to 2019 |
| U.S. women reporting exactly 1 lifetime partner | 17.7% | NSFG 2015 to 2019 |
| U.S. women reporting 2 to 4 partners | 29.2% | NSFG 2015 to 2019 |
| U.S. men reporting 15 or more partners | 28.3% | NSFG 2015 to 2019 |
| U.S. women reporting 15 or more partners | 12.9% | NSFG 2015 to 2019 |
| Median lifetime partners, British men and women 16 to 74 | 6 and 4 | Natsal-3 reference tables, Table 27 |
| British adults reporting 10 or more lifetime partners | 34% of men, 20% of women | Natsal-3, Table 27 |
| British adults reporting no same-sex partner ever | 95% of men, 94% of women | Natsal-3, Table 31 |
The two surveys count slightly different people, which explains part of the gap between 4.3 and 4. The American figures cover sexually experienced respondents only, so nobody with zero partners is in the denominator, while the British figures include the 4% to 6% of adults who report none (Natsal-3 reference tables).
A third U.S. estimate is worth having beside those. Analyzing the 2011 to 2013 NSFG at ages 15 to 44, Harper and colleagues put the median at 4 for women and 5 for men, and the gap between the sexes was no longer statistically significant.
So the honest answer to “what is the average” depends on three choices that rarely get stated: median or mean, which age range, and whether people who have never had sex are counted.
Changing any one of them moves the headline number more than the male to female gap does.
2. Why the Average Is Higher Than Almost Everybody
Most coverage of this topic quotes a mean, and the mean describes a person who barely exists. In the British data the mean for men is more than double the median, and the standard deviation is 69.6 against a mean of 14.1, which is what a distribution with a long thin tail looks like when you force a single number out of it.
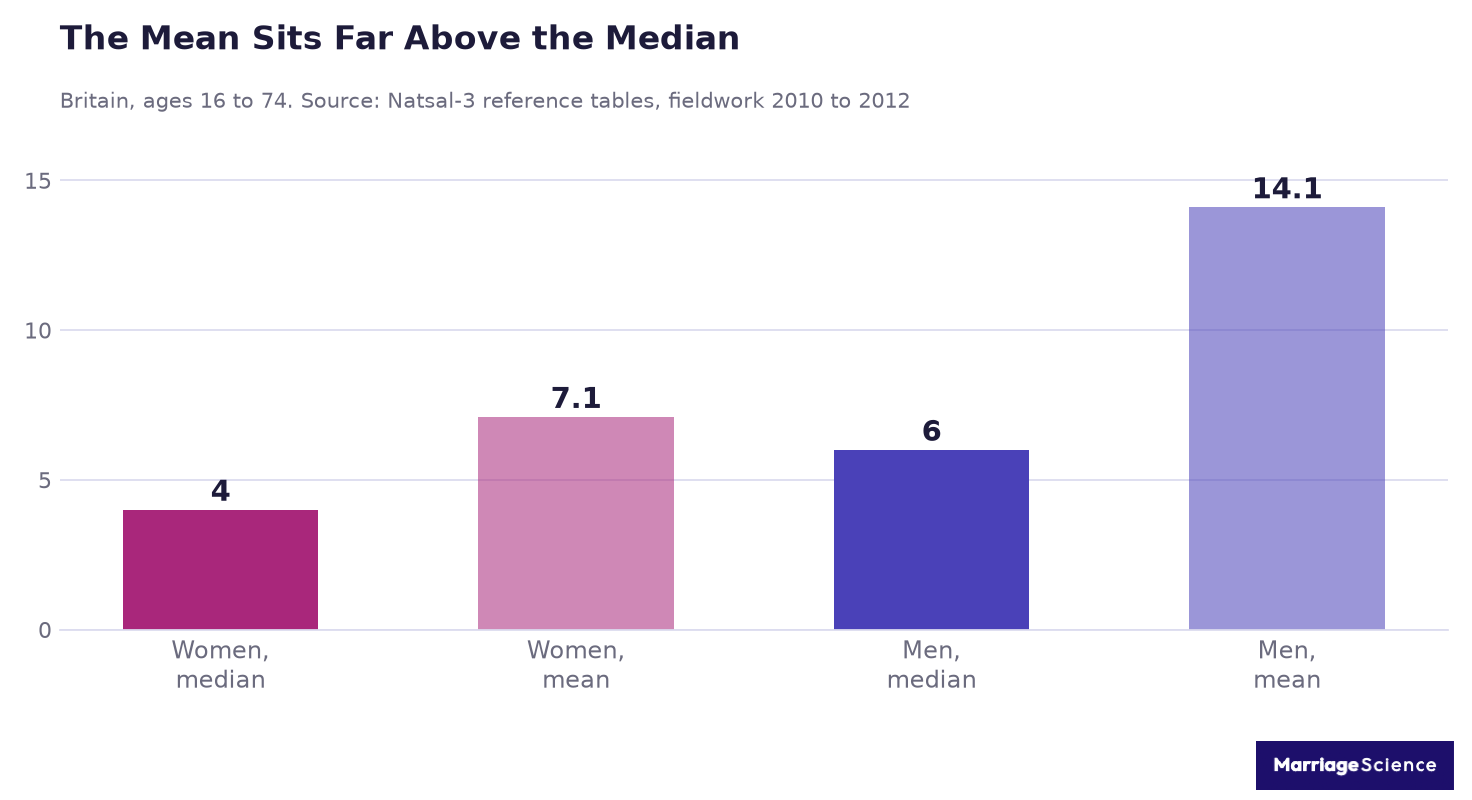
A man at the 99th percentile of the British survey reported 110 lifetime partners, a woman at the same percentile reported 50. A few hundred answers of that size are enough to move a national mean by several partners.
| Metric | Value | Source |
| Mean lifetime partners, British men 16 to 74 | 14.1 (SD 69.6) | Natsal-3, Table 27 |
| Mean lifetime partners, British women 16 to 74 | 7.1 (SD 32.1) | Natsal-3, Table 27 |
| Interquartile range, British men and women | 2 to 12 and 1 to 8 | Natsal-3, Table 27 |
| 99th percentile, men and women | 110 and 50 partners | Mitchell et al., Journal of Sex Research 2018 |
| U.S. male 95th percentile, 2002 and 2011 to 2013 | 38 and 50 partners | Harper et al., Sexually Transmitted Diseases 2017 |
| U.S. female 95th percentile, 2002 and 2011 to 2013 | 20 and 20 partners | Harper et al., 2017 |
| U.S. male 80th percentile, 2002 and 2011 to 2013 | 12 and 15 partners | Harper et al., 2017 |
The American series shows where the movement actually happened between 2002 and 2013. The median for men did not budge from 5, while the 95th percentile went from 38 to 50 and the 80th went from 12 to 15 (Harper, Dittus, Leichliter and Aral, Sexually Transmitted Diseases 44(2), 2017). The women’s percentiles barely moved over the same decade.

3. The Gender Gap That Cannot Be Arithmetically True
In a closed population of men and women, every opposite-sex partnership is counted once by each side, so the totals have to match. Every large survey finds men reporting substantially more, which means at least one sex is answering wrong.
A Glasgow-led team took the Natsal-3 responses apart to find out where the gap comes from. Three adjustments account for almost two thirds of it, and none of them involve anyone deliberately lying.
| Metric | Value | Source |
| Raw mean partners, men and women | 14.14 and 7.12 | Mitchell et al., Journal of Sex Research 2018 |
| Raw gap | 7.02 partners | Mitchell et al., 2018 |
| Gap after capping at the 99th percentile | 5.47 | Mitchell et al., 2018 |
| Gap after capping and removing paid partners | 5.11 | Mitchell et al., 2018 |
| Gap after capping and adjusting for counting versus estimating | 3.24 | Mitchell et al., 2018 |
| Gap after capping, counting style and sexual attitudes | 2.63 | Mitchell et al., 2018 |
| Sample | 6,023 men and 8,530 women aged 16 to 74 | Mitchell et al., 2018 |
The counting adjustment does the heaviest lifting. Women were more likely to tally an exact figure, men more likely to produce a round estimate, and rounded estimates skew high (Mitchell, Mercer, Prah, Clifton, Tanton, Wellings and Copas, 2018).
Some of the residual gap has ordinary explanations that are not measurement error at all.
National surveys exclude people living outside private households, they cover a bounded age range, and partners acquired abroad or from outside the sampled population count for one side only.
Capping the outliers is the adjustment worth understanding, because it is doing something specific.
A handful of men reporting three-figure totals cannot be balanced by any equivalent group of women, and once those answers are pulled back to the 99th percentile the gap drops by more than a partner and a half on its own.
Paid partners turn out to matter less than the folk explanation assumes. Removing them shifts the gap from 5.47 to 5.11, a change of about a third of a partner.
None of this resolves the arithmetic. Even the fully adjusted 2.63 is a gap that should not exist in a closed population, and the authors do not claim to have closed it. Treat any single-number answer to “how many partners does the average man have” as an estimate with a known, unexplained bias attached.

4. Partner Counts by Age and Life Stage
A lifetime count can only go up, so the age pattern should be a staircase. It is not.
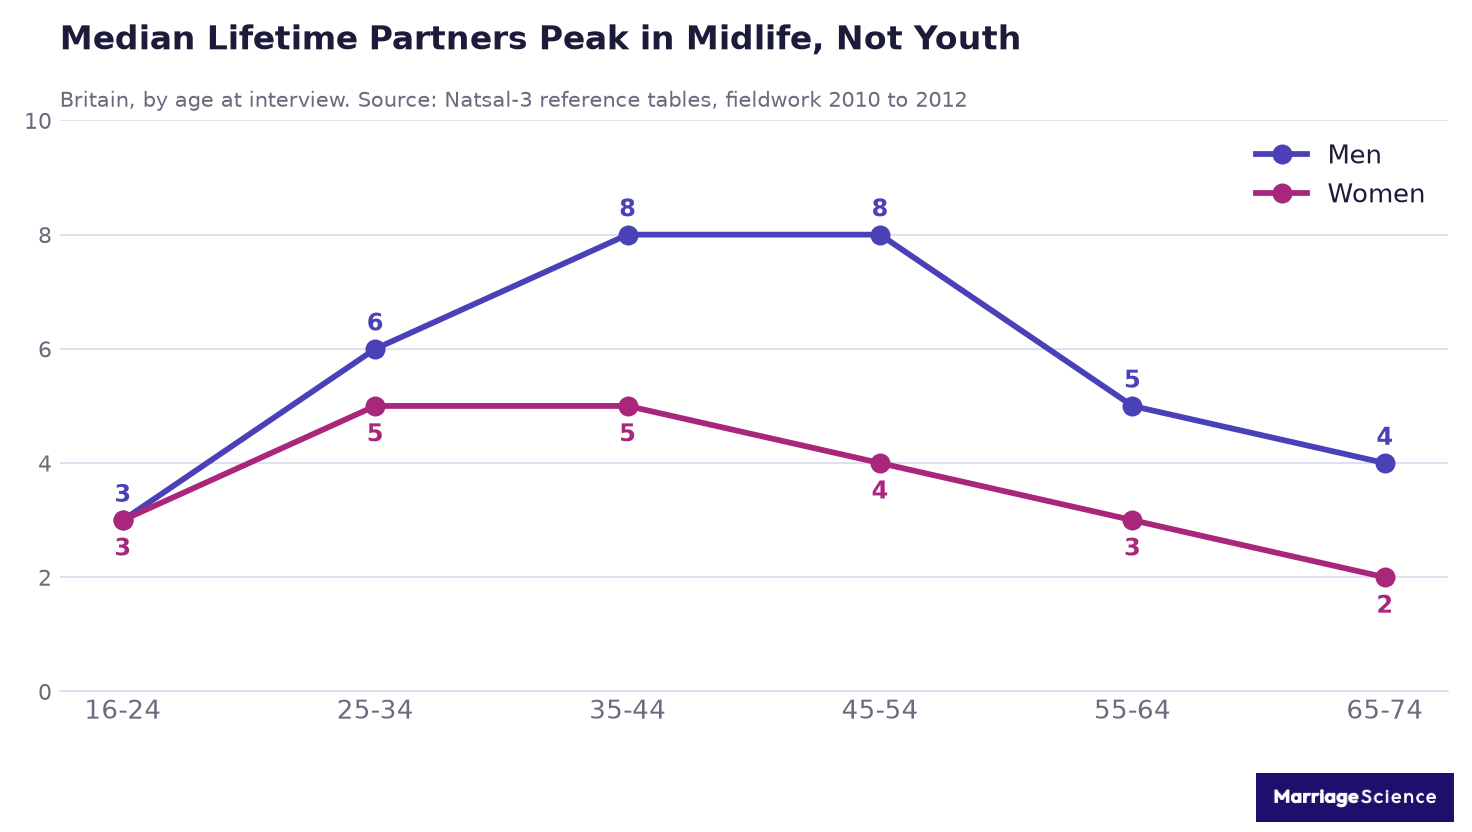
British men aged 35 to 54 report a median of 8 lifetime partners, while men aged 65 to 74 report 4.
Older people have had more years in which to accumulate partners and report fewer, which tells you the chart is tracking birth cohorts, not the effect of getting older.
| Metric | Value | Source |
| Median lifetime partners, British men aged 16 to 24 | 3 | Natsal-3, Table 27 |
| Median, British men aged 35 to 44 and 45 to 54 | 8 and 8 | Natsal-3, Table 27 |
| Median, British men aged 65 to 74 | 4 | Natsal-3, Table 27 |
| Median, British women aged 25 to 34 and 35 to 44 | 5 and 5 | Natsal-3, Table 27 |
| Median, British women aged 65 to 74 | 2 | Natsal-3, Table 27 |
| Reporting 10 or more partners, ages 35 to 44 | 42% of men, 28% of women | Natsal-3, Table 27 |
| Reporting exactly 1 lifetime partner, ages 65 to 74 | 23% of men, 43% of women | Natsal-3, Table 27 |
| Reporting no opposite-sex partner, ages 16 to 24 | 20% of men, 20% of women | Natsal-3, Table 27 |
The bottom row is the one worth sitting with. One in five British 16 to 24 year olds had never had an opposite-sex partner at the time of interview, a share identical for men and women, and that was measured before the sharper declines of the late 2010s.
Related reading: our sexless marriage statistics cover the other end of the life course.
5. Partners in the Past Year
Lifetime totals invite comparison.
Annual totals describe how people actually live. The two numbers point in opposite directions, because a large lifetime count is usually the sum of many years spent with one person at a time.
Two thirds of British adults report exactly one opposite-sex partner in the past year, and the median in every age band from 16 to 64 is 1.
| Metric | Value | Source |
| Exactly 1 opposite-sex partner in the past year, ages 16 to 74 | 67% of men, 68% of women | Natsal-3, Table 29 |
| No opposite-sex partner in the past year, ages 16 to 74 | 18% of men, 22% of women | Natsal-3, Table 29 |
| Five or more partners in the past year, ages 16 to 74 | 3% of men, 2% of women | Natsal-3, Table 29 |
| Five or more partners in the past year, ages 16 to 24 | 8% of men, 6% of women | Natsal-3, Table 29 |
| Mean partners in the past year, ages 16 to 74 | 1.3 for men, 1.0 for women | Natsal-3, Table 29 |
| Exactly 1 partner over the past five years | 55% of men, 60% of women | Natsal-3, Table 28 |
| Mean U.S. past-year partners, men 15 to 44, 2017 to 2019 | 1.35 | Katz et al., Archives of Sexual Behavior 2022 |
| Mean U.S. past-year partners, women 15 to 44, 2017 to 2019 | 1.25 | Katz et al., 2022 |
Across five years most people still report one partner: 55% of British men and 60% of British women report a single partner over that whole span (Natsal-3, Table 28).
What these surveys cannot see is whether a partner was concurrent or sequential, which is the question our infidelity data addresses directly.

6. The Decline Among Young Adults
Between 2000 and 2018 the share of young American men reporting no sexual partner in the previous year rose by twelve percentage points. The comparable rise for young women was four points, so the trend is not evenly distributed.
30.9% of U.S. men aged 18 to 24 reported no sexual activity in the past year in 2016 to 2018, up from 18.9% in 2000 to 2002.
| Metric | Value | Source |
| Sexually inactive in past year, men 18 to 24, 2000 to 2002 and 2016 to 2018 | 18.9% and 30.9% | Ueda et al., JAMA Network Open 2020 (GSS) |
| Sexually inactive, men 25 to 34, same periods | 7.0% and 14.1% | Ueda et al., 2020 |
| Sexually inactive, women 18 to 24, same periods | 15.1% and 19.1% | Ueda et al., 2020 |
| Sexually inactive, women 25 to 34, same periods | 7.0% and 12.6% | Ueda et al., 2020 |
| Three or more partners in the past year, 2016 to 2018 | 14.5% of men, 7.1% of women | Ueda et al., 2020 |
| Exactly one partner in the past year, 2016 to 2018 | 57.5% of men, 74.2% of women | Ueda et al., 2020 |
| Mean past-year partners, U.S. men 15 to 44, 2008 to 2019 | 1.45 falling to 1.35, a 7% decline | Katz et al., Archives of Sexual Behavior 2022 |
| Weekly or more sex, U.S. adults 18 to 64, 1990 and 2024 | 55% and 37% | General Social Survey, via Institute for Family Studies 2025 |
The female series in the same paper moved much less, and women’s mean past-year partner count showed no statistically significant decline at all across five NSFG cycles (Ueda, Mercer, Ghaznavi and Herbenick, JAMA Network Open 2020).
Any account of a general “sex recession” has to explain why it registers so much more strongly in men’s answers. Our Gen Z dating statistics track the cohort where the change is concentrated.
7. What Partner Counts Are Associated With
Partner counts get treated as a moral scoreboard in popular writing and as an exposure variable in the actual literature.
The research question is usually transmission risk, and the marital findings that circulate widely rest on a much thinner base than their confident framing suggests.
People with nine or more premarital partners show the highest divorce risk, and the association survives controls for adolescent religiosity, beliefs and family background. The same analysis found the pattern held equally for men and women, which contradicts a great deal of what gets written about this.
| Metric | Value | Source |
| Highest divorce risk group by premarital partner count | 9 or more partners | Smith and Wolfinger, Journal of Family Issues 2024 (Add Health) |
| Next highest | 1 to 8 partners | Smith and Wolfinger, 2024 |
| Lowest | no premarital partners other than the eventual spouse | Smith and Wolfinger, 2024 |
| Gender difference in that association | none detected | Smith and Wolfinger, 2024 |
| Chlamydia testing among U.S. women 15 to 44, 2008 to 2010 and 2017 to 2019 | 26.4% and 30.0% | Katz et al., Archives of Sexual Behavior 2022 |
| Trend in reported gonorrhea or chlamydia diagnoses among those tested | no significant change | Katz et al., 2022 |
| Reason partner distribution is tracked at all | the skewed tail drives transmission modelling | Harper et al., Sexually Transmitted Diseases 2017 |
Read the divorce row as an association and nothing more.
The authors are explicit that they cannot say why the relationship holds, and the people who accumulate more partners before marrying differ from those who do not in ways no survey fully captures (Smith and Wolfinger, Journal of Family Issues, 2024).
For the underlying divorce rates these risks sit against, see our divorce statistics.
Summary: Sexual Partner Numbers by the Numbers
| Metric | Value | Source |
| Median lifetime partners, U.S. women 25 to 49 | 4.3 | CDC/NCHS, NSFG 2015 to 2019 |
| Median lifetime partners, U.S. men 25 to 49 | 6.3 | CDC/NCHS, NSFG 2015 to 2019 |
| Median lifetime partners, British women 16 to 74 | 4 | Natsal-3, Table 27 |
| Median lifetime partners, British men 16 to 74 | 6 | Natsal-3, Table 27 |
| Mean lifetime partners, British men | 14.1 (SD 69.6) | Natsal-3, Table 27 |
| Mean lifetime partners, British women | 7.1 (SD 32.1) | Natsal-3, Table 27 |
| U.S. men with 15 or more lifetime partners | 28.3% | NSFG 2015 to 2019 |
| U.S. women with 15 or more lifetime partners | 12.9% | NSFG 2015 to 2019 |
| U.S. women with 2 to 4 lifetime partners | 29.2% | NSFG 2015 to 2019 |
| 99th percentile, British men and women | 110 and 50 partners | Mitchell et al., 2018 |
| Raw gender gap in reported partners | 7.02 | Mitchell et al., 2018 |
| Gap after three adjustments | 2.63 | Mitchell et al., 2018 |
| U.S. male 95th percentile, 2002 and 2011 to 2013 | 38 and 50 | Harper et al., 2017 |
| Median lifetime partners, British men 35 to 54 | 8 | Natsal-3, Table 27 |
| British adults with exactly 1 partner in the past year | 67% of men, 68% of women | Natsal-3, Table 29 |
| British adults with no partner in the past year | 18% of men, 22% of women | Natsal-3, Table 29 |
| Sexually inactive U.S. men 18 to 24, 2016 to 2018 | 30.9% | Ueda et al., JAMA Network Open 2020 |
| Sexually inactive U.S. women 18 to 24, 2016 to 2018 | 19.1% | Ueda et al., 2020 |
| Mean U.S. past-year partners, men 15 to 44, 2017 to 2019 | 1.35 | Katz et al., 2022 |
| Highest divorce risk by premarital partner count | 9 or more partners | Smith and Wolfinger, 2024 |
Methodology and Sources
Every figure here comes from a national probability survey or a peer-reviewed analysis of one. We excluded condom-brand “global sex surveys”, dating-app press releases and online panel polls, all of which circulate widely on this topic and none of which use probability sampling.
- CDC National Center for Health Statistics, Key Statistics from the National Survey of Family Growth, number of opposite-sex partners in lifetime, 2015 to 2019 file.
- Natsal-3 reference tables, National Survey of Sexual Attitudes and Lifestyles, fieldwork 2010 to 2012, Tables 27 to 31.
- K. R. Mitchell, C. H. Mercer, P. Prah, S. Clifton, C. Tanton, K. Wellings and A. Copas, Why Do Men Report More Opposite-Sex Sexual Partners Than Women?, Journal of Sex Research, 2018.
- C. R. Harper, P. J. Dittus, J. S. Leichliter and S. O. Aral, Changes in the Distribution of Sex Partners in the United States: 2002 to 2011-2013, Sexually Transmitted Diseases 44(2), 2017.
- P. Ueda, C. H. Mercer, C. Ghaznavi and D. Herbenick, Trends in Frequency of Sexual Activity and Number of Sexual Partners Among Adults Aged 18 to 44 Years in the US, 2000-2018, JAMA Network Open, 2020.
- D. A. Katz, C. E. Copen, L. Haderxhanaj, M. Hogben, S. M. Goodreau, I. H. Spicknall and D. T. Hamilton, Changes in Sexual Behaviors with Opposite-Sex Partners and Sexually Transmitted Infection Outcomes, Archives of Sexual Behavior, 2022.
- J. Smith and N. H. Wolfinger, Re-Examining the Link Between Premarital Sex and Divorce, Journal of Family Issues, 2024.
- NORC at the University of Chicago, General Social Survey, 1972 to 2024.
What these figures measure is what people say, and the section on the gender gap shows how far that can drift from what happened. Both national surveys ask primarily about opposite-sex partners, so the lifetime totals here are not totals of all sexual partners, and the same-sex estimates rest on much smaller bases.
The fieldwork dates matter more here than the publication dates. Natsal-3 was collected in 2010 to 2012 and is the most recent published British reference table set.
Natsal-4 fieldwork has been completed and its partner tables are the single release most likely to change this page. On the American side, the 2022 to 2023 NSFG public-use files were released in December 2024, but NCHS has not yet published a partner-number key statistics table from them.
We update this page annually. The rest of our research sits on the Marriage Science statistics hub.



