


Living apart together, or LAT, means two people in a committed relationship who keep separate homes. Researchers use the term for unmarried couples, and some also include married couples who live apart for reasons other than separation.
A syndicated TV news figure said 3.89 million married Americans live apart and that the share grew by more than 40% since 2000. The stories did not name a table, which makes the claim hard to trace.
The traced source is the Census Bureau’s Current Population Survey for 2022, under the label “married, spouse absent”: 3.889 million in our analysis. The count rose 42% from 2.73 million in 2000.
The share tells a quieter story. Among married people, the share who live apart rose from 2.36% to 2.95%, while the newest year in the same series is higher: 4.649 million in 2025, or 3.43% of married adults.
This page covers Census microdata on married couples who live apart, including counts, ages, states, and newlyweds. It also covers survey research on unmarried LAT couples in the United States and Canada, and why people choose separate homes.
Living Apart Together: What the Data Shows
The Census figures come from our analysis of Census microdata, using the Current Population Survey and the American Community Survey, while the remaining items name their source in the item.
- 4.649 million married adults lived apart from their spouse in 2025, equal to 3.43% of married adults in the Current Population Survey measure.
- In the same Current Population Survey series, the comparable count was 2.73 million in 2000 and 3.889 million in 2022.
- The American Community Survey, which also counts people in institutions and barracks, puts the figure at 6.56 million in 2024, or 4.88% of married adults.
- 13.15% of people who married in the past year did not live with their spouse in 2024.
- Among married adults aged 15 to 24, 23.5% live apart from their spouse, while among those 35 to 64 the share is about 4%.
- Married adults born abroad live apart at 7.25%, compared with 4.24% of U.S.-born married adults in the same measure.
- Married adults without a high school diploma live apart at 9.59%, against 3.4% of those with a bachelor’s degree.
- 9.07% of married active-duty service members do not live with their spouse.
- The District of Columbia has the highest share at 7.4%, and North Dakota the lowest at 2.8%, using 2023 and 2024 pooled.
- NCFMR at Bowling Green State University reports that the share of newlyweds living apart rose from 5.7% in 1980 to 12.5% in 2023.
- Strohm and colleagues, using the General Social Survey 1996 and 1998, found 7% of U.S. women and 6% of men were in an unmarried LAT relationship, equal to 35% of everyone not married or cohabiting.
- Statistics Canada 2011 found 7.4% of Canadians aged 20 and older, or 1.9 million people, were in a LAT couple, including 31% of those aged 20 to 24.
- Statistics Canada reported that 42% of LAT Canadians said circumstances kept them apart, while choice was clearly a factor for 39%.
- Two-thirds of Canadians 60 and older in LAT couples live apart by choice.
- Only 11% of Canadian LAT couples had both chosen the arrangement and planned never to move in together.
What Living Apart Together Means
Living apart together has a narrow meaning in much of the research literature. Strohm, Seltzer, Cochran and Mays, writing in Demographic Research, use LAT for unmarried people in an intimate relationship who keep separate households and see themselves as a couple.
Statistics Canada uses the same basic idea. Its definition covers people who are not married or living common-law, but are in an “intimate couple relationship” with someone they do not live with.
Other researchers use a wider definition. The National Center for Family and Marriage Research includes married couples who choose to live apart, including in its work on newlyweds.
That broader use brings married households into a term that often began as an unmarried-couple category.
The Census Bureau does not have a LAT category. Its closest label is “married, spouse absent,” meaning a married person whose spouse is not in the household for reasons other than separation.
That label can include a spouse who is deployed, working in another state, in a nursing home, in prison, or still abroad waiting to immigrate.
That creates two kinds of LAT and two kinds of data. The married count is easy to measure in Census data, but it mixes choice with circumstance.
The unmarried kind is closer to the lifestyle people usually mean when they say living apart together, and only special surveys catch it.
| Term | Who it covers | Where it is counted |
| Unmarried LAT couple | Unmarried people in an intimate couple relationship who keep separate households | Special surveys, not Census LAT counts |
| Married but living apart | Married people whose spouse is not in the household for reasons other than separation | The Census Bureau’s closest marital-status label |
| Separated | Married people living apart because of separation | Outside the married but living apart count used here |
For this article, the measured national count refers to married people whose spouse is absent from the household for a reason other than separation. It should not be read as a count of all people who prefer separate homes, and it does not include unmarried LAT couples counted as single in Census data.
How Many Married Americans Live Apart
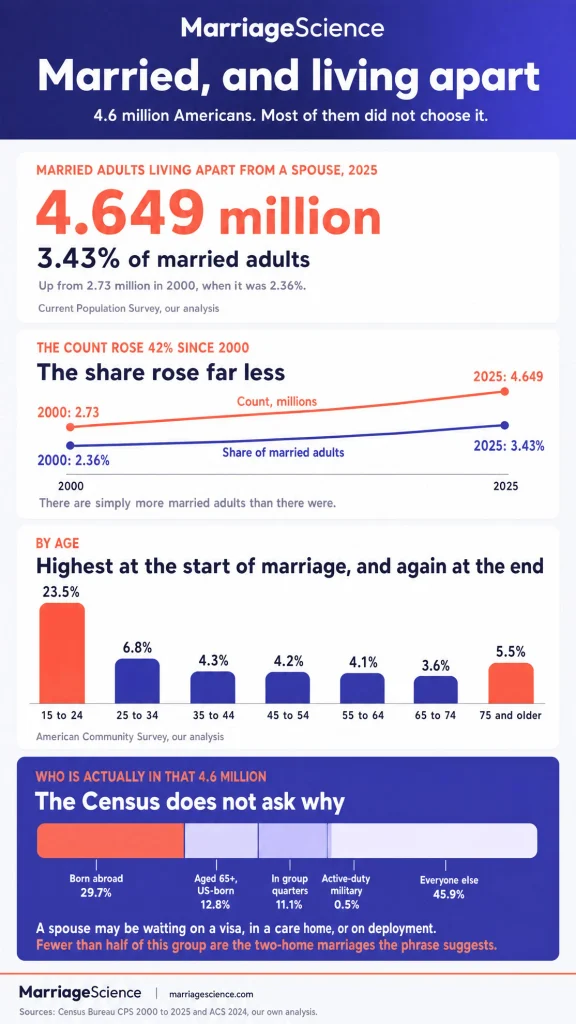
Our analysis of the Current Population Survey counts adults 15+ who are married but living apart from their spouse. The Census label is “married, spouse absent.” In 2025, 4.649 million married Americans were in that category, equal to 3.43% of married adults.
The married adult population in total was 135.7 million.
That makes living apart a minority arrangement within marriage, but a large one in headcount. The measure includes people who are legally married and report that their spouse is absent from the household.
It does not say why the spouses live apart, and it does not by itself describe the quality of the marriage.
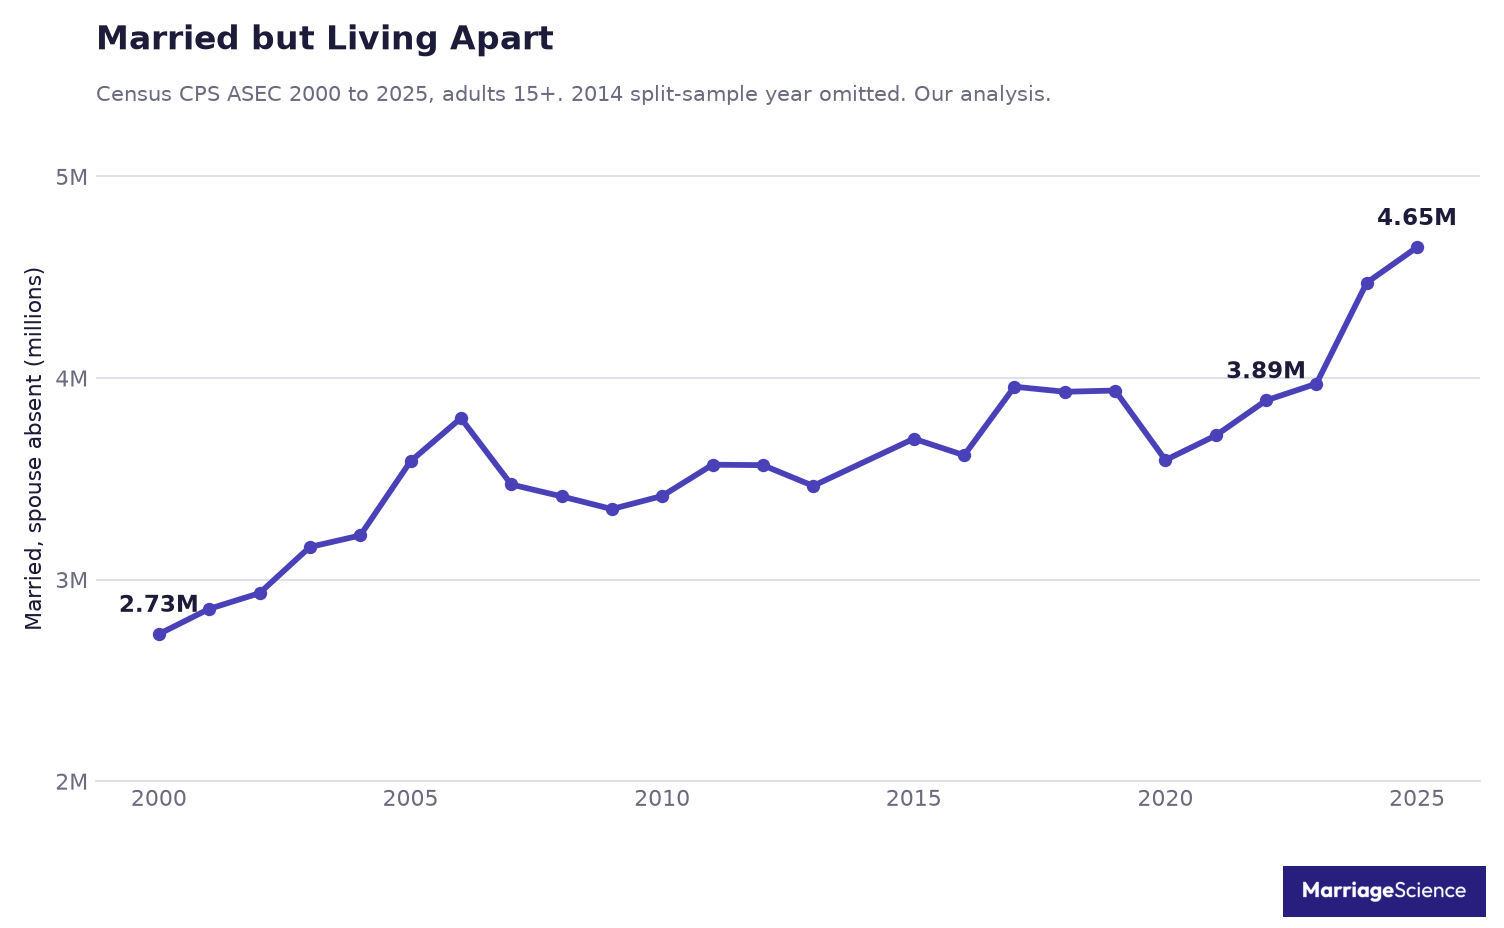
The long view shows a rise from 2000, with movement up and down along the way. In 2000, 2.73 million married adults lived apart, equal to 2.36% of married adults.
By 2025, the count was 4.649 million and the share was 3.43%.
| Year | Married but living apart (millions) | Share of married adults |
| 2000 | 2.73 million | 2.36% |
| 2006 | 3.801 million | 3.09% |
| 2010 | 3.415 million | 2.75% |
| 2019 | 3.938 million | 2.96% |
| 2020 | 3.593 million | 2.7% |
| 2022 | 3.889 million | 2.95% |
| 2024 | 4.473 million | 3.34% |
| 2025 | 4.649 million | 3.43% |
The 2020 entry needs context, because it was a pandemic year and the survey was harder to field. The count that year was 3.593 million, or 2.7% of married adults, below the 2019 count of 3.938 million and the 2022 count of 3.889 million.
We also left out 2014, when the survey ran a split sample during a questionnaire redesign.
The 3.89 million figure from the news stories matches 2022 exactly. From 2000 to 2022, the count rose 42%, while the share rose about 25%, from 2.36% to 2.95%.
Part of the larger count is simply that there are more married adults. The share gives a cleaner read on how common the arrangement is within marriage, while the count shows the number of people affected.
The latest increase came after 2023. The count moved from 3.972 million in 2023 to 4.649 million in 2025.
That change is visible in both the count and the share, since the 2025 share reached 3.43% of married adults, compared with 3.34% in 2024.
Our figures also line up with earlier checks. Strohm and colleagues quoted 3.1% of married persons as “married, spouse absent” for 2006.
Our figure for 2006 is 3.09%, using the same basic category and shown here as 3.801 million married adults living apart.
For how many Americans are married at all, see our marriage statistics.
Why Two Census Surveys Give Different Numbers
The ACS and CPS can look like they disagree because they are built and fielded in different ways. In 2024, the ACS counted 6.56 million married adults not living with their spouse, or 4.88% of married adults.
The CPS counted 4.473 million, or 3.34%.
Neither number is wrong. They answer the same question through different survey designs, which is why our headline uses the CPS for the long trend and the ACS for closer cuts by age and state.
| Survey | Married, spouse absent | Share of married | Includes group quarters |
| American Community Survey, 2024 | 6.56 million | 4.88% | Yes |
| Current Population Survey, 2024 | 4.473 million | 3.34% | No |
The largest mechanical gap is group quarters. In the ACS, 11.1% of married adults not living with their spouse live in places such as nursing homes, prisons, college dorms and military barracks.
The CPS covers only people in households, so it misses that part of the married but living apart population.
When group quarters are removed, the ACS share falls to 4.36%. That still leaves a gap, but a smaller one.
The rest comes from how the surveys are run. The CPS is a monthly labor survey with its own household roster rules.
The ACS is a far larger mail and online survey, which gives it more reach for state estimates and age breaks.
Our analysis of the American Community Survey uses a specific rule for identifying spouses in the same home. A married person counts as living with their spouse if they head a married-couple household, are the householder’s spouse, or are one half of a married couple living in someone else’s home.
For that last group, we paired married relatives and housemates in the same home, the way the IPUMS project at the University of Minnesota does. This matters because the ACS has to be translated from household relationships into a count of married but living apart adults.
That check lines up with outside work. With that method, our 2023 share of newlyweds living apart is 12.24%.
NCFMR, using IPUMS, published 12.5% for 2023. Our age bands land within about a point of theirs.
For this article, the CPS is the source for measuring change across time. The ACS is the source for detail, especially when the question is where married but living apart adults live and how the pattern differs across ages.
Newlyweds Who Live Apart
For newlyweds, living apart is much more common than it is among married people as a whole. Bankey’s NCFMR Family Profile 27 defines this group as people married in the past year who live apart for reasons other than separation.
In that profile, 12.5% of newlyweds were married but living apart in 2023, compared with 4.6% of all married adults in our analysis of the same year.
The same profile shows a large change over time. The newlywed living apart rate was 5.7% in 1980, rose to 13.4% in 2018, and stood at 12.5% in 2023.
That places living apart near the start of marriage well above the level seen among married adults overall.
Our analysis of the American Community Survey found a similar result for 2024, with 13.15% of newlyweds living apart. The 2024 estimate sits close to the NCFMR 2023 estimate, which suggests that the pattern was still present in the most recent ACS data we analyzed.
| Age | Newlyweds living apart, 2023 (NCFMR) | Newlyweds living apart, 2024 (ours) |
| 15 to 24 | 26.6% | 27.1% |
| 25 to 34 | 9.2% | 9.9% |
| 35 to 44 | 9.5% | 9.61% |
| 45 to 54 | 10.5% | 11.09% |
| 55 to 64 | 10.3% | 10.95% |
| 65 and older | 13.7% | 13.38% |
The age pattern is U-shaped. The highest share is at 15 to 24, with 26.6% in the NCFMR profile and 27.1% in our 2024 estimate.
The lowest point is at 25 to 34, at 9.2% in NCFMR and 9.9% in our estimate.
The share rises again at older ages. NCFMR reports 13.7% for newlyweds age 65 and older, while our estimate is 13.38%.
The data do not record why. Older couples who keep two homes are one possibility, spouses in care are another.
Marriage order also matters in the NCFMR profile. First marriages had the highest share living apart, at 13.1%.
The share was 10.6% for second marriages and 10.2% for third or later marriages.
Education shows the widest spread. Among newlyweds with less than high school, 29.4% lived apart, compared with 15.5% for high school, 11.4% for some college, and 8.3% for a bachelor’s or more.
These figures describe where newlyweds live at the start of marriage, without identifying a single reason behind it.
How long those marriages tend to last is covered in our analysis of average marriage length.
Who Lives Apart From a Spouse
Our analysis of the American Community Survey looks at married adults, not separated. In this source, living apart from a spouse is the Census category that captures married people whose spouse is absent from the household.
The age pattern is steepest at the youngest adult ages. Among married adults ages 15 to 24, 23.51% were living apart from a spouse.
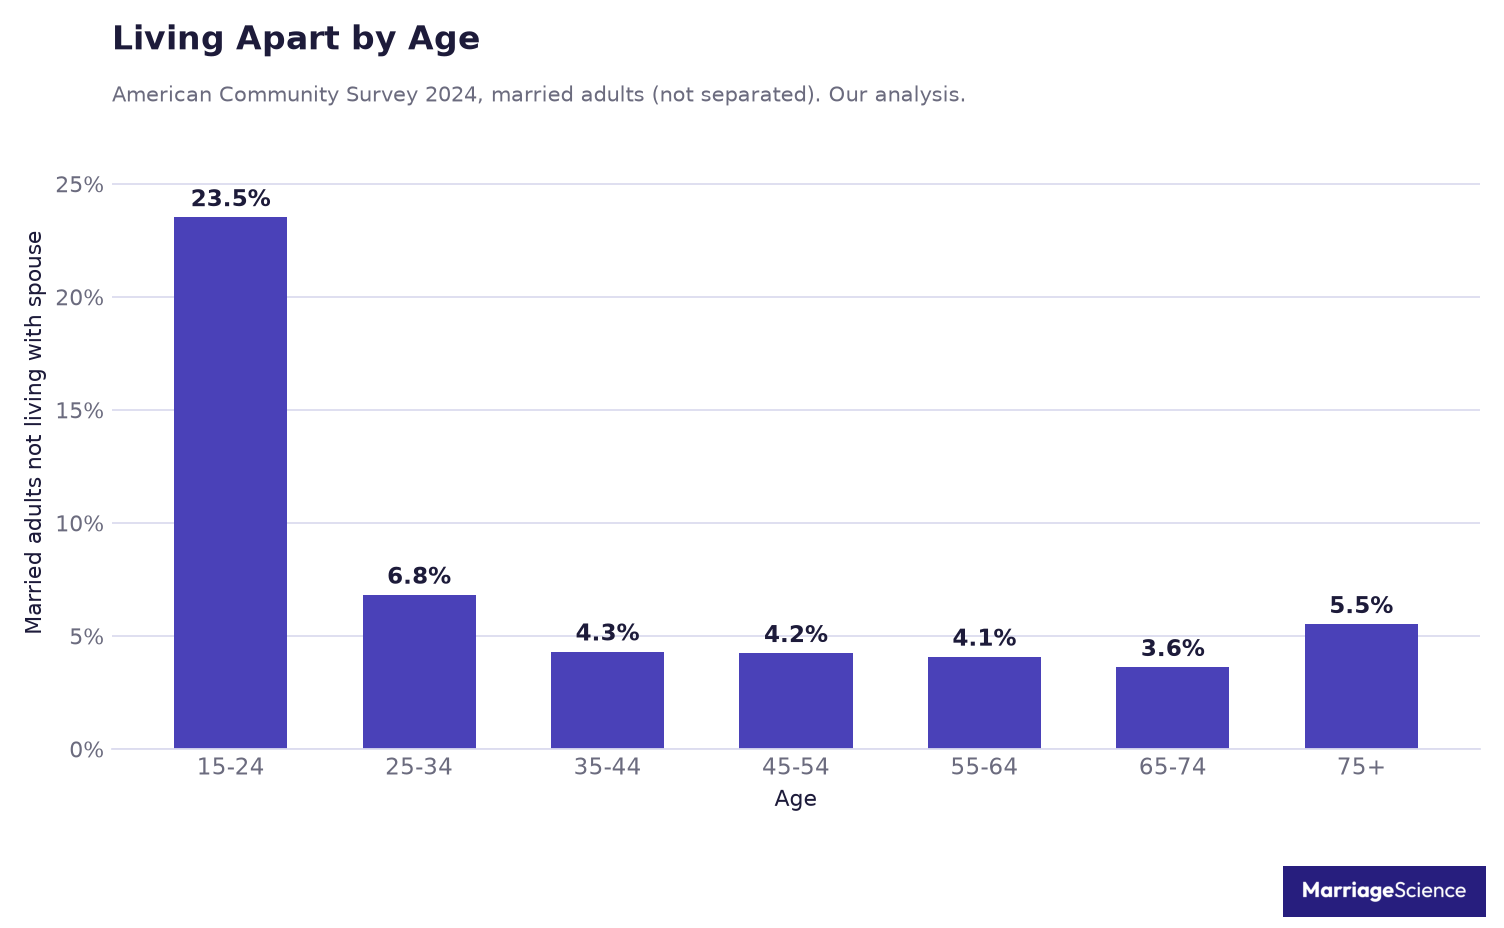
The share then drops to 6.81% at ages 25 to 34 and stays close to the same level through midlife.
Later life has a second rise. The share is 3.61% at ages 65 to 74, then 5.51% at ages 75 and older.
That pattern fits a Census measure that can include spouses in care homes and other living arrangements outside the household.
| Group | Share Living Apart |
| 15 to 24 | 23.51% |
| 25 to 34 | 6.81% |
| 35 to 44 | 4.3% |
| 45 to 54 | 4.23% |
| 55 to 64 | 4.07% |
| 65 to 74 | 3.61% |
| 75 and older | 5.51% |
| Men | 5.13% |
| Women | 4.62% |
| U.S.-born | 4.24% |
| Born abroad | 7.25% |
| Less than high school | 9.59% |
| High school | 6.21% |
| Some college | 4.5% |
| Bachelor’s or more | 3.4% |
Men and women are close on this measure, at 5.13% and 4.62%. The larger gaps are by birthplace and schooling.
Married adults born abroad have a 7.25% share living apart, compared with 4.24% among U.S.-born married adults.
Education also separates the groups. The share is 9.59% among married adults with less than high school, 6.21% among those with high school, 4.5% among those with some college, and 3.4% among those with a bachelor’s or more.
Military status is another marker. Active-duty military members have a 9.07% share living apart from a spouse, which is consistent with postings, deployments, and housing arrangements that can keep spouses in separate places.
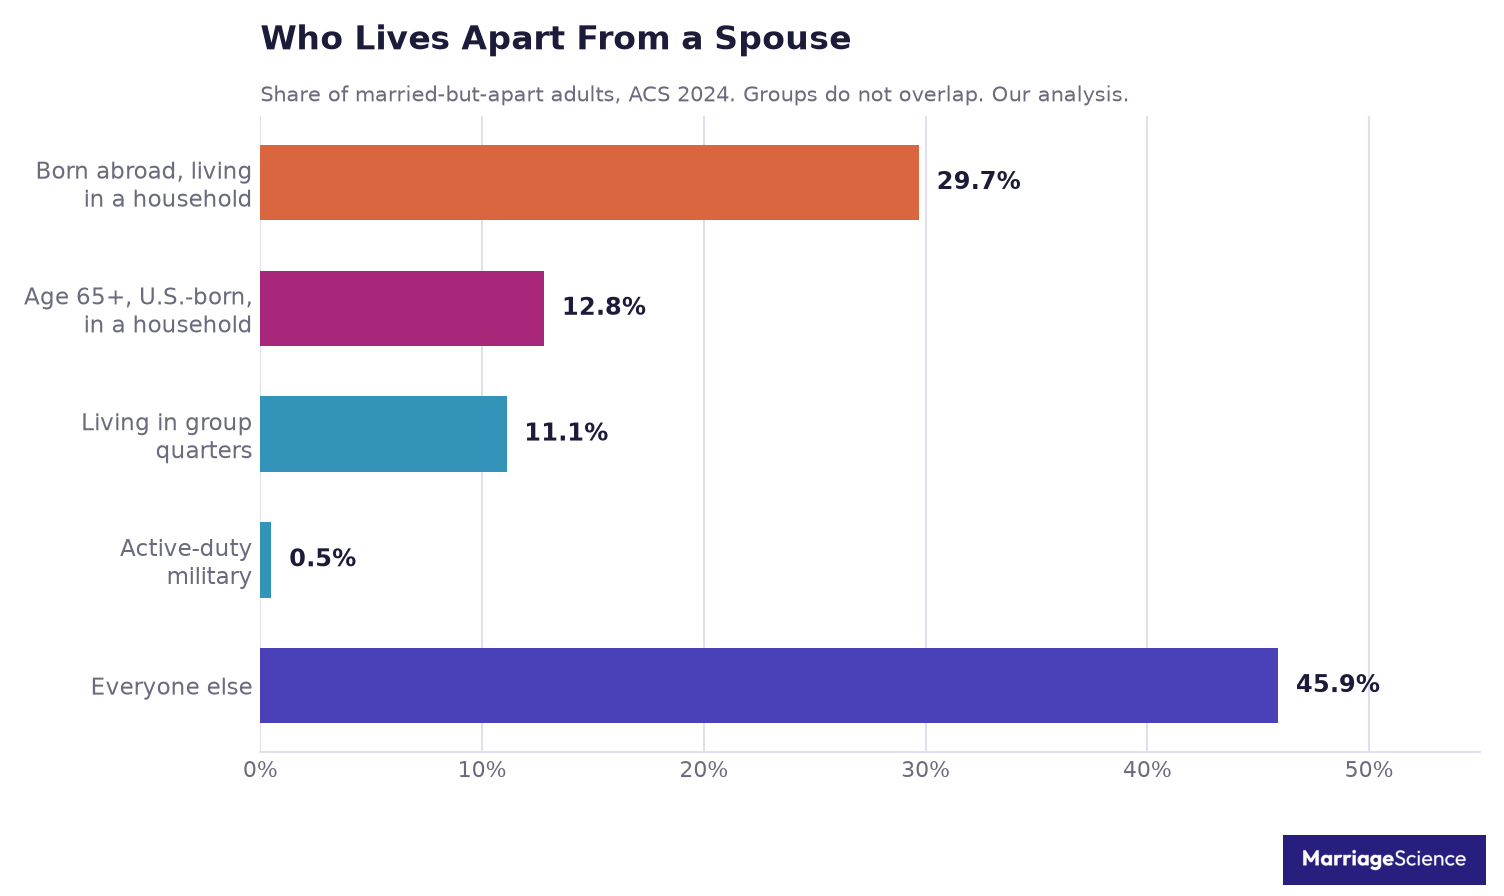
The composition of the married-but-apart group shows how the Census count mixes choice with circumstance. People born abroad and living in a household make up 29.7% of the group.
Many of them are likely immigrants whose spouse has not yet joined them, though the survey does not record where the absent spouse lives.
Another 12.8% are aged 65+ U.S.-born people in a household, and 11.1% are in group quarters. Active-duty military members in a household make up 0.5%. Everyone else makes up 45.9%.
That last category is the part closest to the living apart together lifestyle as the phrase is often used, meaning working-age, U.S.-born, household-living married adults. It is less than half of the married-but-apart group.
The Census cannot say why any one couple lives apart. A spouse may be abroad, in a care setting, in group quarters, on military assignment, or in a chosen two-home marriage.
These ACS shares are higher than the CPS totals for the reasons covered in the previous section.
Living Apart Together by State
Our analysis of the American Community Survey 2023 and 2024 pooled finds a wide range across states among married adults 18 and older. The measure is the share of married adults living apart from a spouse, counted where they live at the time of the survey.
The District of Columbia is highest at 7.4%, followed closely by Hawaii at 7.3% and Alaska at 6.9%. New York, Nevada, and California also sit near the top, while Florida and Texas have the same share at 5.4%.
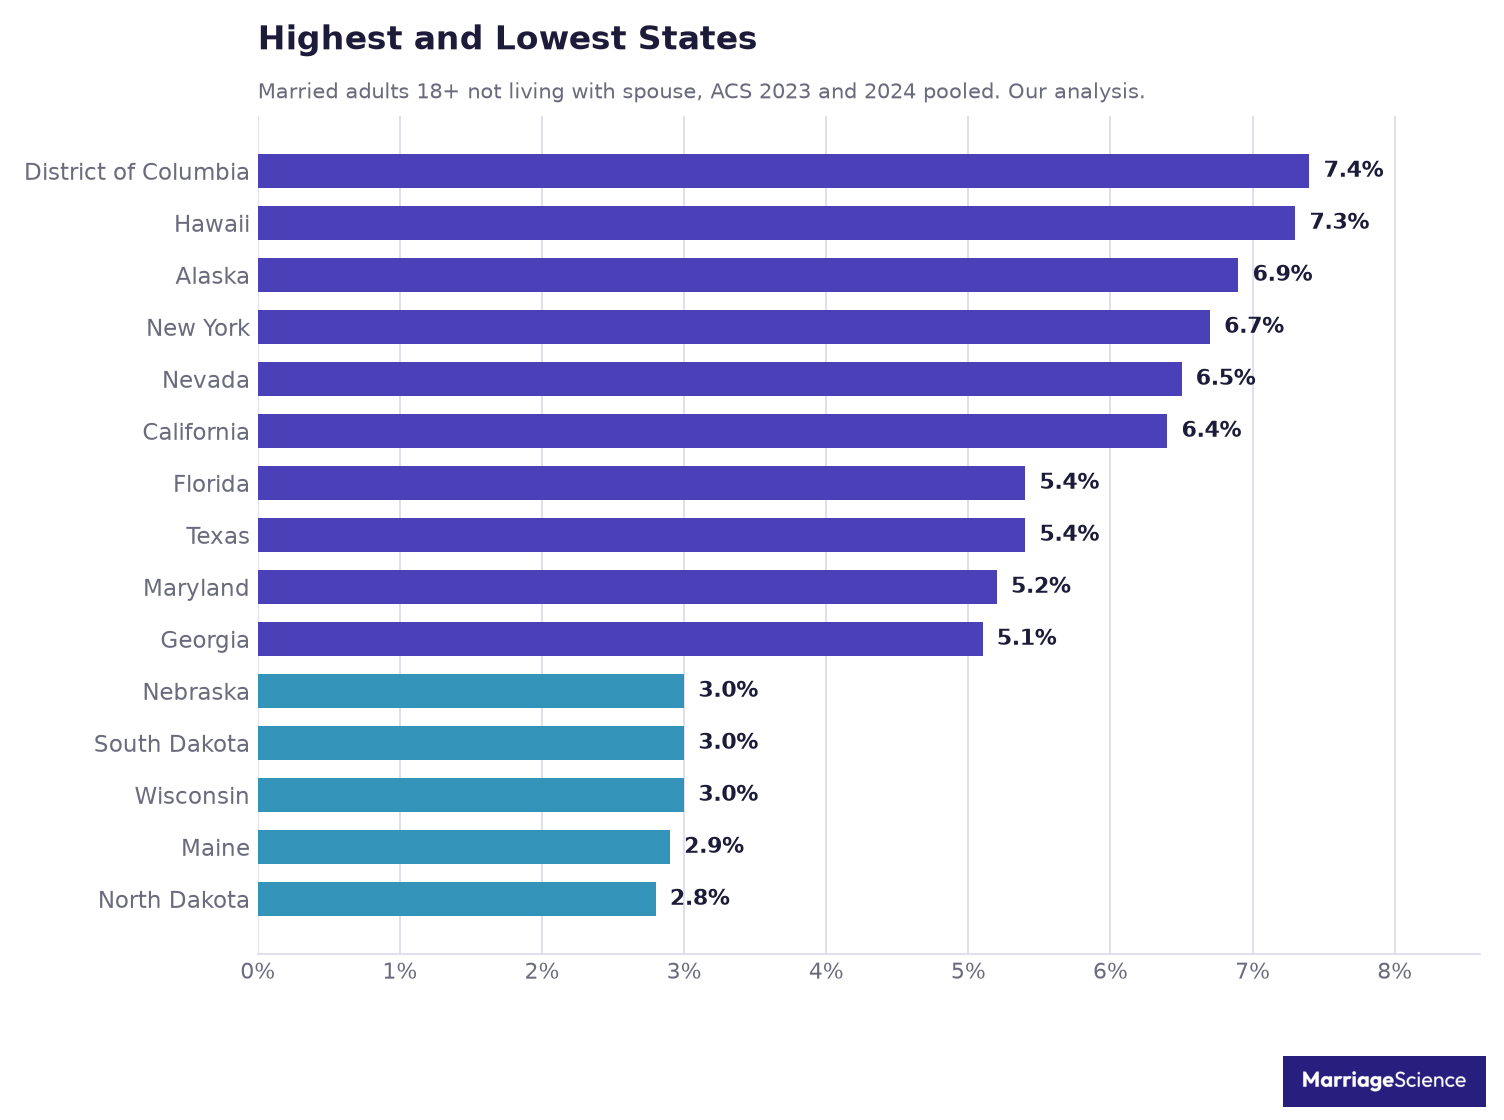
Several places near the top also have large immigrant populations, including California, New York, Nevada, and Florida. Hawaii and Alaska also have large military populations.
The survey does not record the reason a spouse is away, so those details describe the states and say nothing about any one couple.
Population size changes the reading. California has the largest number, about 949 thousand married adults a year living apart.
Texas has about 653 thousand, while New York has about 491 thousand. A state can rank lower by share and still account for a large number of people because it has a large married population.
The lower end of the table is concentrated in the Upper Midwest and northern New England. North Dakota is lowest at 2.8%, followed by Maine at 2.9%.
Iowa, Minnesota, Nebraska, South Dakota, and Wisconsin are all listed at 3.0%.
We pooled 2023 and 2024 to steady the estimates for small states. That matters most where the married population is smaller and the living-apart group is smaller still.
The table keeps the top 10 and ranks 42 to 51 in one view.
| Rank | State | Share living apart |
| 1 | District of Columbia | 7.4% |
| 2 | Hawaii | 7.3% |
| 3 | Alaska | 6.9% |
| 4 | New York | 6.7% |
| 5 | Nevada | 6.5% |
| 6 | California | 6.4% |
| 7 | Florida | 5.4% |
| 8 | Texas | 5.4% |
| 9 | Maryland | 5.2% |
| 10 | Georgia | 5.1% |
| 42 | Wyoming | 3.3% |
| 43 | Vermont | 3.2% |
| 44 | Idaho | 3.1% |
| 45 | Iowa | 3.0% |
| 46 | Minnesota | 3.0% |
| 47 | Nebraska | 3.0% |
| 48 | South Dakota | 3.0% |
| 49 | Wisconsin | 3.0% |
| 50 | Maine | 2.9% |
| 51 | North Dakota | 2.8% |
LAT Couples Who Are Not Married
Unmarried LAT couples are harder to count than married couples living apart because standard household surveys often sort them into the single population. Strohm and colleagues used the General Social Survey 1996 and 1998 to ask about this directly.
They found that 7% of U.S. women and 6% of U.S. men said they were in a LAT relationship.
That small share became much larger when the base was limited to adults who were neither married nor cohabiting. In that group, 35% said they were in a LAT relationship, even though standard statistics would usually count them as single.
This is why unmarried LAT is easy to miss in household counts.
| Group | In a LAT relationship | Source |
| U.S. women | 7% | Strohm and colleagues, General Social Survey 1996 and 1998 |
| U.S. men | 6% | Strohm and colleagues, General Social Survey 1996 and 1998 |
| Adults neither married nor cohabiting | 35% | Strohm and colleagues, General Social Survey 1996 and 1998 |
| Lesbians in the California Quality of Life Survey | 15% | California Quality of Life Survey |
| Gay men in the California Quality of Life Survey | 17% | California Quality of Life Survey |
| Canadians aged 20 and older | 7.4%, about 1.9 million people | Statistics Canada, General Social Survey 2011 |
The U.S. data also show that unmarried LAT did not mean the same living arrangement for women and men. Among women in LAT relationships, 45% lived with children, against 9% of men in LAT relationships.
The relationship could be outside the home while day to day family responsibilities were inside it.
The California Quality of Life Survey found LAT relationships across sexual orientation groups. In that survey, 15% of lesbians and 17% of gay men were in LAT relationships, against 12% of heterosexual women and 13% of heterosexual men.
The pattern was not limited to heterosexual dating.
The same paper cited a European comparison from Kiernan, 2000. Among women aged 20 to 39 who had never married or cohabited, LAT ran from 32% in France to 47% in Switzerland.
That comparison points to a young adult pattern, especially among people who had not yet entered marriage or cohabitation.
Canadian data give a clearer age profile. In the General Social Survey 2011, 7.4% of Canadians aged 20 and older, about 1.9 million people, were in a LAT couple, slightly fewer than in 2001.
The share was 31% at ages 20 to 24 and 17% at ages 25 to 29, then fell to between 3% and 5% from ages 30 to 59.
Later life had a smaller share, with 2% of people aged 60 and older in a LAT couple, up slightly from 2001. Taken together, these figures make unmarried LAT look mostly like a young adult stage, with a smaller and growing place in later life.
The U.S. evidence is old. No U.S. federal survey has asked the question since, and the GSS figures are three decades old.
Current U.S. counts of unmarried LAT couples are therefore much thinner than the counts for married people living apart.
Couples who do move in together before the wedding have their own research record, covered in our analysis of living together before marriage.
Why Couples Choose to Live Apart
Living apart does not point to a single story. Statistics Canada asked people in LAT couples, “What is the reason you are living apart?”
The answers split between outside pressures, joint decisions, and relationships that had not reached the stage of sharing a home.
| Reason | Share of LAT Canadians |
| Circumstances | 42% |
| Both partners decided | 32% |
| Had not considered living together | 17% |
| The respondent wanted to | 7% |
| The partner wanted to | 1% |
The largest answer was circumstances, at 42%. When Statistics Canada broke those circumstances down, studies accounted for 26%, finances for 25%, and work for 15%.
Work rose to 32% among those aged 40 to 49, which fits a life stage when job location and household commitments can be hard to align.
Choice played a part too. Statistics Canada said choice was clearly a factor in 39% of cases.
Age changed that balance sharply, with two-thirds of people 60 and older LAT by choice, against 31% of those aged 20 to 24.
Among those who chose to live apart, the most common reason was being not yet ready to live together, at 48%. Keeping independence accounted for 28% of those who chose it, and 11% of all LAT couples.
That gives the young-adult pattern a different shape from the later-life pattern, since younger couples were more often waiting on school, money, or readiness.
Independence mattered much more after 60. It was the reason for 37% of people 60 and older, compared with 15% at 40 to 49 and 4% at 20 to 24.
Among people 60 and older, women named independence 46% of the time, while men named it 30% of the time.
Distance adds another layer. Statistics Canada found that 45% lived in the same neighborhood as their partner, 34% lived 30 to 60 minutes away, and about 2 in 10 lived an hour or more apart.
Among those apart for work, about 7 in 10 lived an hour or more away.
For readers dating again later in life, our guide compares dating sites for people over 50.
Older adults who keep their own homes are also the group most exposed to isolation, which our loneliness statistics track.
Does Living Apart Together Last
For most couples, living apart together looks more like a stage than a settled arrangement. Statistics Canada reported in 2011 that 33% of people in LAT couples said they would “certainly” move in with their partner, and 37% said they would “probably” do so.
That does not mean every LAT relationship is waiting for a shared address. Fewer than 1 in 6 did not plan to live with their partner.
Among those 60 and older, almost 60% did not plan to.
Age matters because the meaning of living apart often changes across the life course. In the Canadian answers, younger couples were mostly kept apart by school, money or not being ready.
The clearest evidence for a chosen and lasting LAT arrangement points to a small group. Only 11% were in a LAT couple that was both chosen and meant to stay that way.
For that minority, living apart was not simply a delay before cohabitation.
U.S. evidence is thinner, especially for married couples who choose to live apart. Strohm and colleagues note that most unmarried LAT relationships in U.S. studies are short.
That finding fits the idea that LAT is often temporary, but it does not answer whether chosen LAT marriages last.
Rindfuss and Stephen, writing in the Journal of Marriage and the Family in 1990, found that marriages were more likely to break up when the spouses did not live together. That is old evidence about young adults and mostly involuntary separations.
No U.S. study has tested chosen LAT marriages in the same way.
The same caution applies to happiness. No U.S. survey measures whether LAT couples are happier.
The available data can show who lives apart, who plans to move in, and which groups prefer to stay separate, but it cannot settle whether the arrangement is better or worse for the people in it.
Marriages that end after 50 follow a different pattern, set out in our gray divorce statistics.
Methodology and Sources
The counts here come from our analysis of the Current Population Survey and the American Community Survey. We used public Census Bureau microdata, applied person weights, and kept the survey definitions separate because the two files identify married people and household ties in different ways.
For the long national trend, we used CPS ASEC 2000 to 2025 from the Census Bureau’s microdata API. The universe is adults 15+.
We applied weight MARSUPWT and used the marital status code “married, spouse absent”, the Census label behind the main CPS series. We left out 2014 because of the split sample.
For the more detailed recent estimates, we used ACS 1-year PUMS 2023 and 2024 from the same API. The 2024 file includes 1,476,657 married respondents.
We applied weight PWGTP. In the ACS, married means “now married”, which excludes separated people.
We treated a married person as spouse present if the person was the head of a married-couple household, the spouse of the householder, the husband or wife in a married-couple subfamily, or paired with another married adult in the same home with an age gap 20 years or less. Married respondents outside those groups were counted as living apart.
We checked the method against published benchmarks. Bankey reported 12.5% for 2023 newlyweds in an NCFMR Family Profile, while our matching estimate was 12.24%.
Strohm, Seltzer, Cochran and Mays reported 3.1% for 2006, while our matching estimate was 3.09%.
State figures pool 2023 and 2024 to steady small states. The surveys have limits.
Neither survey asks why a spouse is absent, so work, school, caregiving, military service, immigration, incarceration, conflict, and other reasons cannot be separated here. Unmarried LAT couples are invisible in both data sets.
Group quarters residents are counted as apart in the ACS.
We also left out claims that did not match the measurement. A housing-cost figure from the same news stories described single-person households, not LAT couples.
We also left out any claim that LAT couples are happier, because that claim is outside these data.
Sources:
- Current Population Survey ASEC 2000 to 2025, U.S. Census Bureau.
- American Community Survey 1-year PUMS 2023 and 2024, U.S. Census Bureau.
- Bankey, Married and Living Apart Together, NCFMR Family Profile 27, 2025.
- Strohm, Seltzer, Cochran and Mays, Demographic Research, 2009.
- Turcotte, Living Apart Together, Statistics Canada, 2013.
- Rindfuss and Stephen, Journal of Marriage and the Family, 1990.