


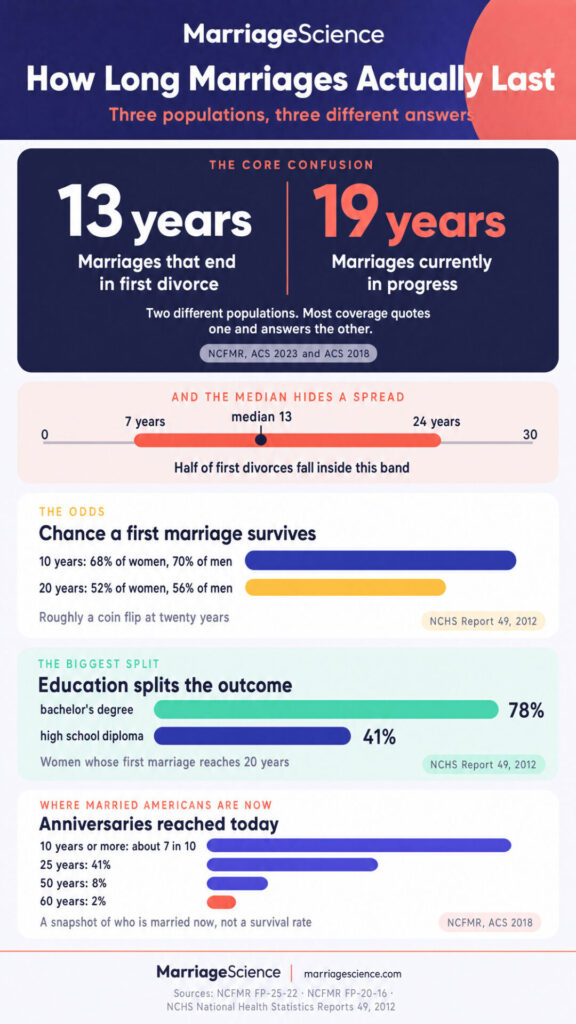
American marriages that end in divorce last a median of 13 years, and marriages currently in progress have a median duration of 19 years (NCFMR Family Profile FP-25-22, American Community Survey 2023; NCFMR FP-20-16, ACS 2018). Those are two different populations, and most coverage of this topic quotes one while answering the other.
The figure circulating on almost every page about marriage length is around 8 years. It predates 2010. The NCFMR series shows the median at first divorce rising from 11 years in 2010 to 13 in 2020, where it has stayed.
England and Wales record 12.7 years for opposite-sex divorces in 2023, up from 8.9 years in 1985, which is the shortest median on record there (Office for National Statistics, Divorces and Dissolutions in England and Wales 2023).
We aggregated data from Bowling Green State University’s National Center for Family and Marriage Research, the CDC’s National Center for Health Statistics, the U.S. Census Bureau’s American Community Survey, the Office for National Statistics, and the 2006 to 2010 National Survey of Family Growth.
Key Takeaways
- Median duration of marriage at first divorce is 13 years for both men and women (NCFMR Family Profile FP-25-22, ACS 2023).
- Median duration of all marriages currently in progress is 19 years, and 21 years for people in a first marriage (NCFMR FP-20-16, ACS 2018).
- 68% of women and 70% of men reach their tenth wedding anniversary in a first marriage (Copen, Daniels, Vespa and Mosher, NCHS National Health Statistics Reports 49, 2012).
- 52% of women and 56% of men reach their twentieth anniversary in a first marriage (NCHS NHSR 49, 2012, from the 2006 to 2010 National Survey of Family Growth).
- 78% of women with a bachelor’s degree reach 20 years of marriage, against 41% of women with a high school diploma (NCHS NHSR 49, 2012).
- 8% of currently married Americans have passed a 50th anniversary and 2% have passed a 60th (NCFMR FP-20-16, ACS 2018).
- Opposite-sex marriages in England and Wales ran a median of 12.7 years before divorce in 2023, compared with 8.9 years in 1985 (ONS, Divorces and Dissolutions in England and Wales 2023).
- The middle half of American first divorces span 7 to 24 years of marriage for women and 6 to 23 years for men, an interquartile range of 17 years in both cases (NCFMR FP-25-22, 2025).
- Third and later marriages run a median of 13 years, against 21 years for first marriages (NCFMR FP-20-16, ACS 2018).
- 86% of separated women and 87% of separated men complete a divorce within five years of separating (NCHS NHSR 49, 2012).
- Female same-sex marriages in England and Wales ended after a median of 6.3 years in 2023, against 12.7 years for opposite-sex couples, a comparison bounded by the 2014 change in the law (ONS, 2023).
- The 20-year survival probability for women barely moved between the 1995 and the 2006 to 2010 surveys, from 50% to 52% (NCHS NHSR 49, 2012).
1. How Long a Marriage Lasts Before Divorce
This measure counts only the marriages that ended, which makes it the most quoted and the most misread number on the subject. It says nothing about how long a marriage lasts in general, because every marriage that ends with a funeral is excluded from the calculation.
The American median has risen two years since 2010, from 11 to 13. The 8-year figure that dominates search results for this question describes a period that ended before that rise began.
| Metric | Value | Source |
| Median duration of marriage at first divorce, U.S., 2023 | 13 years for women and men | NCFMR Family Profile FP-25-22 (ACS 2023) |
| Interquartile range, women | 7 to 24 years | NCFMR FP-25-22 |
| Interquartile range, men | 6 to 23 years | NCFMR FP-25-22 |
| Median at first divorce, U.S., 2010 | 11 years | NCFMR FP-25-22 |
| Median at divorce, England and Wales, 2023 (opposite-sex) | 12.7 years | ONS, Divorces and Dissolutions 2023 |
| Median at divorce, England and Wales, 1985 | 8.9 years, the shortest on record | ONS, 2023 bulletin |
| Longest median duration by group, U.S. women | 16 years, foreign-born Hispanic women | NCFMR FP-25-22 |
| Shortest median duration by group, U.S. men | 10 years, native-born Hispanic men | NCFMR FP-25-22 |
The interquartile range is the row worth quoting alongside the median. Half of American first divorces happen somewhere between the seventh and twenty-fourth year of marriage, which is a spread of 17 years around a single headline figure (NCFMR Family Profile FP-25-22). Our divorce statistics roundup covers the rates those durations sit inside.
2. How Long All Marriages Last
Ask how long the average marriage lasts and the honest answer uses a different denominator: everyone who is married right now, including every couple whose marriage will end with a death rather than a court order.
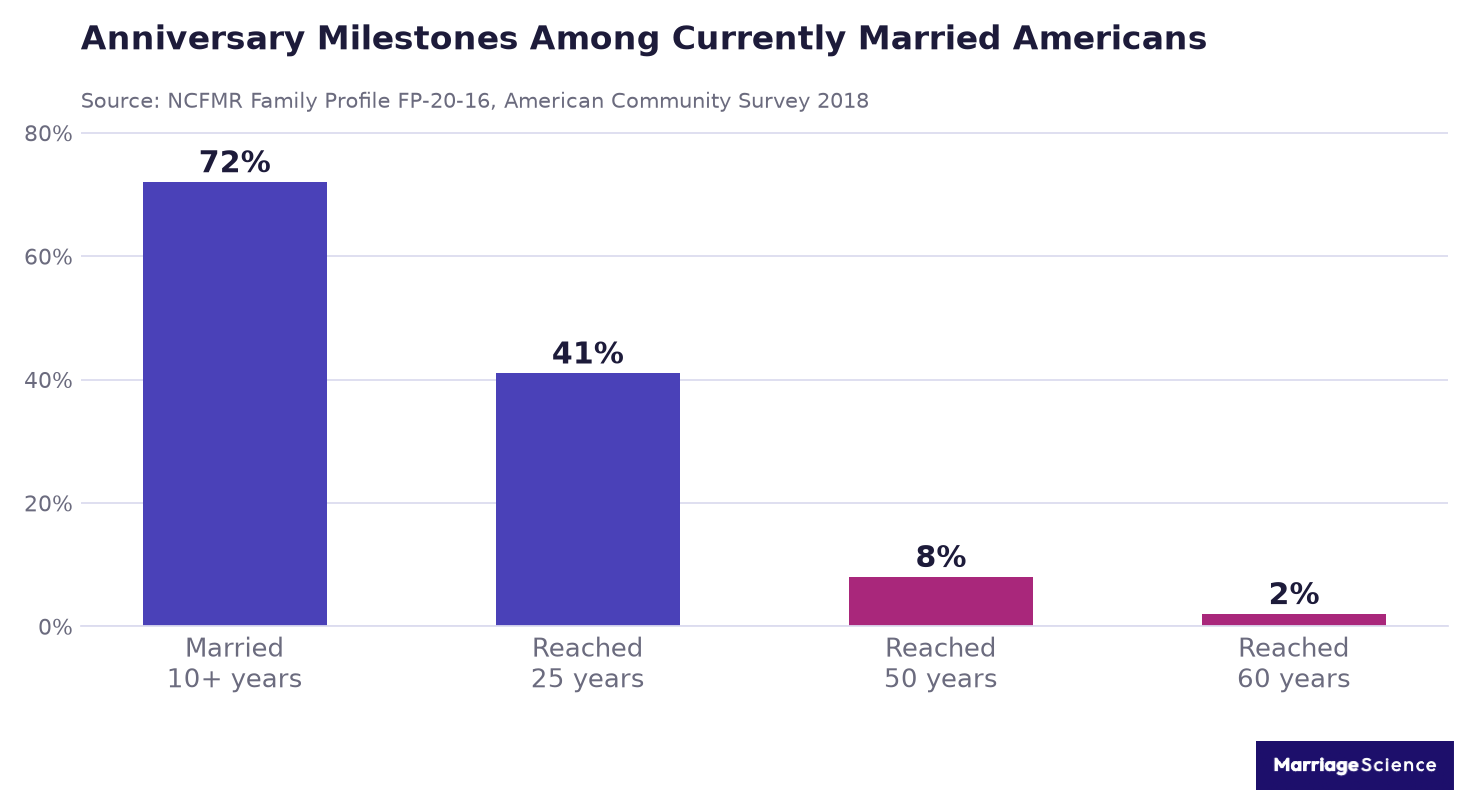
The median marriage in progress has already lasted 19 years, and 41% of married Americans have passed a silver anniversary. That is six years longer than the duration-at-divorce figure, measured on a population that is still counting.
| Metric | Value | Source |
| Median duration of all current marriages, U.S., 2018 | 19 years | NCFMR Family Profile FP-20-16 (ACS 2018) |
| Median duration, people in a first marriage | 21 years | NCFMR FP-20-16 |
| Median duration, second marriage | 17 years | NCFMR FP-20-16 |
| Median duration, third or later marriage | 13 years | NCFMR FP-20-16 |
| Married in the past ten years | 28% | NCFMR FP-20-16 |
| Reached a 25th anniversary | 41% | NCFMR FP-20-16 |
| Reached a 50th anniversary | 8% | NCFMR FP-20-16 |
| Reached a 60th anniversary | 2% | NCFMR FP-20-16 |
| Median duration by education, no college and bachelor’s degree | 22 years and 17 years | NCFMR FP-20-16 |
The education row inverts once you switch measures, which is a good test of whether a statistic is being read correctly. College graduates show shorter current marriages here because they marry later, and the same group shows the highest 20-year survival probability in section 3 (NCFMR Family Profile FP-20-16). Our marriage statistics page tracks the age at first marriage behind that.
This measure has its own bias, running the opposite way from the divorce one. A marriage that is still going has not finished accumulating years, so the 19-year median understates how long these marriages will eventually run.
The anniversary rows are the closest thing to an intuitive answer. Roughly seven in ten married Americans have been married a decade or more, four in ten have reached 25 years, and fewer than one in ten has reached 50.
The 50-year figure gets misquoted in both directions. It is not the share of marriages that last 50 years, because most of the people in the denominator have not been married long enough to have had the chance. It is a snapshot of who is married today and how long they have been at it.
3. The Survival Curve: Reaching 5, 10 and 20 Years
Neither median answers the question people are usually asking, which is what the odds are. For that you need a life table, and the last one built on a national American sample used the 2006 to 2010 National Survey of Family Growth.
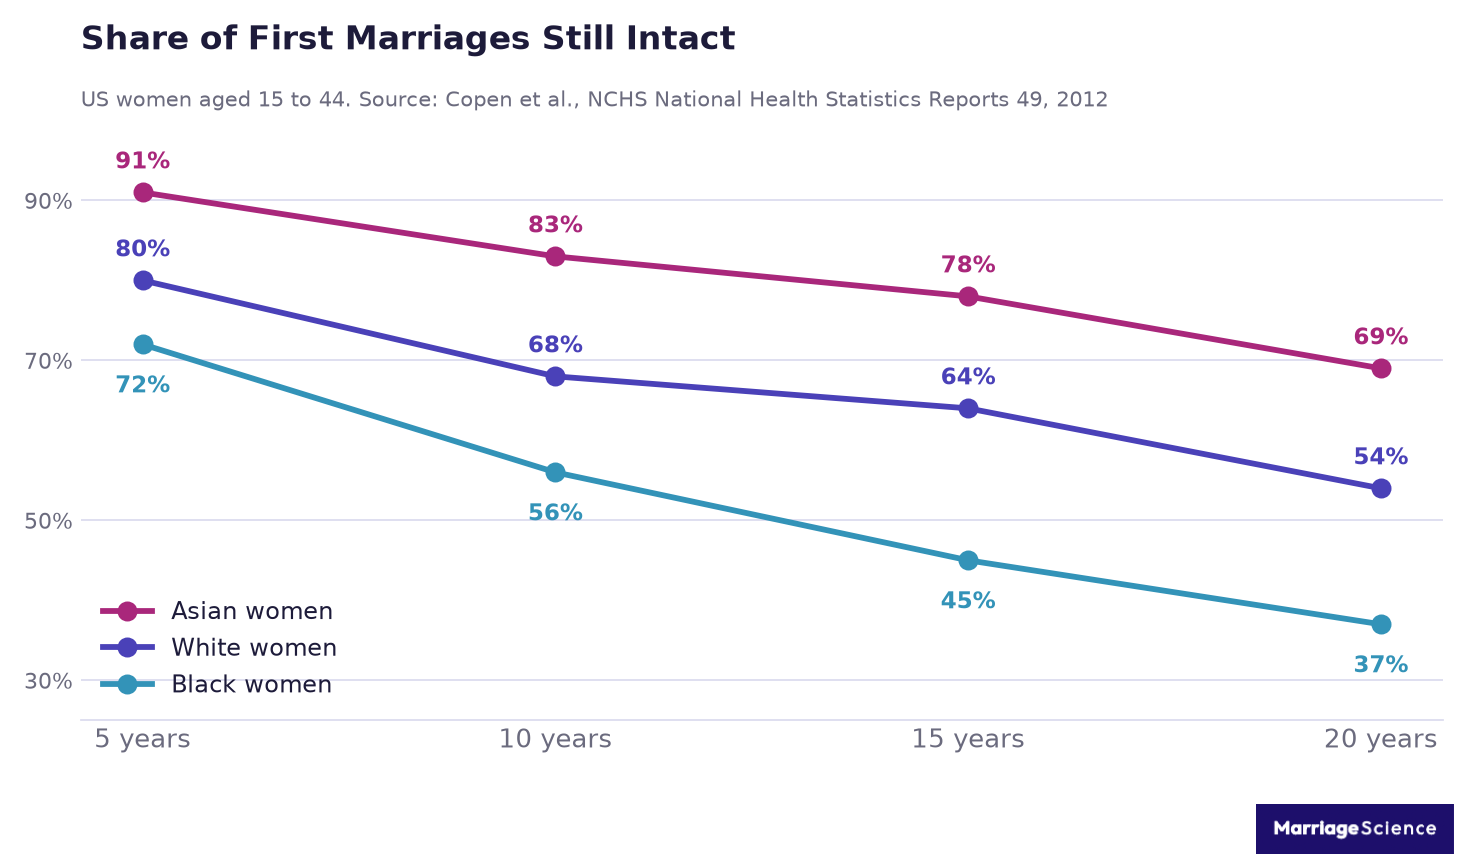
A first marriage has roughly a coin-flip chance of reaching its twentieth anniversary: 52% for women and 56% for men. The remainder ended in divorce, separation or, rarely, death.
| Metric | Value | Source |
| First marriage intact at 10 years | 68% of women, 70% of men | NCHS National Health Statistics Reports 49, 2012 |
| First marriage intact at 20 years | 52% of women, 56% of men | NCHS NHSR 49, 2012 |
| Intact at 5, 10, 15 and 20 years, white women | 80%, 68%, 64%, 54% | NCHS NHSR 49, 2012 |
| Intact at 5, 10, 15 and 20 years, Black women | 72%, 56%, 45%, 37% | NCHS NHSR 49, 2012 |
| Intact at 5, 10, 15 and 20 years, Asian women | 91%, 83%, 78%, 69% | NCHS NHSR 49, 2012 |
| Intact at 20 years, foreign-born Hispanic men | 70%, the highest of any group | NCHS NHSR 49, 2012 |
| 20-year probability, women, 1995 and 2006 to 2010 | 50% and 52%, no significant change | NCHS NHSR 49, 2012 |
| Sample | 12,279 women and 10,403 men aged 15 to 44 | NCHS NHSR 49, 2012 |
The authors flag a limitation that anyone quoting these numbers should carry with them. Because the survey stops at age 44, a person whose first marriage survived 20 years had to have married by 24, so the estimates lean toward people who married young and understate the durability of later marriages (Copen, Daniels, Vespa and Mosher, NCHS, 2012).
These are also the most recent national life-table estimates of their kind. Nothing published since has replaced them, which is why a 2012 report is still the standard citation on this question.
4. Who Stays Married Longer
Education produces the largest gap in the survival data by a wide margin, and it is much larger for women than for men.
78% of women with a bachelor’s degree see a first marriage reach 20 years, against 41% of women with a high school diploma and 39% of women who did not finish high school. Among men the same comparison runs 65% against 47%.
| Metric | Value | Source |
| 20-year survival, women by education | 39% less than high school, 41% high school, 49% some college, 78% bachelor’s | NCHS NHSR 49, 2012 |
| 20-year survival, men by education | 54% less than high school, 47% high school, 54% some college, 65% bachelor’s | NCHS NHSR 49, 2012 |
| Marrying before age 20 | lower probability of reaching a 20th anniversary | NCHS NHSR 49, 2012 |
| Women with no births at the time of first marriage | 56% reach 20 years, against 33% for women with one or more | NCHS NHSR 49, 2012 |
| Men with no biological children at first marriage | 59% reach 20 years, against 43% for men with children | NCHS NHSR 49, 2012 |
| First birth 8 months or more after marriage, women | 77% reach 15 years, against 44% for a premarital first birth | NCHS NHSR 49, 2012 |
| Women whose first husband had been married before | 38% reach 20 years, against 54% otherwise | NCHS NHSR 49, 2012 |
| Duration at first divorce by education, U.S. women | 15 years with high school or less, 12 years with some college or a bachelor’s | NCFMR FP-25-22 (ACS 2023) |
Every row above is an association measured on a survey, and none of them is a mechanism. Education travels with income, age at marriage, region and family background, and the report separates none of those (NCHS NHSR 49, 2012).
Note the last row, because it runs against the pattern above it. Women with less education divorce later in the marriage even though they divorce more often, which is the kind of result that gets flattened whenever someone reports a single number for a group.
5. Second Marriages, Third Marriages and Same-Sex Marriages
Each successive marriage is shorter than the one before it in the current-duration data, partly because remarriages start later in life and have less time available.
A third or later marriage runs a median of 13 years against 21 for a first marriage, a gap of eight years.
| Metric | Value | Source |
| Median duration, first marriage | 21 years | NCFMR FP-20-16 (ACS 2018) |
| Median duration, second marriage | 17 years | NCFMR FP-20-16 |
| Median duration, third or later marriage | 13 years | NCFMR FP-20-16 |
| Median duration at divorce, female same-sex couples, England and Wales 2023 | 6.3 years | ONS, Divorces and Dissolutions 2023 |
| Median duration at divorce, male same-sex couples, England and Wales 2023 | 7.2 years | ONS, 2023 |
| Most common duration at divorce, female same-sex couples, 2023 | 4 years (172 divorces) | ONS, 2023 |
| Same-sex marriage legal in England and Wales since | March 2014 | Marriage (Same Sex Couples) Act 2013 |
The same-sex rows carry a hard ceiling. No same-sex marriage in England and Wales can yet have lasted more than 12 years, so the 6.3 and 7.2 year medians cannot be compared with the opposite-sex figure of 12.7 without accounting for that (ONS, 2023). Our page on the lesbian divorce rate works through the register-based evidence that survives that problem.
6. The Gap Between Separating and Divorcing
Duration statistics measure the legal marriage, not the relationship, and the two stop at different times. The months or years between moving out and receiving a final order are counted as married in every figure on this page.
About half of separated women had divorced within one year, 79% within three years and 86% within five. For men the same milestones are 65%, 81% and 87%.
| Metric | Value | Source |
| Divorced within 1 year of separation | about 50% of women, 65% of men | NCHS NHSR 49, 2012 |
| Divorced within 3 years of separation | 79% of women, 81% of men | NCHS NHSR 49, 2012 |
| Divorced within 5 years of separation | 86% of women, 87% of men | NCHS NHSR 49, 2012 |
| Median time from separation to divorce, white women and men | 9 months and 7 months | NCHS NHSR 49, 2012 |
| Median time from separation to divorce, Hispanic women and men | 15 months and 11 months | NCHS NHSR 49, 2012 |
| Median time from separation to divorce, Black women and men | 18.5 months and 18 months | NCHS NHSR 49, 2012 |
| Divorced within 1 year, by education, women | 58% with more than high school, 37% without | NCHS NHSR 49, 2012 |
| Divorced within 1 year, by education, men | 66% with more than high school, 54% without | NCHS NHSR 49, 2012 |
The education gap in that last pair is usually read as a cost gap. Finalising a divorce takes money and legal access, and the people who separate without either stay legally married longer, which lengthens their recorded marriage duration without lengthening the marriage. Couples who want the financial terms settled in advance can start with our prenuptial agreement guide.
7. How the Numbers Have Changed Since the 1980s
Marriages that end in divorce have been getting longer for forty years on both sides of the Atlantic. Very little of that reflects marriages becoming more durable.
The English median at divorce rose 3.8 years between 1985 and 2023, while the American 20-year survival probability moved two percentage points across eleven years of survey waves. Duration is climbing and survival is flat, which points at composition rather than at stability.
| Metric | Value | Source |
| Median duration at divorce, England and Wales, 1985 and 2023 | 8.9 and 12.7 years | ONS, Divorces and Dissolutions 2023 |
| Median duration at first divorce, U.S., 2010 and 2020 | 11 and 13 years | NCFMR FP-25-22 |
| Median duration at first divorce, U.S., 2023 | 13 years, unchanged since 2020 | NCFMR FP-25-22 |
| Median duration of all current marriages, U.S., 2009 and 2018 | 18 and 19 years | NCFMR FP-20-16 |
| 20-year survival for women, 1995 and 2006 to 2010 | 50% and 52% | NCHS NHSR 49, 2012 |
| Median age at first marriage, 2006 to 2010 | 25.8 for women, 28.3 for men | NCHS NHSR 49, 2012 |
| Divorce rate per 1,000 people aged 15 and over, 2009 | 9.7 for women, 9.2 for men | NCHS NHSR 49, 2012 |
Two things are moving at once. People marry later, which pushes the whole duration distribution to the right, and fewer people marry at all, which removes from the population many of the couples who would previously have divorced early (ONS, 2023).
Neither of those makes any individual marriage more likely to survive. A couple marrying at 32 who divorce after 14 years produces a longer recorded duration than a couple marrying at 22 who divorce after 10, and both marriages ended.
What would settle the question is a fresh national life table, and there has not been one since 2012. Until NCHS publishes survival estimates from the 2022 to 2023 survey, anyone claiming marriages have become more durable is reading a duration statistic and calling it a survival statistic.
8. How Long Marriages Last in Each State
Our analysis uses Census American Community Survey microdata and keeps the two measures separate. For marriages that ended, we looked at first marriages of people who divorced in the past 12 months using the 2020 to 2024 five year file. For marriages in progress, we looked at current first marriages using the 2024 one year file.
The table below gives each state’s rank, state name, median years before a first marriage ended in divorce, the middle half of those durations and the median years for current first marriages. It leads with the divorce measure because that is the cleaner way to compare how long ended first marriages lasted across states. There are 49 ranked states, while the District of Columbia and Wyoming have fewer than 100 sampled divorces in five years, so they appear without a rank.
Nationally, a first marriage that ended in divorce had lasted a median of 13 years, with a middle half of 7 to 23 years. That matches the National Center for Family and Marriage Research’s 13-year figure for 2023. Current first marriages had lasted a median of 20 years so far.
The longest divorce durations are concentrated in the Northeast and a few high marriage age states. Vermont is highest at 17 years, followed by New Hampshire at 16. California, Connecticut, Maine, Massachusetts, New Jersey, New York, North Dakota and Rhode Island are each at 15 years.
The shortest median duration before divorce is Utah at 9 years. Kansas and South Dakota are each at 10. Alabama, Arkansas, Indiana, Missouri, Oregon, Tennessee and West Virginia are each at 11 years, giving the lower end of the state table a clear regional tilt.
The pattern is consistent with age at marriage, which an earlier section of this article discusses. Northeast states where failing marriages last longest tend to be places where people marry later. Utah and several Plains and Southern states, where the shortest durations appear, tend to be places where people marry younger, but the table does not say that marriage age causes the difference.
The in progress measure needs a different reading because it mostly reflects each state’s age structure. West Virginia’s current first marriages have lasted a median of 25 years, and 51.3% have passed 25 years. The District of Columbia’s median for current first marriages is 11, which is why the divorce measure comes first.
| Rank | State | Median years before a first marriage ended in divorce | Middle half | Median years, current first marriages |
| 1 | Vermont | 17 | 8 to 27 | 24 |
| 2 | New Hampshire | 16 | 8 to 26 | 23 |
| 3 | California | 15 | 7 to 25 | 20 |
| 3 | Connecticut | 15 | 8 to 26 | 22 |
| 3 | Maine | 15 | 7 to 27 | 23 |
| 3 | Massachusetts | 15 | 8 to 25 | 21 |
| 3 | New Jersey | 15 | 8 to 25 | 21 |
| 3 | New York | 15 | 8 to 27 | 21 |
| 3 | North Dakota | 15 | 8 to 31 | 18 |
| 3 | Rhode Island | 15 | 9 to 25 | 22 |
| 11 | Idaho | 14 | 7 to 24 | 19 |
| 11 | Illinois | 14 | 7 to 24 | 22 |
| 11 | Iowa | 14 | 7 to 24 | 22 |
| 11 | Maryland | 14 | 7 to 24 | 20 |
| 11 | North Carolina | 14 | 7 to 25 | 20 |
| 11 | Pennsylvania | 14 | 7 to 24 | 23 |
| 11 | South Carolina | 14 | 7 to 24 | 21 |
| 11 | Virginia | 14 | 7 to 24 | 20 |
| 11 | Wisconsin | 14 | 8 to 23 | 23 |
| 20 | Arizona | 13 | 7 to 23 | 20 |
| 20 | Delaware | 13 | 7 to 23 | 23 |
| 20 | Florida | 13 | 6 to 24 | 21 |
| 20 | Hawaii | 13 | 6 to 25 | 21 |
| 20 | Kentucky | 13 | 6 to 23 | 21 |
| 20 | Michigan | 13 | 6 to 24 | 23 |
| 20 | Nevada | 13 | 7 to 22 | 18 |
| 27 | Alaska | 12 | 6 to 20 | 16 |
| 27 | Colorado | 12 | 6 to 20 | 18 |
| 27 | Georgia | 12 | 6 to 22 | 19 |
| 27 | Louisiana | 12 | 6 to 24 | 21 |
| 27 | Minnesota | 12 | 7 to 22 | 22 |
| 27 | Mississippi | 12 | 6 to 23 | 21 |
| 27 | Montana | 12 | 7 to 24 | 23 |
| 27 | Nebraska | 12 | 8 to 20 | 20 |
| 27 | New Mexico | 12 | 6 to 22 | 21 |
| 27 | Ohio | 12 | 6 to 23 | 22 |
| 27 | Oklahoma | 12 | 6 to 21 | 19 |
| 27 | Texas | 12 | 6 to 22 | 18 |
| 27 | Washington | 12 | 6 to 21 | 18 |
| 40 | Alabama | 11 | 5 to 21 | 22 |
| 40 | Arkansas | 11 | 6 to 22 | 20 |
| 40 | Indiana | 11 | 5 to 22 | 20 |
| 40 | Missouri | 11 | 6 to 21 | 20 |
| 40 | Oregon | 11 | 6 to 21 | 19 |
| 40 | Tennessee | 11 | 6 to 20 | 20 |
| 40 | West Virginia | 11 | 6 to 21 | 25 |
| 47 | Kansas | 10 | 5 to 22 | 20 |
| 47 | South Dakota | 10 | 5 to 20 | 21 |
| 49 | Utah | 9 | 5 to 20 | 19 |
| Not ranked | District of Columbia (93 sampled divorces) | 11 | 7 to 28 | 11 |
| Not ranked | Wyoming (98 sampled divorces) | 13 | 5 to 24 | 21 |
Summary: Marriage Length by the Numbers
| Metric | Value | Source |
| Median duration of marriage at first divorce, U.S. | 13 years | NCFMR FP-25-22 (ACS 2023) |
| Median duration of all current marriages, U.S. | 19 years | NCFMR FP-20-16 (ACS 2018) |
| Median duration, people in a first marriage | 21 years | NCFMR FP-20-16 |
| Median duration, third or later marriage | 13 years | NCFMR FP-20-16 |
| Interquartile range at first divorce, women | 7 to 24 years | NCFMR FP-25-22 |
| First marriage intact at 10 years | 68% of women, 70% of men | NCHS NHSR 49, 2012 |
| First marriage intact at 20 years | 52% of women, 56% of men | NCHS NHSR 49, 2012 |
| 20-year survival, women with a bachelor’s degree | 78% | NCHS NHSR 49, 2012 |
| 20-year survival, women with a high school diploma | 41% | NCHS NHSR 49, 2012 |
| 20-year survival, Asian women and Black women | 69% and 37% | NCHS NHSR 49, 2012 |
| Reached a 25th anniversary, currently married | 41% | NCFMR FP-20-16 |
| Reached a 50th anniversary, currently married | 8% | NCFMR FP-20-16 |
| Reached a 60th anniversary, currently married | 2% | NCFMR FP-20-16 |
| Median duration at divorce, England and Wales, 2023 | 12.7 years | ONS, 2023 |
| Median duration at divorce, England and Wales, 1985 | 8.9 years | ONS, 2023 |
| Median duration at divorce, female same-sex couples, 2023 | 6.3 years | ONS, 2023 |
| Divorced within 5 years of separation | 86% of women, 87% of men | NCHS NHSR 49, 2012 |
| Median time from separation to divorce, white women | 9 months | NCHS NHSR 49, 2012 |
| Median age at first marriage, 2006 to 2010 | 25.8 women, 28.3 men | NCHS NHSR 49, 2012 |
| Change in 20-year survival for women, 1995 to 2010 | 50% to 52%, not significant | NCHS NHSR 49, 2012 |
Methodology and Sources
Every figure here comes from a federal statistical agency, a national statistics office, or an academic research center analysing their microdata. We excluded divorce-attorney marketing pages and wedding-industry roundups, which are where the widely repeated 8-year figure now lives.
The state figures are our analysis of American Community Survey Public Use Microdata. For the duration of marriages that ended, we used the 2020 to 2024 five-year file, limited the sample to first marriages, and measured duration as survey year minus year of marriage. A state needed a floor of 100 sampled divorces to appear in the ranked state results.
For current marriages, we used the 2024 one-year file. Our national median of 13 years reproduces the published figure from the National Center for Family and Marriage Research.
- N. E. Bankey, Duration of Marriage at First Divorce, 2023, NCFMR Family Profile FP-25-22, Bowling Green State University, using the 2023 American Community Survey via IPUMS USA.
- K. K. Payne, Median Duration of Marriages in the U.S., 2018, NCFMR Family Profile FP-20-16.
- C. E. Copen, K. Daniels, J. Vespa and W. D. Mosher, First Marriages in the United States: Data From the 2006 to 2010 National Survey of Family Growth, National Health Statistics Reports 49, CDC/NCHS, March 2012.
- Office for National Statistics, Divorces and Dissolutions in England and Wales: 2023.
- U.S. Census Bureau, Number, Timing, and Duration of Marriages and Divorces: 2016 (P70-167), the Survey of Income and Program Participation marital-history module, which is the origin of the older duration figures still in circulation.
- M. D. Bramlett and W. D. Mosher, Cohabitation, Marriage, Divorce, and Remarriage in the United States, Vital and Health Statistics Series 23(22), CDC/NCHS, 2002.
- Eurostat, Marriage and divorce statistics, data extracted March 2026.
Three populations appear on this page and they are not interchangeable. Duration at divorce covers only marriages that ended in a courtroom. Duration of current marriages covers marriages still running, most of which will end with a death. Survival probabilities are life-table estimates for a cohort, and no individual couple has a 52% marriage.
The survival figures come from fieldwork carried out between 2006 and 2010 because NCHS has published no replacement. The 2022 to 2023 National Survey of Family Growth public-use files were released in December 2024, so a new life table is the single release most likely to change this page. On the British side, the ONS bulletin for 2024 divorces is the next scheduled update.
We update this page annually. The rest of our research sits on the Marriage Science statistics hub.



