


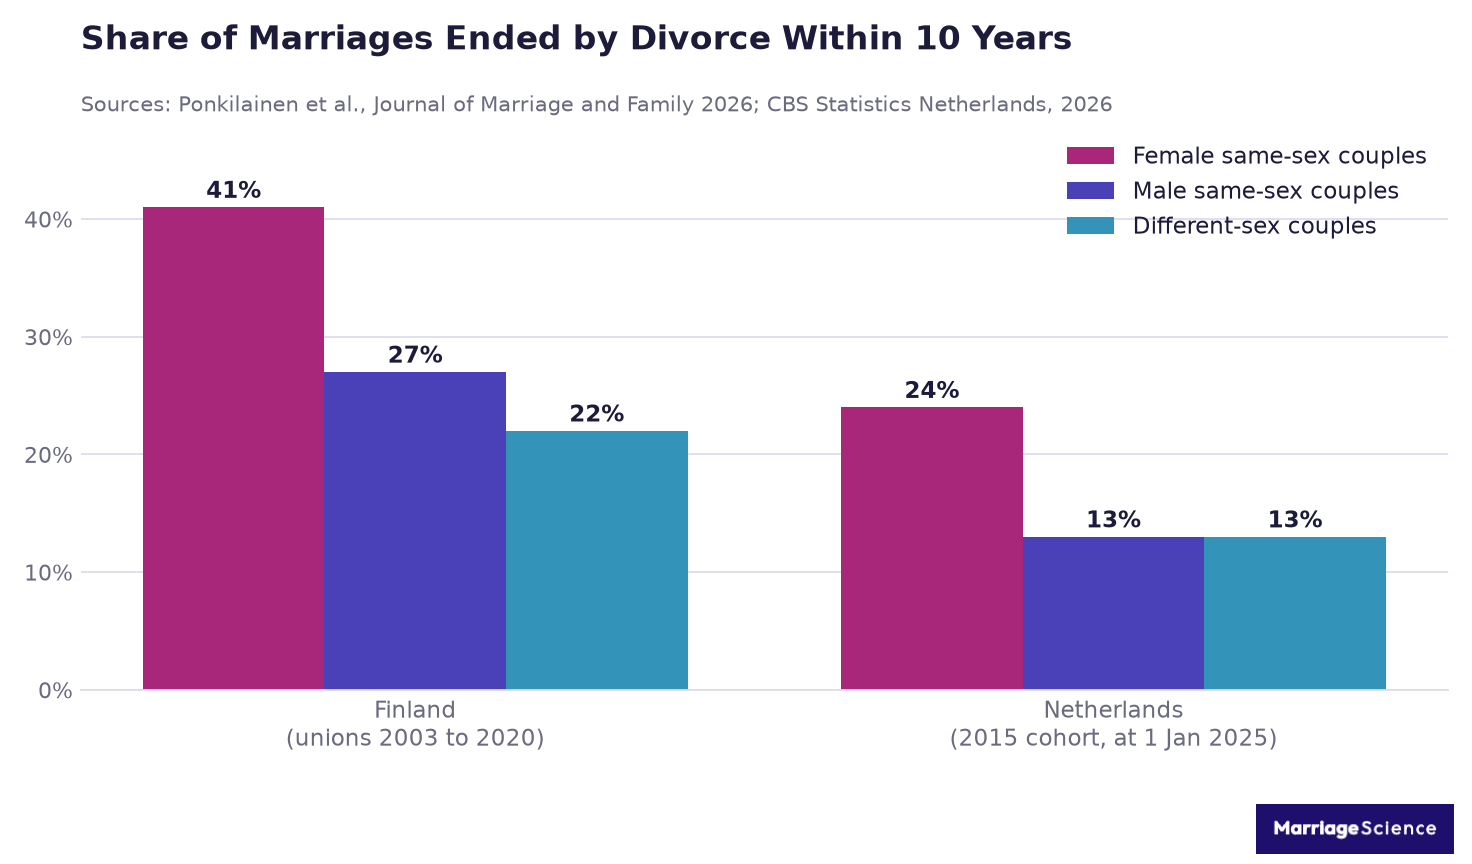
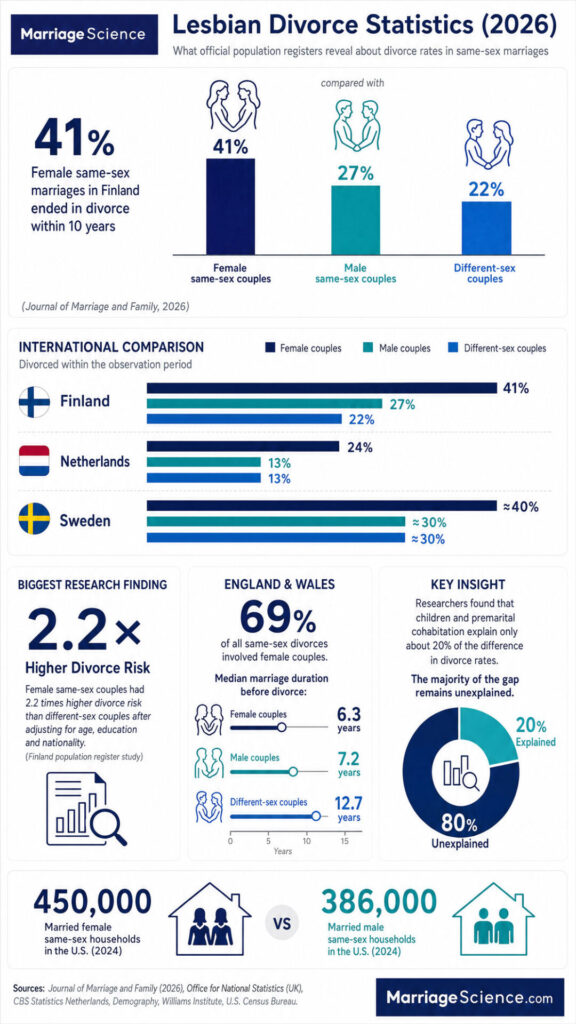
41% of female same-sex marriages in Finland ended in divorce within ten years, against 27% of male same-sex marriages and 22% of different-sex marriages (Ponkilainen, Einiö, Kühn and Myrskylä, Journal of Marriage and Family, 2026). Dutch register data shows the same shape at a smaller scale: of the couples who married in 2015, 24% of female couples had divorced by 1 January 2025, compared with 13% of male couples and 13% of different-sex couples (CBS Statistics Netherlands, 2026).
In England and Wales, female couples accounted for 69.0% of same-sex divorces in 2022 while making up 62.8% of the same-sex marriages formed that year (Office for National Statistics, Divorces and Dissolutions in England and Wales 2022; Marriages in England and Wales 2022). The imbalance is real, and it is smaller than the headline share suggests once the size of each married population is taken into account.
We aggregated figures from the ONS, CBS Statistics Netherlands, Finnish population registers published in the Journal of Marriage and Family, Demography, Advances in Life Course Research and Genus, the U.S. Census Bureau’s American Community Survey, the Williams Institute at UCLA, and Bowling Green State University’s National Center for Family and Marriage Research.
Key Takeaways
- Female couples in Finland had 2.2 times the divorce risk of different-sex couples after adjustment for age, education and nationality, and 1.6 times the risk of male same-sex couples (Ponkilainen et al., Journal of Marriage and Family, 2026).
- 41% of Finnish female same-sex unions formed between 2003 and 2020 ended within ten years, against 22% of different-sex marriages (Ponkilainen et al., 2026).
- Female same-sex marriages in England and Wales lasted a median of 6.3 years before divorce in 2023, compared with 7.2 years for male couples and 12.7 years for opposite-sex couples (ONS, 2023 bulletin, published 2025).
- 1,891 same-sex divorces were granted in England and Wales in 2023, the highest annual figure since the first same-sex divorces were recorded in 2015 (ONS, 2023).
- Female civil partners dissolved their partnerships at 11.2 per 1,000 in 2023, against 7.4 per 1,000 for male civil partners (ONS, 2023).
- Swedish register data put 15-year cumulative divorce at roughly 40% for female same-sex marriages, with male same-sex and opposite-sex marriages both near 30% (Kolk and Andersson, Demography, 2020).
- Norwegian couples formalising unions between 1993 and 2010 showed a five-year divorce risk 2.04 times higher for female couples than for opposite-sex couples (Wiik, Seierstad and Noack, Journal of Marriage and Family, 2014).
- Premarital cohabitation, prior children and shared children together explain only about one fifth of the gap between female same-sex and different-sex divorce risk (Ponkilainen et al., 2026).
- 60.9% of divorces granted to female same-sex couples in England and Wales in 2022 came from a sole applicant, against 46.8% for male couples (ONS, 2022).
- Married female same-sex households in the U.S. reached about 450,000 in 2024 and overtook male couples. The 2005 figure was 178,000 (U.S. Census Bureau, American Community Survey, 2024).
- Married female same-sex households reported a median income of $108,500 in 2024, roughly $32,000 below male couples (U.S. Census Bureau, ACS 2024).
- No U.S. federal agency publishes a divorce rate for same-sex couples by sex. Every reliable rate on this page comes from a European population register or from peer-reviewed work built on one.
1. How Often Female Same-Sex Marriages End
The usable numbers come from four European countries that link every marriage and every divorce to an individual record. That matters because a cumulative divorce percentage answers a question a crude annual rate cannot: of the couples who married in a given year, how many were still married a decade later.
Across Finland, the Netherlands and Sweden, between 24% and 41% of female same-sex marriages end within a decade. Cohorts and measurement windows differ between the three, which accounts for most of that spread.
| Metric | Value | Source |
| Divorced within 10 years, female same-sex unions (Finland, 2003 to 2020) | 41% | Ponkilainen et al., Journal of Marriage and Family 2026 |
| Divorced within 10 years, male same-sex unions (Finland) | 27% | Ponkilainen et al., 2026 |
| Divorced within 10 years, different-sex unions (Finland) | 22% | Ponkilainen et al., 2026 |
| 2015 marriage cohort divorced by 1 Jan 2025, female couples (Netherlands) | 24% | CBS Statistics Netherlands, 2026 |
| 2015 cohort divorced, male couples (Netherlands) | 13% | CBS Statistics Netherlands, 2026 |
| 2015 cohort divorced, different-sex couples (Netherlands) | 13% | CBS Statistics Netherlands, 2026 |
| Cumulative divorce at 15 years, female same-sex marriages (Sweden) | about 40% | Kolk and Andersson, Demography 2020 |
| Cumulative divorce at 15 years, male same-sex and opposite-sex marriages (Sweden) | about 30% | Kolk and Andersson, Demography 2020 |
| Same-sex marriages ending in divorce each year (Netherlands) | more than 400 | CBS Statistics Netherlands, 2026 |
The Swedish series is the longest available anywhere, running from the introduction of registered partnership in 1995 through 2012, and it is the reason we treat any single-year multiple with caution.
Female couples in the late 1990s divorced at more than three times the opposite-sex rate. By the end of the study window that multiple had fallen to about two, and the 2009 gender-neutral marriage law produced no visible break in the trend (Kolk and Andersson, Demography 57(1), 2020).
For the general population comparison, see our divorce statistics roundup, which tracks the U.S. refined divorce rate and the long decline since 1980.
2. The Gender Gap in Same-Sex Divorce
Register studies in Sweden, Norway, Denmark and Finland report the same ordering. Female couples divorce most; male couples sit level with or slightly above different-sex couples. The result has survived controls for age, education, nationality, income, religious affiliation, region of residence and prior heterosexual marriage.
The Finnish register puts the adjusted female to different-sex ratio at 2.2, and adding premarital cohabitation and children to the model moves it only to 2.1.
The authors had expected those two factors to absorb a large share of the gap. They did not, and the paper says plainly that the mechanisms behind the female excess remain poorly understood.
| Metric | Value | Source |
| Divorce risk, female vs different-sex couples (Finland, adjusted for age, education, nationality) | 2.2x | Ponkilainen et al., JMF 2026 |
| Divorce risk, female vs male same-sex couples (Finland, same model) | 1.6x | Ponkilainen et al., 2026 |
| Female vs different-sex risk after adding cohabitation and children | 2.1x | Ponkilainen et al., 2026 |
| Five-year divorce risk, female same-sex vs opposite-sex (Norway, 1993 to 2010) | 2.04x | Wiik, Seierstad and Noack, JMF 2014 |
| Female share of same-sex divorces, England and Wales 2022 | 69.0% | ONS, Divorces in England and Wales 2022 |
| Female share of same-sex divorces, England and Wales 2021 | 67.2% | ONS, Divorces in England and Wales 2021 |
| Civil partnership dissolution rate, female vs male, 2023 | 11.2 vs 7.4 per 1,000 | ONS, 2023 |
| Dissolution over first five years of adoptive parenthood (U.S.) | 12.3% lesbian, 2.0% gay male, 8.3% heterosexual | Goldberg and Garcia, Journal of Family Psychology 2015 |
The Goldberg and Garcia row needs a caveat. It rests on 57 lesbian couples, 49 gay male couples and 84 heterosexual couples recruited through adoption agencies, so the 2.0% figure for gay men is one dissolution out of 49. Small U.S. studies of this kind get quoted as though they carried register-level authority, and this is the one most often used to claim a six-fold gap.
Norway is the one country where the gap has been tracked long enough to test whether it is closing. Over 26 years of data it has not closed nationally, although urban same-sex divorce risk has been falling while rural risk has risen (Zahl-Olsen and Thuen, Journal of Family History, 2023).
Anyone reading this because of their own marriage should hold the numbers loosely. A hazard ratio of 2.2 describes a population of several thousand Finnish couples over 17 years. It says nothing about which couples those were.

3. How Long Lesbian Marriages Last Before Divorce
Median duration figures look dramatic and are the easiest number on this page to misread. Same-sex marriage has only existed in England and Wales since March 2014, so no same-sex marriage there can yet have lasted 13 years, while the opposite-sex median of 12.7 years draws on marriages contracted in the 1990s and earlier.
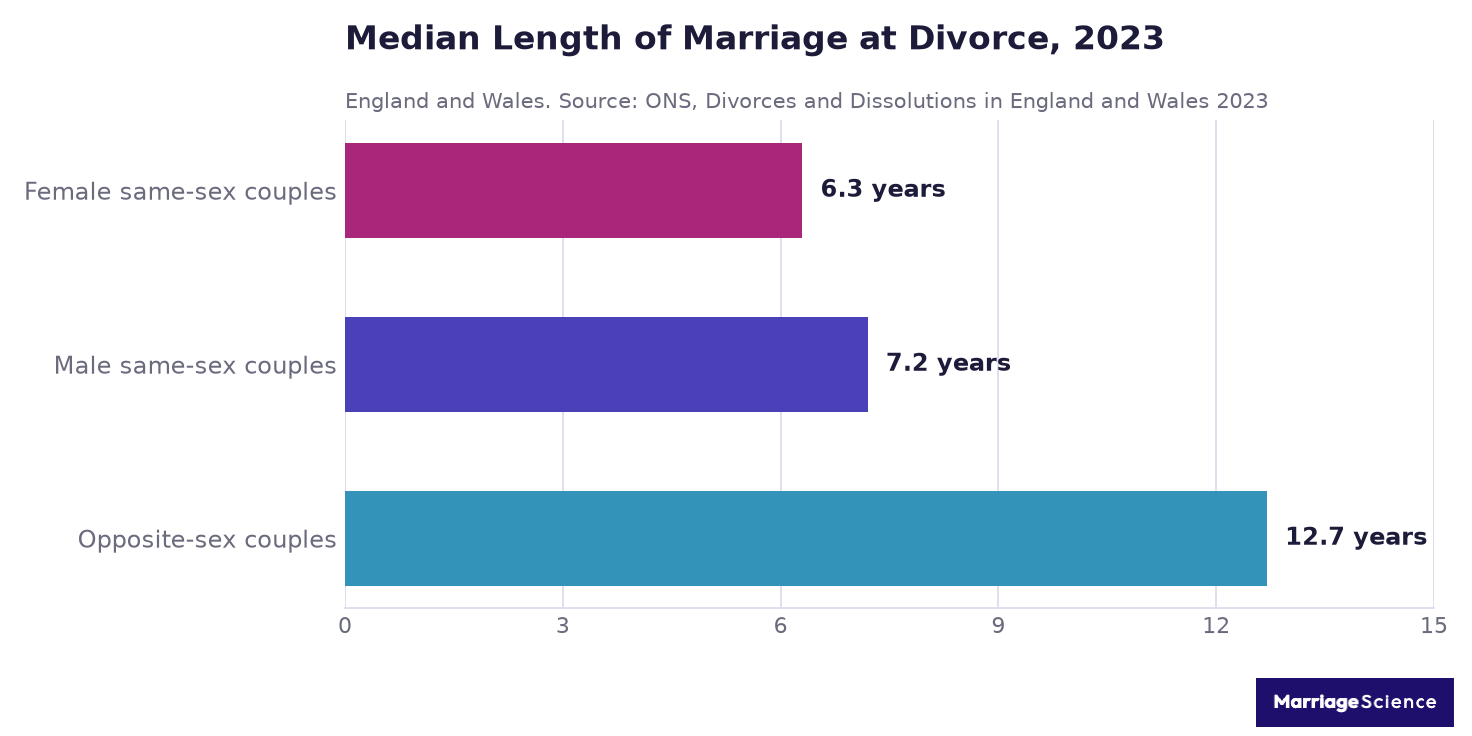
Within the same-sex population, where the legal clock started at the same moment for both groups, female couples still divorced 0.9 years earlier than male couples in 2023. That comparison is clean, and it points the same way as the Finnish and Dutch cohort data.
| Metric | Value | Source |
| Median duration of marriage at divorce, female same-sex (England and Wales, 2023) | 6.3 years | ONS, Divorces and Dissolutions 2023 |
| Median duration, male same-sex | 7.2 years | ONS, 2023 |
| Median duration, opposite-sex | 12.7 years | ONS, 2023 |
| Most common duration at divorce, female same-sex, 2023 | 4 years (172 divorces) | ONS, 2023 |
| Most common duration at divorce, male same-sex, 2023 | 6 years (89 divorces) | ONS, 2023 |
| Mean age at first marriage, women in same-sex couples (U.S., 2023) | 32 years, vs 29 for women in different-sex couples | NCFMR Family Profile FP-25-18, 2025 |
| Average spousal age gap, same-sex newlyweds (U.S.) | 6 years, vs 4 for different-sex newlyweds | NCFMR FP-25-18, 2025 |
Read the modal figures alongside the medians. The single most common outcome among female couples who divorced in 2023 was a marriage that had lasted four years, which fits a pattern the Finnish authors describe: same-sex unions that reach the register with little shared history behind them carry the highest risk (ONS, Divorces and Dissolutions in England and Wales: 2023).
4. What Predicts Divorce in Female Same-Sex Couples
Two Finnish papers published in 2025 and 2026 tested the mechanisms most often proposed in popular coverage. Between them they examined premarital cohabitation, children from earlier relationships, shared children, nationality intermarriage, religious affiliation, education and the income of each spouse.
Most of them registered some effect. None was large enough to matter much. Cohabitation length and children together account for roughly one fifth of the divorce gap between female same-sex and different-sex couples. Four fifths of it is still unaccounted for.
| Metric | Value | Source |
| Share of the female to different-sex gap explained by cohabitation and children | about 20% | Ponkilainen et al., JMF 2026 |
| Short premarital cohabitation as a divorce predictor | predicts divorce in same-sex couples, not in different-sex couples | Ponkilainen et al., 2026 |
| Premarital cohabitation of seven years or more | markedly lower divorce risk for female and male same-sex couples | Ponkilainen et al., 2026 |
| Children from a previous union, different-sex couples | 1.6x divorce risk | Ponkilainen et al., 2026 |
| Children from a previous union, female same-sex couples | 1.3x divorce risk | Ponkilainen et al., 2026 |
| Shared children | lower divorce risk in all groups, weakest effect in same-sex couples | Ponkilainen et al., 2026 |
| Nationality intermarriage | raises risk for male and opposite-sex couples, no effect for female couples | Einiö and Ponkilainen, Advances in Life Course Research 2025 |
| Higher income for the secondary earner | stabilises same-sex marriages only | Einiö and Ponkilainen, 2025 |
| Differing religious affiliation between spouses | raises divorce risk in same-sex couples, most strongly in male couples | Einiö and Ponkilainen, 2025 |
The income finding is the odd one. In different-sex marriages, a rise in the lower earner’s income does nothing for stability; in same-sex marriages it stabilises the union (Einiö and Ponkilainen, Advances in Life Course Research 64, 2025). The authors read that as evidence that couples without a default gendered division of labour respond differently to equal earning.
Cohabitation is the practical finding. Same-sex couples who lived together for seven years or more before marrying had markedly lower divorce risk, and the same protective effect did not appear among different-sex couples.
One reading is that different-sex couples have a well-worn script for how a relationship progresses, and same-sex couples in Finland, where registered partnership only arrived in 2002 and full marriage in 2017, have had to work it out case by case. That reading is the authors’ interpretation, and the register data cannot confirm it.
Norwegian data adds one finding that cuts against the usual intuition. Children lowered divorce risk for female couples but raised it for male couples, the reverse of what the Danish registers had shown a few years earlier (Wiik, Seierstad and Noack, 2014). Predictors that hold for one couple type keep failing to transfer to another, which is worth remembering before applying general advice about relationship warning signs to a specific marriage.
5. Who Files, and on What Grounds
England and Wales publish something almost no other jurisdiction does: whether a divorce application came from one spouse or both. Since the Divorce, Dissolution and Separation Act 2020 took effect in April 2022, couples have been able to apply jointly, and the take-up differs sharply by couple type.
Female couples filed alone in 60.9% of their 2022 divorces. Male couples filed alone in 46.8%. Male same-sex divorce was the only category where joint applications formed the majority.
| Metric | Value | Source |
| Same-sex divorces granted, England and Wales, 2023 | 1,891 (record high) | ONS, 2023 |
| Same-sex divorces, 2022 | 1,298 | ONS, 2022 |
| Same-sex divorces, 2015 (first year) | 22 | ONS, 2022 |
| Sole-applicant share, female same-sex divorces under the new law, 2022 | 60.9% | ONS, 2022 |
| Sole-applicant share, male same-sex divorces under the new law, 2022 | 46.8% | ONS, 2022 |
| Unreasonable behaviour cited, same-sex old-law final orders, 2023 | 62.0% | ONS, 2023 |
| Unreasonable behaviour, female same-sex applicants, 2023 | 59.7% | ONS, 2023 |
| Unreasonable behaviour, male same-sex applicants, 2023 | 64.4% | ONS, 2023 |
| Share of different-sex divorces initiated by the wife (U.S.) | 69% | Rosenfeld, American Sociological Association, 2015 |
The 69% initiation figure is the most heavily recycled statistic in popular writing about lesbian divorce, usually in the form of an argument that two women means twice the filing probability. Rosenfeld’s own data does not support that use of it. In the same survey, women and men ended non-marital relationships at statistically indistinguishable rates, which led him to locate the effect in the institution of heterosexual marriage rather than in women (American Sociological Association, 2015).
6. The Marriage Base: Who Is Actually Married
A divorce count only means something next to the number of marriages it is drawn from, and that number has been moving fast. Female couples were a minority of married same-sex households in the United States for most of the 2000s. They are now the majority.
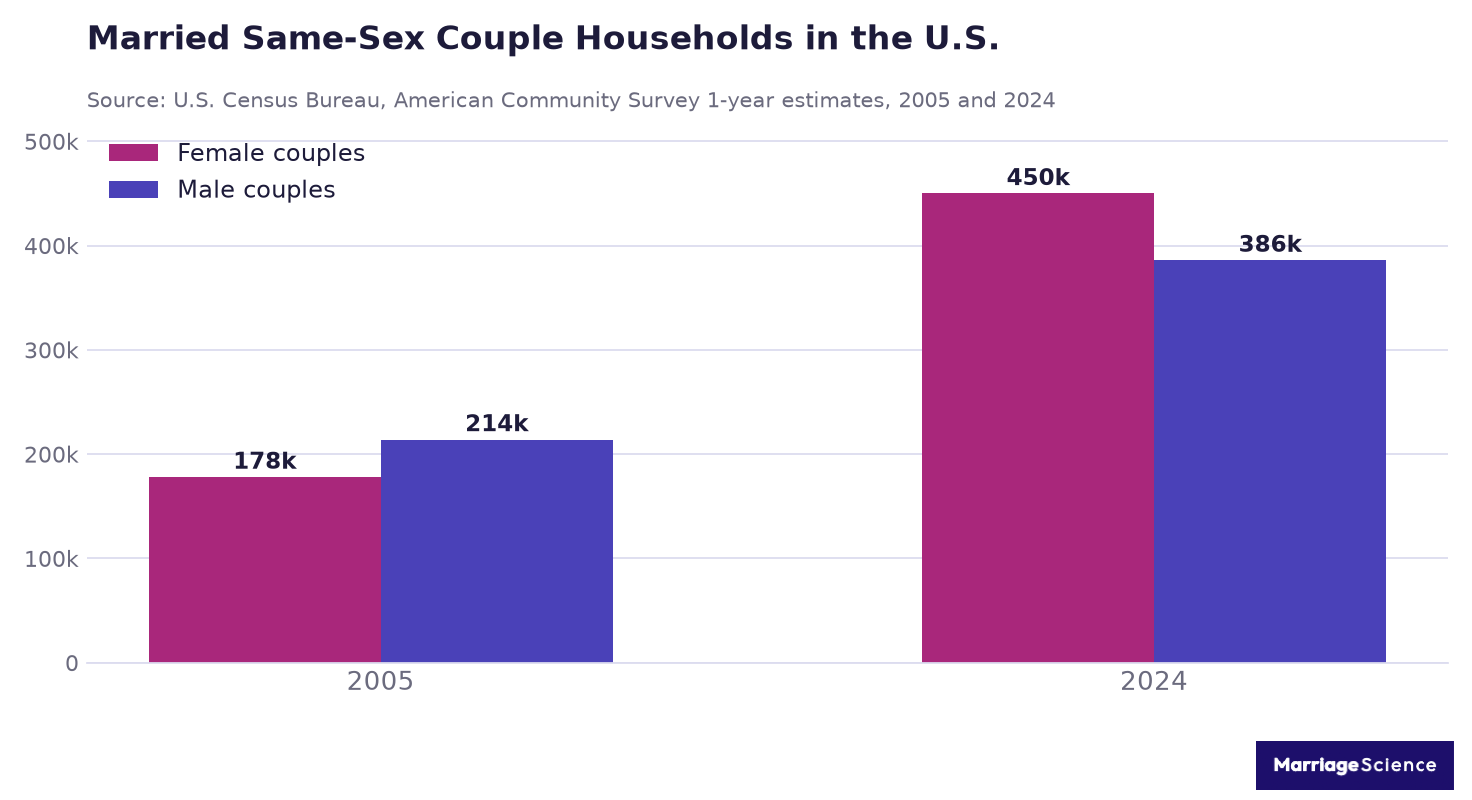
Married female same-sex households in the U.S. grew from about 178,000 in 2005 to about 450,000 in 2024, while male couples went from 214,000 to 386,000 (U.S. Census Bureau, American Community Survey 1-year estimates). A growing married population produces more divorces even when the divorce rate is flat, which is why the ONS record of 1,891 same-sex divorces in 2023 says less than the word “record” implies.
| Metric | Value | Source |
| Married same-sex couple households, U.S., 2024 | about 836,000 | U.S. Census Bureau, ACS 2024 |
| Married female same-sex households, 2024 | about 450,000 | U.S. Census Bureau, ACS 2024 |
| Married male same-sex households, 2024 | about 386,000 | U.S. Census Bureau, ACS 2024 |
| Same-sex couple households of all kinds, U.S., 2024 | 1.4 million (about 1.0% of households) | U.S. Census Bureau, ACS 2024 |
| Married same-sex couples, U.S., June 2025 | 823,000, up from 380,000 in June 2015 | Williams Institute, UCLA, 2025 |
| Married same-sex couples living in the Netherlands, start of 2026 | 25,000 (about 13,000 female, 12,000 male) | CBS Statistics Netherlands, 2026 |
| Same-sex marriages formed, England and Wales, 2022 | 7,800 (3.2% of all marriages), 62.8% female couples | ONS, Marriages in England and Wales 2022 |
| Female share of U.S. same-sex newlywed couples, 2023 | 53% | NCFMR Family Profile FP-25-18, 2025 |
The two U.S. totals above are not interchangeable. The Census household count and the Williams Institute estimate use separate bases and separate reference dates, and neither one counts divorces (U.S. Census Bureau, 2026). Our marriage statistics page covers the wider U.S. marriage trend these households sit inside.
7. What Happens After: Money, Housing, and Children
Divorce outcomes for women in female couples differ from outcomes for women divorcing men, and not always in the direction readers expect. Finnish record-linkage data covering divorces from 2002 to 2021 tracked both spouses’ housing for three years either side of the split.
Women divorcing women were less likely to lose homeownership than women divorcing men, largely because they were less likely to have owned the marital home in the first place. No group in the study had recovered its pre-divorce housing position three years on.
| Metric | Value | Source |
| Homeownership loss after divorce | higher for women divorcing men than for women divorcing women | Einiö and Ponkilainen, Genus 2025 |
| Housing recovery within three years of divorce | incomplete in every group studied | Einiö and Ponkilainen, Genus 2025 |
| Median household income, married female same-sex households, 2024 | $108,500 | U.S. Census Bureau, ACS 2024 |
| Median household income, married male same-sex households, 2024 | $140,500 | U.S. Census Bureau, ACS 2024 |
| Married female same-sex couples with children in the household, 2023 | 25% | NCFMR Family Profile FP-25-07, 2025 |
| Married male same-sex couples with children in the household, 2023 | 9% | NCFMR FP-25-07, 2025 |
| Children under 18 raised by married same-sex couples, U.S. | about 300,000 | Williams Institute, UCLA, 2025 |
| Average age of same-sex married householders, 2024 | 49.0 years | U.S. Census Bureau, ACS 2024 |
The $32,000 income gap between married female and male same-sex households is the clearest financial marker in the U.S. data, and it compounds at divorce: two lower incomes have to cover two households instead of one. Couples who want that arithmetic settled in advance can read our prenuptial agreement guide, which covers how state law treats property acquired during the marriage.
Children matter here in a way the headline rates hide. A quarter of married female same-sex couples were raising a child in 2023, against 9% of married male couples, so the custody and support consequences of divorce fall disproportionately on female couples before divorce rates are compared at all (NCFMR, Same-sex Married and Cohabiting Couples Raising Children, 2023).
Summary: Lesbian Divorce Rates by the Numbers
| Metric | Value | Source |
| Divorced within 10 years, female same-sex unions (Finland) | 41% | Ponkilainen et al., JMF 2026 |
| Divorced within 10 years, male same-sex unions (Finland) | 27% | Ponkilainen et al., 2026 |
| Divorced within 10 years, different-sex unions (Finland) | 22% | Ponkilainen et al., 2026 |
| Adjusted divorce risk, female vs different-sex couples (Finland) | 2.2x | Ponkilainen et al., 2026 |
| Adjusted divorce risk, female vs male same-sex couples (Finland) | 1.6x | Ponkilainen et al., 2026 |
| Five-year divorce risk, female same-sex vs opposite-sex (Norway) | 2.04x | Wiik et al., JMF 2014 |
| Cumulative divorce at 15 years, female same-sex marriages (Sweden) | about 40% | Kolk and Andersson, Demography 2020 |
| 2015 cohort divorced by 2025, female couples (Netherlands) | 24% | CBS, 2026 |
| 2015 cohort divorced by 2025, male and different-sex couples (Netherlands) | 13% | CBS, 2026 |
| Same-sex divorces, England and Wales, 2023 | 1,891 | ONS, 2023 |
| Female share of same-sex divorces, England and Wales, 2022 | 69.0% | ONS, 2022 |
| Median marriage duration at divorce, female same-sex (England and Wales) | 6.3 years | ONS, 2023 |
| Median marriage duration at divorce, male same-sex | 7.2 years | ONS, 2023 |
| Civil partnership dissolution rate, female vs male, 2023 | 11.2 vs 7.4 per 1,000 | ONS, 2023 |
| Sole-applicant share, female same-sex divorces, 2022 | 60.9% | ONS, 2022 |
| Gap explained by cohabitation and children | about 20% | Ponkilainen et al., 2026 |
| Married female same-sex households, U.S., 2024 | about 450,000 | U.S. Census Bureau, ACS 2024 |
| Married male same-sex households, U.S., 2024 | about 386,000 | U.S. Census Bureau, ACS 2024 |
| Median household income, married female same-sex households, 2024 | $108,500 | U.S. Census Bureau, ACS 2024 |
| Married same-sex couples, U.S., June 2025 | 823,000 | Williams Institute, 2025 |
Methodology and Sources
Every figure on this page traces to a national statistical agency or a peer-reviewed study built on population register data. We excluded law-firm marketing roundups, dating-coach blogs and aggregator “statistics” pages, several of which circulate a widely quoted claim that lesbian couples divorce at three times the rate of gay men. No register study we found supports a multiple that large.
- Office for National Statistics, Divorces and Dissolutions in England and Wales: 2023 and the 2021 and 2022 editions.
- Office for National Statistics, Marriages in England and Wales: 2021 and 2022.
- M. Ponkilainen, E. Einiö, M. Kühn and M. Myrskylä, Same-Sex and Different-Sex Couples’ Divorce Risks: The Role of Cohabitation and Childbearing, Journal of Marriage and Family, 2026.
- E. Einiö and M. Ponkilainen, Divorce in Same-Sex and Opposite-Sex Couples: The Roles of Intermarriage, Religious Affiliation, and Income, Advances in Life Course Research 64, 2025.
- E. Einiö and M. Ponkilainen, Gendered Housing Consequences of Divorce, Genus, December 2025.
- M. Kolk and G. Andersson, Two Decades of Same-Sex Marriage in Sweden, Demography 57(1), 2020.
- K. Aarskaug Wiik, A. Seierstad and T. Noack, Divorce in Norwegian Same-Sex Marriages and Registered Partnerships, Journal of Marriage and Family, 2014.
- R. Zahl-Olsen and F. Thuen, Same-sex Marriage Over 26 Years, Journal of Family History, 2023.
- CBS Statistics Netherlands, 25 Years Since First Same-Sex Marriages in the Netherlands, March 2026.
- U.S. Census Bureau, More Female Than Male Same-Sex Couple Households in the United States in 2024, American Community Survey 1-year estimates, April 2026.
- Williams Institute, UCLA School of Law, same-sex marriage data, ten years after Obergefell, June 2025.
- National Center for Family and Marriage Research, Bowling Green State University, Family Profiles FP-25-18 and FP-25-07, 2025.
- A. Goldberg and R. Garcia, Predictors of Relationship Dissolution in Lesbian, Gay, and Heterosexual Adoptive Parents, Journal of Family Psychology, 2015.
- M. Rosenfeld, Who Wants the Breakup? Gender and Breakup in Heterosexual Couples, presented to the American Sociological Association, 2015.
What these figures do not measure: divorce rates for bisexual women married to men, dissolution of cohabiting female couples who never married, and separations that never reach a court. No U.S. federal statistical product currently reports divorce by the sex composition of the couple, so anyone quoting an American “lesbian divorce rate” is either extrapolating from European registers or using a small survey.
Releases we expect to change these numbers: the ONS bulletin for 2024 divorces, the next CBS cohort update, and ACS 1-year estimates for 2025. We update this page annually. More of our research sits on our Marriage Science statistics hub.



