


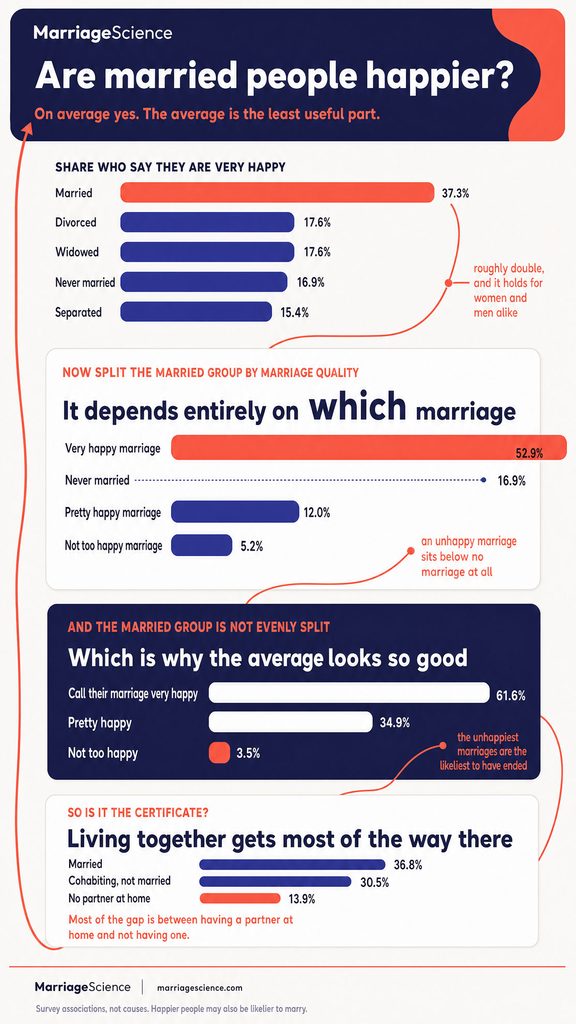
Yes, on average, married adults are more likely to say they are very happy. In our analysis of the General Social Survey, which has asked Americans “Taken all together, how would you say things are these days, would you say that you are very happy, pretty happy, or not too happy?” since 1972, 37.3% of married adults called themselves very happy in 2010 to 2024, against 16.9% of adults who never married.
Those 2010 to 2024 figures are age-standardized, meaning every group is weighted to the same age mix. The gap holds for women, at 38.1% against 18.2%, and for men, at 36.2% against 15.4%.
The average hides the main finding. Married people who called their marriage “not too happy” were the least happy group of all, with 5.2% saying they were very happy, below single people.
We also revisit a claim that went viral in 2019, that single women without children are the happiest group. It came from a misread survey label, and the author admitted the error.
This page covers happiness by marital status and sex, 50 years of trend, whether money explains the gap, the 2019 claim, and what studies that follow people through marriage show.
Does Marriage Make You Happier? Key Data Points
Unless another source is named, every figure below is our analysis of the General Social Survey for 2010 to 2024, age-standardized so that older and younger groups compare fairly. The question asks whether people are very happy, pretty happy or not too happy.
- 37.3% of married adults say they are very happy, against 16.9% of adults who never married.
- 9.8% of married adults say they are not too happy, against 26.5% of the never married.
- Divorced and widowed adults are both at 17.6% very happy. Separated adults are lowest at 15.4%.
- Married women 38.1%, never-married women 18.2%. Married men 36.2%, never-married men 15.4%.
- Never-married women aged 25 to 64 without children: 17.7% very happy, against 39.2% of married women without children.
- People who call their marriage very happy: 52.9% very happy with life. Those who call it not too happy: 5.2%.
- The gap holds in every income band, from 33.1% vs 15.6% in the lowest third to 39.4% vs 18.1% in the top third.
- Cohabiting couples come close to married ones, 30.5% against 36.8%, while unmarried people without a partner are at 13.9%.
- The 2019 claim that single, childless women are the happiest group rested on a misread survey label, which its author admitted (Vox, 2019).
- Spouses who are also best friends show about twice the well-being benefit of marriage (Grover and Helliwell, Journal of Happiness Studies).
Happiness by Marital Status
Our analysis uses the General Social Survey (GSS), which has asked Americans “Taken all together, how would you say things are these days, would you say that you are very happy, pretty happy, or not too happy?” since 1972.
For 2010 to 2024, the marital status figures below are age-standardized. That means each group is weighted to the same age mix, so the comparison is less affected by the fact that widowed, divorced, never married, separated and married adults have different age profiles.
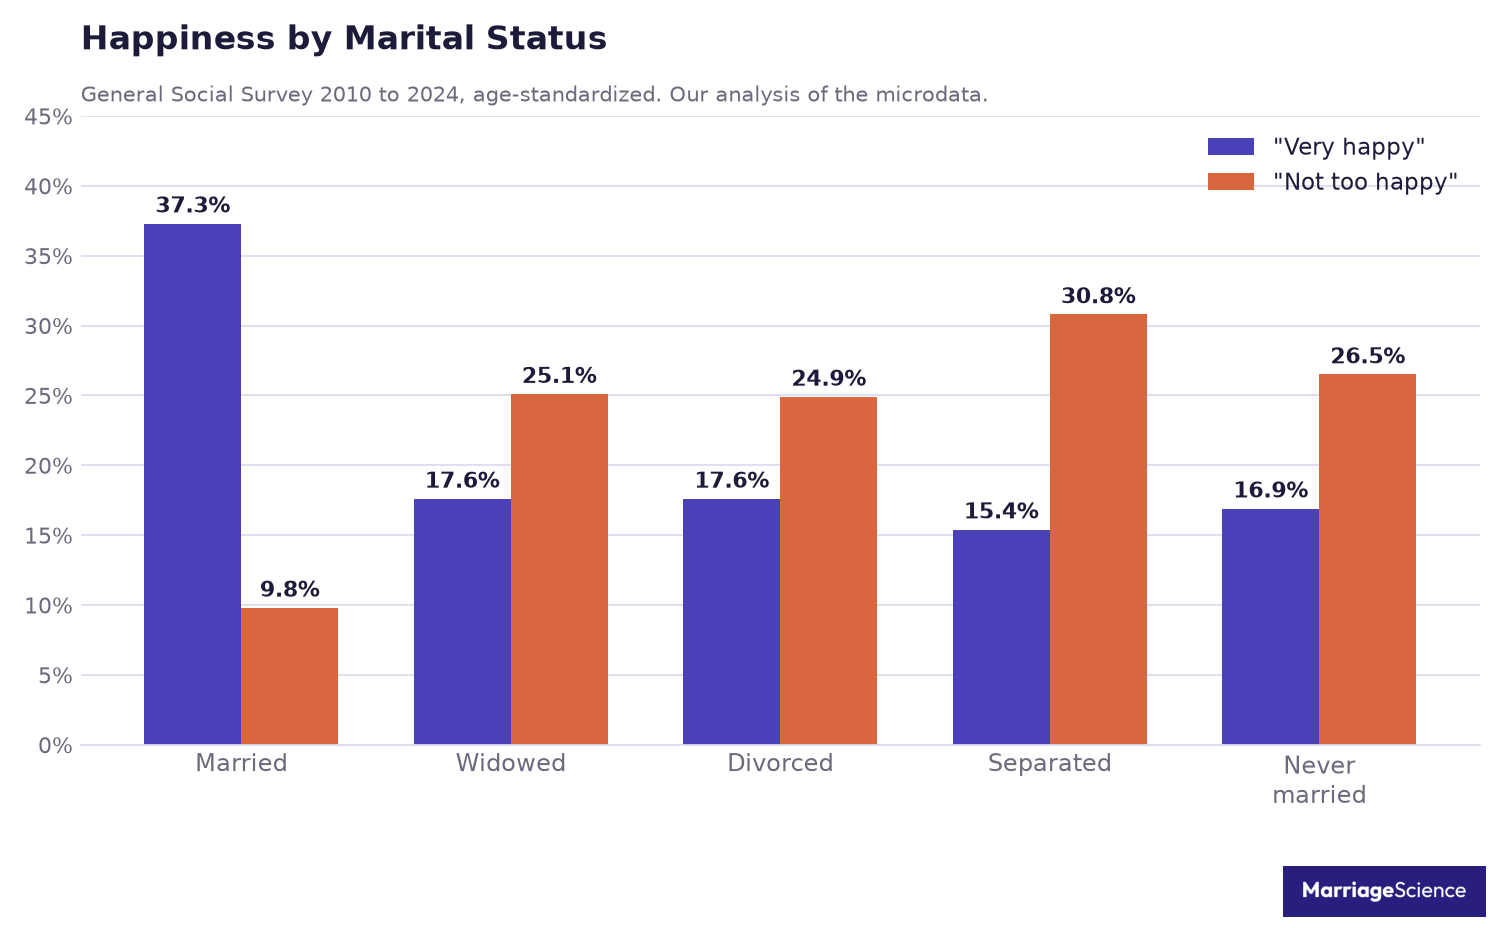
Married adults have the highest very happy share, at 37.3%, and the lowest not too happy share, at 9.8%. Never married adults are at 16.9% very happy and 26.5% not too happy.
Divorced adults are at 17.6% very happy and 24.9% not too happy, while widowed adults are also at 17.6% very happy and 25.1% not too happy.
The widest gap is between married adults and the unmarried categories. The married are about twice as likely to say very happy and about a third as likely to say not too happy.
That is a large gap, but it is still an average from one survey question. It does not show that marriage itself creates it.
| Marital Status | Very Happy | Not Too Happy |
| Married | 37.3% | 9.8% |
| Widowed | 17.6% | 25.1% |
| Divorced | 17.6% | 24.9% |
| Separated | 15.4% | 30.8% |
| Never Married | 16.9% | 26.5% |
The unmarried groups sit close together on the very happy measure. Widowed and divorced adults have the same very happy share, while never married adults are close behind.
Separated adults have the lowest very happy share, at 15.4%, and the highest not too happy share, at 30.8%.
Across all adults in the same data, before adjustment for marital status and age mix, 27.1% say they are very happy and 17.3% say they are not too happy. The sample includes 21,854 adults.
These figures are best read as a status comparison. They describe how adults in different marital categories answer the same GSS question across 2010 to 2024.
They do not say why people answered that way, and they do not turn a group average into advice for any one person.
How often marriages end, and who ends them, is covered in our divorce statistics.
Are Married Women Happier Than Single Women
In the GSS 2010 to 2024 age-standardized results, married women have the highest very happy share among women. Married women are at 38.1%, compared with 18.2% for never married women, 18.9% for divorced women, and 16.7% for widowed women.
The relevant comparison is married women versus never married women. Divorced and widowed women are separate groups in the table, since their life histories and current status differ from the never married group.
Keeping those groups separate helps avoid turning all unmarried respondents into a single category.
The direct married to never-married gap for women is 19.9 points. For men, married respondents are at 36.2% and never married respondents are at 15.4%, a gap of 20.8 points.
That puts the marriage gap at about the same size for women and men.
| Status | Women | Men |
| Married | 38.1% | 36.2% |
| Never married | 18.2% | 15.4% |
| Divorced | 18.9% | 15.5% |
| Widowed | 16.7% | 26.4% |
The gap between women and men inside marriage is smaller than the gap by marital status. Married women report slightly more happiness than married men, 38.1% compared with 36.2%.
This cuts against the popular idea that marriage benefits men and not women.
The widowed figures move in the other direction. Widowed men are at 26.4%, while widowed women are at 16.7%.
That is the clearest place in this table where men report more happiness than women.
These averages do not describe any individual life. Never married women and men include respondents who say they are very happy, and married women and men include respondents who do not.
The section’s answer is limited to very happy shares from the GSS 2010 to 2024: married women are higher than never married women, and the marriage gap is about the same size for women and men.
The Claim That Single Women Without Children Are Happiest
A widely repeated version of this debate began in May 2019, when behavioral scientist Paul Dolan was promoting his book Happy Ever After at the Hay Festival. He said, “Married people are happier than other population subgroups, but only when their spouse is in the room when they’re asked how happy they are.”
He also said unmarried women without children were the healthiest and happiest group.
The claim rested on the American Time Use Survey, a phone survey. Its category “spouse absent” means a spouse who does not live in the household.
Dolan had read it as a spouse who had stepped out of the room, and economist Gray Kimbrough of American University spotted the error.
Dolan later told Vox: “We did indeed misinterpret the variable.” He said the Guardian had amended its article and the book would be changed.
He also kept his broader view that marriage is better for men than for women.
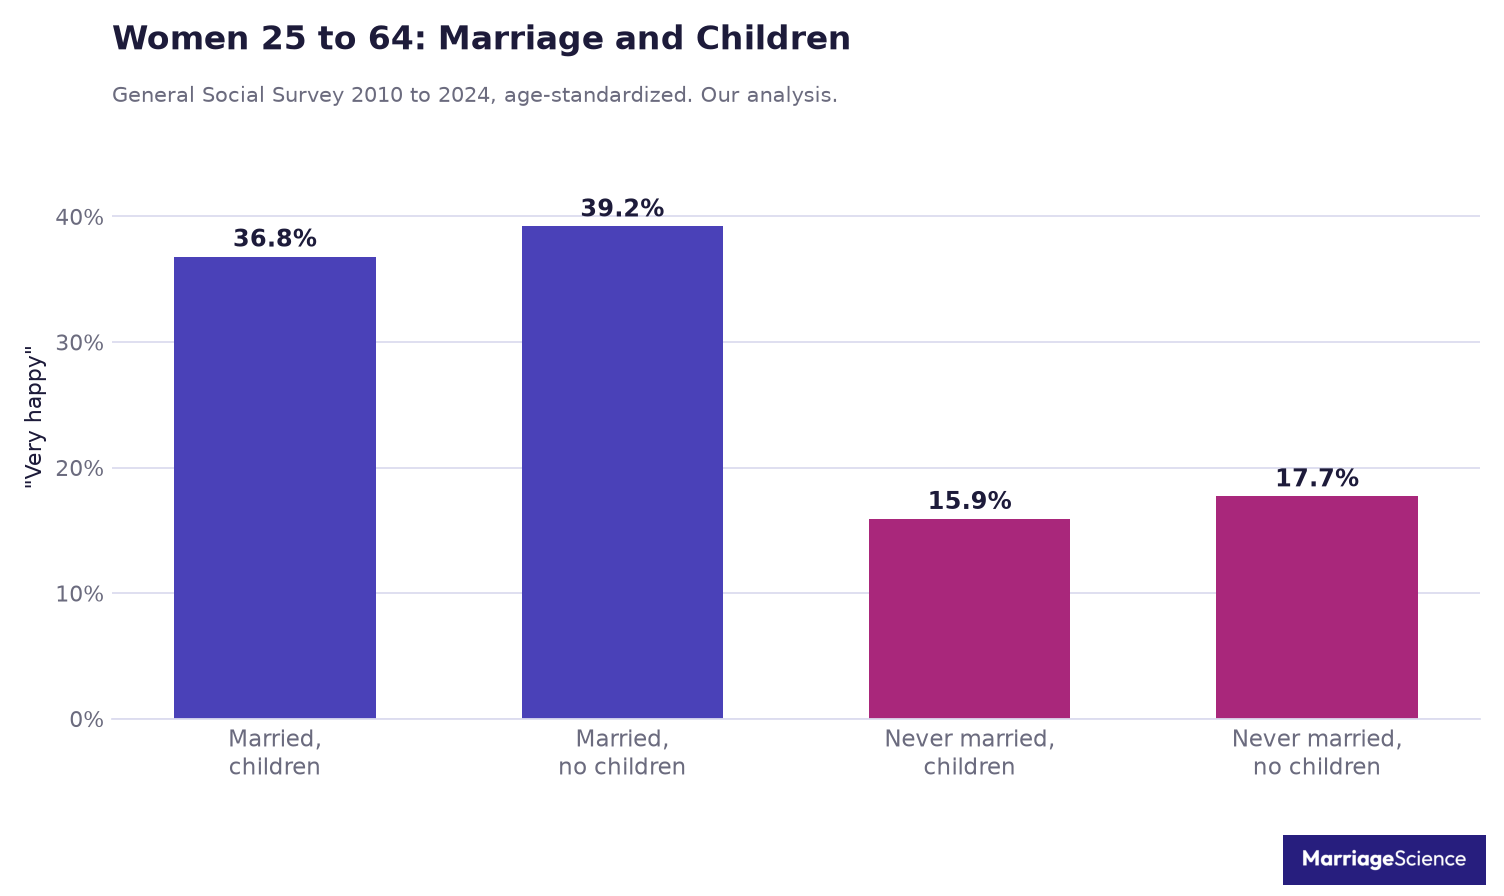
Our GSS test points in a different direction from the corrected viral claim. Among women aged 25 to 64 in 2010 to 2024, never married women without children do not come out as the most likely to say they are very happy.
Married women without children are the highest group in the table, and married women with children are close behind.
| Women 25 to 64 | Very happy | Not too happy |
| Married with children | 36.8% | 9.1% |
| Married without children | 39.2% | 9.9% |
| Never married with children | 15.9% | 28.7% |
| Never married without children | 17.7% | 24.0% |
In this GSS cut, never married childless women are less than half as likely as married women to say they are very happy. The “not too happy” share is 24.0% for never married women without children, compared with 9.9% for married women without children and 9.1% for married women with children.
The same age cut for men does not support the simple idea that single, childless adulthood is the happiest category. Married men with children are at 37.0% very happy, married men without children are at 28.4%, never married men with children are at 16.6%, and never married men without children are at 13.9%.
The cleanest reading is modest. The mistaken American Time Use Survey interpretation should not be used as proof that unmarried women without children are the happiest group.
In our GSS analysis, married women without children are the happiest group of women shown here, but only by a few points over married women with children.
Is It Just Money
Money is one obvious alternative explanation for the very happy gap between married and never married respondents. Married households have more income on average, so a simple married versus never married comparison can blend relationship status with economic position.
If income explained the pattern by itself, the gap would fade once people were compared inside the same part of the income distribution.
To check that possibility, our analysis used GSS 2010 to 2024 and split respondents into thirds of real family income. The results are age-standardized.
The table keeps the measure consistent with the rest of this article: the share saying they are very happy.
| Income third | Married | Never married |
| Lowest third | 33.1% | 15.6% |
| Middle third | 35.4% | 18.4% |
| Top third | 39.4% | 18.1% |
The married share rises from 33.1% in the lowest third to 35.4% in the middle third and 39.4% in the top third. Those values leave room for money to matter, but they do not erase the status gap.
For never married respondents, the shares are 15.6% in the lowest third, 18.4% in the middle third, and 18.1% in the top third. The married share in the lowest third is still higher than the never married share in the top third.
This is the key point for the money explanation. Married households have more income on average, and that matters for how the headline comparison should be read.
Inside every income third, married respondents remain more likely than never married respondents to say they are very happy.
Still, this is a comparison of different people. It cannot prove marriage itself is the reason for the gap.
People arrive at marital status with different histories, resources, health, family ties, and expectations. Income bands reduce one source of confusion, but they do not remove every source of selection.
The safest reading is narrow. In this GSS cut, money alone does not explain why married respondents report higher very happy shares than never married respondents.
An Unhappy Marriage Is Worse Than None
The headline gap between married and never married adults hides a sharper pattern: marriage quality carries much of the association. In the GSS 2010 to 2024 data, married respondents were asked how happy their marriage is, and their answers line up closely with their answers about life as a whole.
Among married adults who call their marriage very happy, 52.9% are very happy with life and 5.5% are not too happy. This is the group that does most of the work behind the marriage advantage in the overall averages.
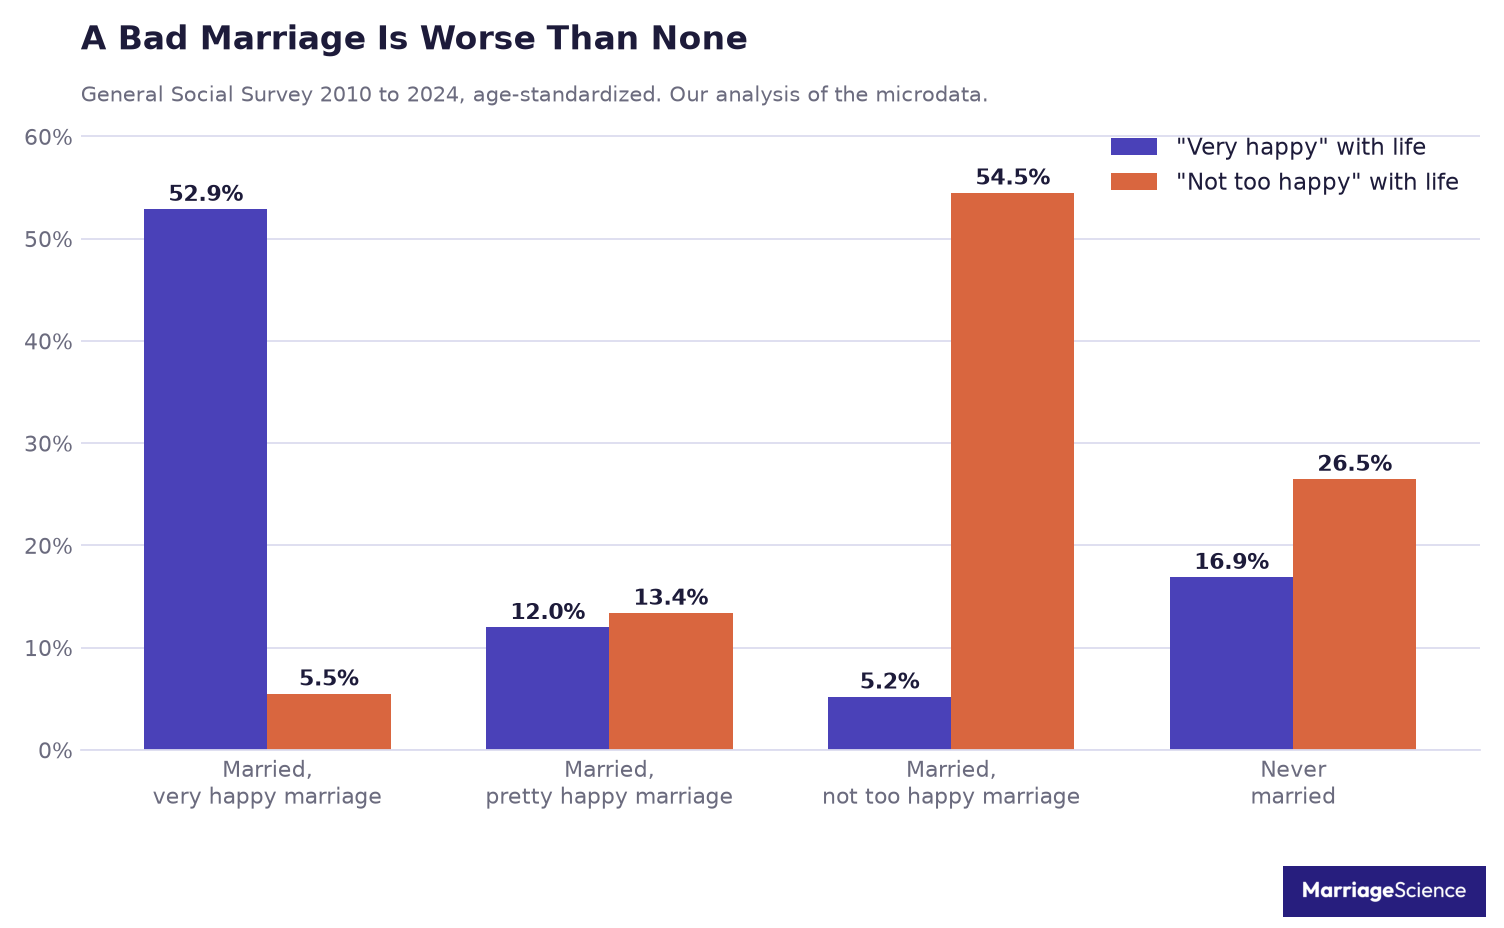
The middle group looks different. Among those who say their marriage is pretty happy, 12.0% are very happy with life and 13.4% are not too happy.
That life satisfaction profile is far closer to the single comparison group than to people in very happy marriages.
The unhappy group reverses the story. Among married adults who say their marriage is not too happy, 5.2% are very happy with life and 54.5% are not too happy.
For never married adults, 16.9% are very happy and 26.5% are not too happy.
On these averages, an unhappy marriage goes with less well-being than staying unmarried. The comparison is about the quality of the marriage.
Single adults belong in the comparison on equal terms.
This matters because the married category is selective. Only 3.5% of married respondents describe their marriage as not too happy, while 61.6% call it very happy and 34.9% call it pretty happy.
A likely reason is that the unhappiest marriages are more likely to end, which leaves the married group looking happier than marriage itself.
Marriage quality changes the reading of the marriage question. The married average describes a mix of marriages with very different reported quality, so it should not be read as a promise attached to the status itself.
The same legal status can contain very different daily realities.
That is why the marriage advantage is best read with a quality filter. The evidence here says the advantage is almost entirely in very happy marriages.
When the marriage itself is rated not too happy, the average turns sharply negative.
Couples looking for help can see what the evidence says about marriage counseling success rates. This section’s point is narrower: the happiness gap is concentrated in very happy marriages, while an unhappy marriage is linked to worse outcomes than being never married in the same survey series.
Married vs Living Together
Marriage is not the only partnered living arrangement in the GSS data. For the years when the survey asked about cohabiting partners, GSS 2012 to 2024, our age-standardized comparison separates married adults, cohabiting adults who are not married, and adults who are not married and have no partner at home.
The pattern is clear but more specific than a simple married versus unmarried split. Married adults have the highest very happy share, at 36.8%.
Cohabiting adults who are not married are close behind at 30.5%. Adults who are not married and have no partner at home are much lower, at 13.9%.
| Living arrangement | Very happy |
| Married | 36.8% |
| Cohabiting and not married | 30.5% |
| Not married and no partner | 13.9% |
This means most of the observed happiness gap in this cut is between having a partner at home and not having one. The married group still reports more very happy responses than cohabiting couples, but the distance between those partnered groups is much smaller than the distance between either partnered group and adults living without a partner.
The cohabiting group looks much closer to married adults than to adults without a partner at home.
That distinction matters for how the headline should be read. The survey question captures a self-rating at one point in time, and the table groups people by current living arrangement.
It does not say that a legal status alone produces the gap. It also does not tell us whether a cohabiting couple plans to marry, wants to marry, or prefers to stay unmarried.
Our separate analysis covers living together before marriage. Here, the narrower point is that partnership at home accounts for much of the divide, while marriage is still linked to the highest very happy share within the partnered groups.
The Gap Over 50 Years
This long view uses the General Social Survey very happy question, with shares standardized to the full 1972 to 2024 age mix. That adjustment keeps age composition from doing the work, so the table should be read as a trend line across periods.
It should not be lined up against the recent tables above, which use a different base.
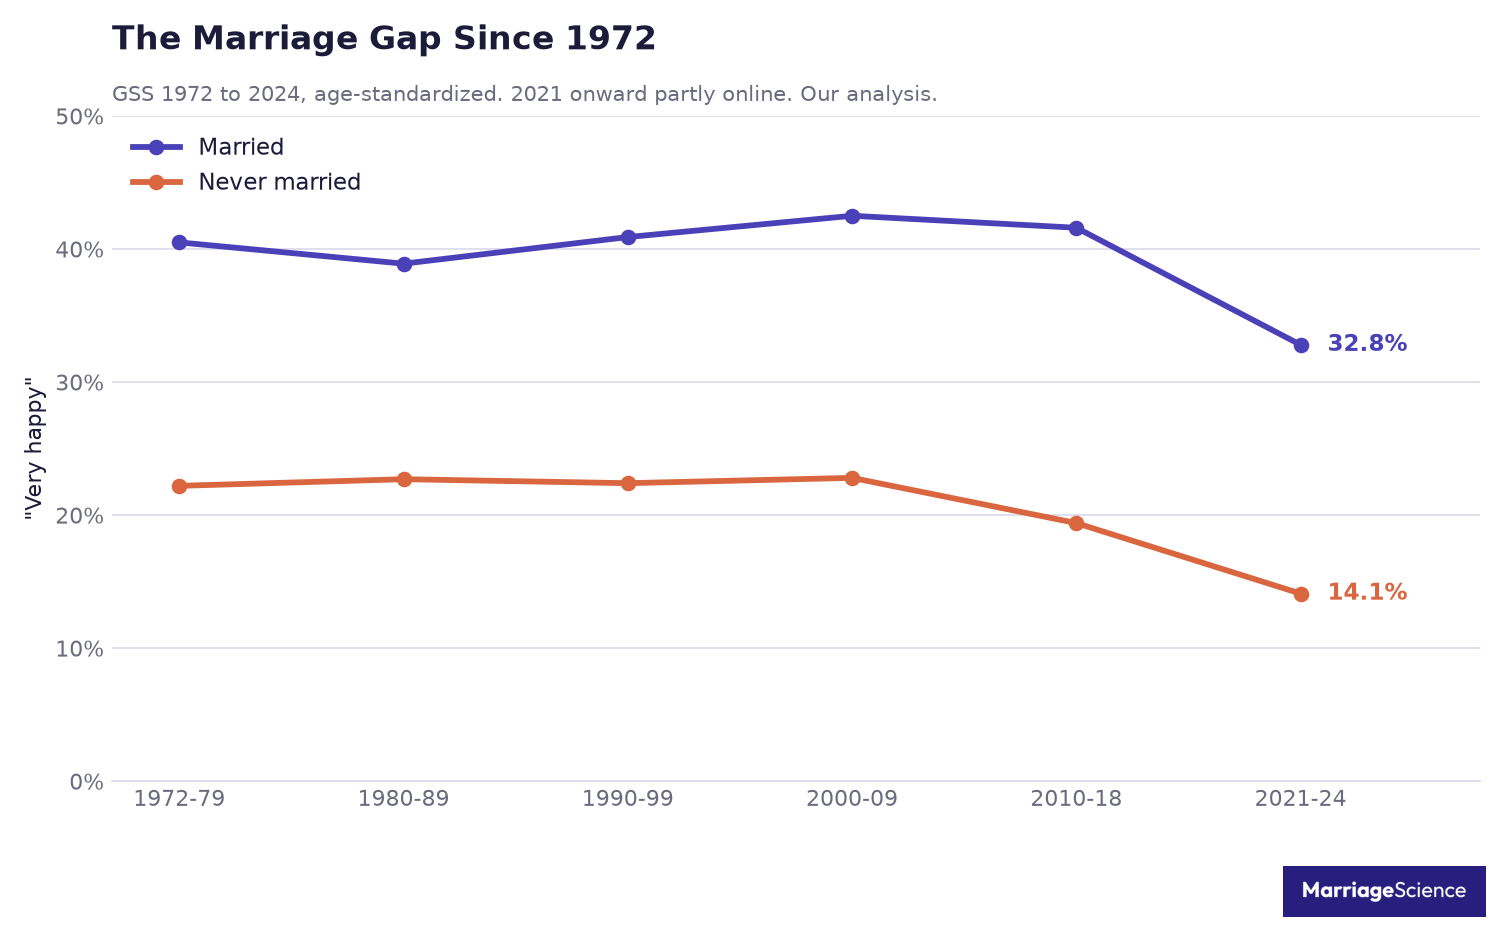
The pattern is steady in one respect. Married adults have a higher very happy share than never married adults in each period shown.
That does not mean marriage caused the gap for any individual. It means the marital status groups have answered this survey question differently across a long run of GSS data.
The older rows are striking because the never married line barely moves for several periods. It sits at 22.2%, 22.7%, 22.4%, and 22.8% from 1972 to 79 through 2000 to 09.
The married line is also fairly stable across those same rows.
| Period | Married | Never married |
| 1972 to 79 | 40.5% | 22.2% |
| 1980 to 89 | 38.9% | 22.7% |
| 1990 to 99 | 40.9% | 22.4% |
| 2000 to 09 | 42.5% | 22.8% |
| 2010 to 18 | 41.6% | 19.4% |
| 2021 to 24 | 32.8% | 14.1% |
The break becomes clearer after the 2000s. The never married share saying very happy falls to 19.4% in 2010 to 18 and then to 14.1% in 2021 to 24.
Married adults also show a sharp drop in the latest period, from 41.6% in 2010 to 18 to 32.8% in 2021 to 24.
That last row needs context. In our run, 31.0% of all adults were very happy in 2018 and 19.4% in 2021, matching the 31% and 19% NORC reported.
The same check found “not too happy” rising from 12.9% to 23.8%, close to 13% to 24% in that report.
The 2021 survey ran mostly online during the pandemic, a change of method as well as of mood. For that reason, the 2021 to 24 row should be read carefully.
It still belongs in the series, but it carries a clear warning label.
The main point is simple: the gap has been there for 50 years, while the levels inside each group have changed. For a related view of social connection, see our loneliness statistics.
Does Marriage Make People Happier
The honest answer is that marriage and happiness move together, but the reason for the link is hard to isolate. Happier people may be more likely to marry in the first place.
Surveys like the GSS can describe the gap, but they cannot separate that selection from an effect of marriage itself.
That limit matters for this article because our main figures come from a single “very happy” survey answer. The gap between married and single adults is real in the survey data, but the survey alone cannot prove that getting married made the married group more likely to call themselves very happy.
Longer panel research gives a more careful view. Lucas, Clark, Georgellis and Diener, writing in the Journal of Personality and Social Psychology in 2003, followed more than 24,000 Germans for 15 years.
On average, life satisfaction rose around the wedding and then drifted back toward each person’s earlier level.
That average hides wide variation between people. Some stayed well above their old level for years, while others stayed well below it.
The same marriage event did not have the same emotional path for everyone.
Grover and Helliwell, writing in the Journal of Happiness Studies, used British panel data and controlled for how satisfied people were before they married. The married were still more satisfied at every stage of marriage.
The benefit was about twice as large for people whose spouse was also their best friend.
Taken together, the research points to a mixed answer. Some of the happiness gap is likely about who marries, since people who are already more satisfied may be more likely to enter marriage.
Some of the gap also appears to come from being married, especially when the partnership is close, supportive and friendship-based.
The quality of the relationship matters more than the certificate. A strong marriage can go with higher life satisfaction, but a legal status by itself is a thin measure of daily life.
For the wider context on who marries and how marriage patterns have changed, see our marriage statistics.
Methodology and Sources
Our analysis uses the GSS cumulative file from 1972 to 2024, maintained by NORC at the University of Chicago. The article reports the share of adults who answered very happy to the survey’s happiness question, grouped by marital status and other characteristics.
For pooled estimates, we applied the survey weights listed for the file: WTSSALL through 2018 and WTSSPS from 2021. We kept the wording tied to the survey response, so the charts and text describe very happy shares instead of broader claims about being happy.
We age-standardized marital status comparisons in six bands, from 18 to 29 to 70 and older. This matters because the widowed are older on average and the never married are younger on average, so raw comparisons mix marital status with age.
Age standardization adjusts the age mix used in the comparison. It does not remove every other source of contrast between groups.
Other contrasts can remain in a cross-sectional survey, so the article treats marital status as linked to very happy responses.
For the children comparison, we restricted the sample to ages 25 to 64. Childless means no children ever born, matching the way the GSS records children.
Income thirds use the GSS measure of real family income, so they describe family income.
Marital status is measured at the time of the interview. The data do not follow the same person through changes in marital status.
That is why the wording says goes with or is linked to, unless a cited source uses its own causal language.
These estimates have clear limits. Happiness is self-reported, it comes from one question, and the data are cross-sectional.
The 2021 change to mostly online interviews shifts levels, so changes around that point should be read with care.
Sources:
- General Social Survey 1972 to 2024
- Piper, Vox, 2019
- Lucas, Clark, Georgellis and Diener, Journal of Personality and Social Psychology, 2003
- Grover and Helliwell, Journal of Happiness Studies, 2019
- NORC, GSS happiness trends



