


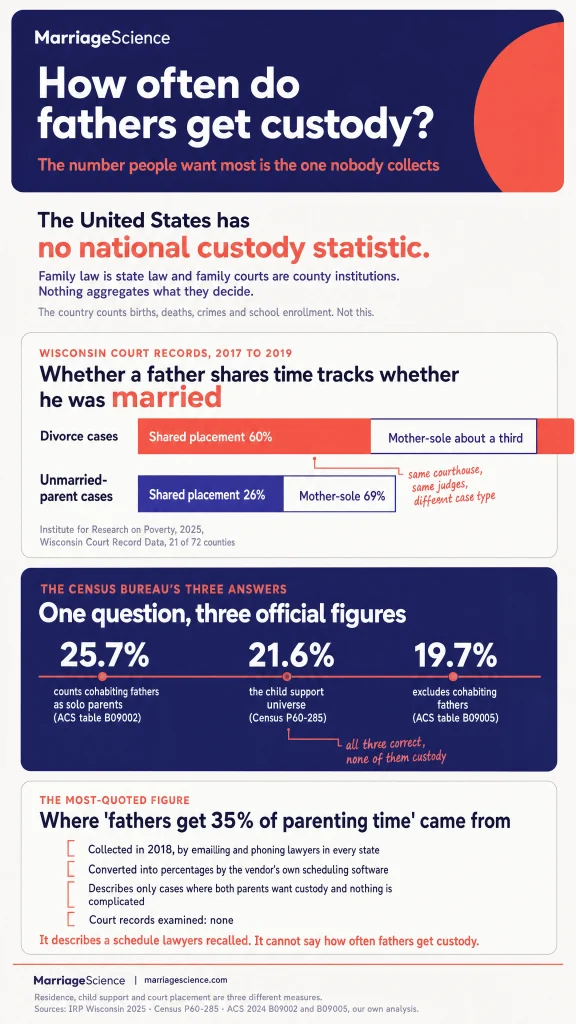
There is no national father custody statistic in the United States. No federal agency records what family courts decide, so the number people want most is the one the country does not collect.
The most-cited state-by-state figure says a father receives about 35% of parenting time. That figure comes from Custody X Change, a company that sells parenting-plan software. By its own account, the research was done in 2018 by emailing and phoning lawyers in each state to ask what schedule they most commonly see, then running those schedules through the company’s own software.
Where court records are actually counted, the answer changes. In Wisconsin, the one state with a long court-record series, 60% of divorce cases entering court between 2017 and 2019 ended in shared placement and about a third in mother-sole placement.
The Census Bureau adds another source of confusion. It publishes three different figures for the share of single parents who are fathers: 25.7%, 21.6% and 19.7%. All three are correct. None of them measures custody.
The public search results do not make these limits clear. Of the 37 top-ranking pages we downloaded and tested, none carries a court-record custody outcome, none notes that the Census tables disagree, and none questions the widely repeated fatherless homes figures.
This page separates what is counted from what is estimated. It reports our own Census analysis for the parts that can be measured, and it keeps the custody question separate from household status, child support, visitation, and claims that rest on uncited repetition.
Custody is one part of what happens after a separation. Our roundup of divorce statistics covers how many marriages end and when.
How Often Do Fathers Win Child Custody?
Father custody data is thinner than the public debate often suggests. The strongest numbers come from state court files, Census household data, and child support reports, each measuring a different part of family life after separation.
- No federal agency collects the custody outcomes of family court cases, so there is no national custody statistic of any kind.
- In Wisconsin divorce cases entering court between 2017 and 2019, 60% ended in shared placement, defined as at least 25% of nights with each parent (Institute for Research on Poverty, 2025).
- About a third of those Wisconsin divorce cases ended in mother-sole placement, defined as more than 75% of nights with the mother.
- Equal placement, an exact 50-50 split, rose from 23% to 44% of Wisconsin divorce cases over the two decades to 2019.
- Shared placement in Wisconsin divorces was 14% in the early 1990s and around 40% by the early 2000s.
- In voluntary paternity cases in the same Wisconsin courts and the same years, only 26% had shared placement and 69% had mother-sole placement (Institute for Research on Poverty, 2025). Marriage is what separates that figure from the divorce one.
- The widely quoted figure that fathers receive about 35% of parenting time comes from a 2018 Custody X Change survey of lawyers rather than from court records.
- 22.2 million children, 27.1% of all children under 21 living in families, had a parent living outside the household in 2022 (Census, P60-285, 2025).
- There were 10.9 million custodial mothers and 3.0 million custodial fathers in 2022, so fathers were 21.6% of custodial parents (our calculation from the Census counts).
- Only 41.0% of those 13.9 million custodial parents had a court order or an informal agreement for child support (Census, P60-285, 2025).
- 24.5%, about 1.1 million, of custodial parents who were supposed to receive payments received none in 2022 (Census, P60-285, 2025).
- 26.6% of custodial fathers had never married, against 42.7% of custodial mothers (Census, P60-285, 2025).
- The family poverty rate in 2022 was 22.6% for families with a custodial mother and 12.6% for families with a custodial father, against 11.3% for all families with children under 21 (Census, P60-285, 2025).
- 3.5 million children under 18 live with a solo father and 14.4 million with a solo mother, so the father share of solo-parent children is 19.7% (ACS 2024, our calculation).
- That share ranges from 33.6% in Alaska to 11.4% in the District of Columbia, a spread of 22.2 percentage points (ACS 2024, MarriageScience calculation).
- The same Census release also supports a father share of 25.7%, from a different table that counts a father living with an unmarried partner as a solo parent (ACS 2024, our comparison).
There Is No National Custody Statistic
There is no national custody statistic for the United States. No federal agency collects or publishes the custody or physical placement outcomes of family court cases, so there is no single official answer to how often fathers receive custody after parents separate.
That absence comes from the structure of the system. Family law is state law, and family courts are county institutions, which means there is no national reporting line for what those courts decide in custody cases.
This is unusual. The United States counts births, deaths, marriages in outline, crimes, employment and school enrollment, but it does not count what happens to children when their parents separate.
The gap is wider than custody alone. The National Center for Health Statistics stopped collecting detailed marriage and divorce records in 1996, which is why there is also no national count of divorce petitions.
That matters because custody statistics are often quoted as if they came from one public file. They do not. What remains is a patchwork of partial sources, each measuring a different thing.
For this topic, the available numbers usually fall into three kinds of evidence: a household survey that never asks about custody, one state’s court records, and a private company’s estimate. Those sources can be useful, but they should not be treated as the same kind of evidence.
A household survey can describe where children live and which parent receives support, but it cannot say what a court ordered if it never asks about custody. Court records from one state can show what happened in that state, under that state’s law and reporting system, but they cannot speak for the country. A private estimate can add a viewpoint, but it is still not a federal count.
The careful way to read father custody statistics is to ask what was counted, who counted it, and whether the number describes households, court outcomes, or a model. Those are different questions. Mixing them together makes the national answer look more settled than it is.
This does not mean states collect nothing. Individual states publish their own court statistics, and some publish placement data. The missing piece is a national aggregation that puts those state and county records into one consistent public measure.
That is the starting point for every father custody claim. Before asking whether fathers are gaining custody more often, losing custody more often, or sharing placement more often, the first answer is simpler: the United States does not publish a national custody outcome statistic.
The Most-Quoted Figure Is a Survey of Lawyers
The clearest source for the widely repeated father custody figure is Custody X Change, a company that sells parenting-plan software. Its page says a father is likely to receive about 35% of parenting time nationally, with a figure for every state.
That page ranked second for the query “percentage of custody for fathers” and third for “child custody statistics” when we checked on 8 September 2026. That placement helps explain why the number travels so widely through search results and secondary articles.
The company’s own method note is specific about where the number came from.
“The research was conducted over four months in 2018 by talking to legal professionals in every state to learn the most commonly awarded schedule there. The research involved over one thousand emails and hundreds of phone calls. No customer data was used. We then took the detailed custody schedules and entered them into the Custody X Change software to give us the parenting time percentages for each state.”
Custody X Change
The input is what lawyers remember seeing. No case records were read. The legal professionals were asked about the most commonly awarded schedule in their state, so the source is a survey-style account of typical practice as described by people who work in custody cases.
The output is produced by the company’s own scheduling software. Custody X Change says it entered the detailed schedules into its software to turn those schedules into parenting time percentages for each state.
The scenario is narrower than the way the figure is often repeated. The company’s page gives this scope statement.
“The percentages in the study reflect cases in which both parents want custody and no complicating circumstances exist.”
Custody X Change
That means the estimate describes a case where both parents want custody and nothing is complicated. It does not describe cases where one parent does not seek custody, cases involving safety concerns, cases with special logistical barriers, or the full mix of family court outcomes.
The fieldwork is from 2018. The page presents the work as a state-by-state estimate of parenting time based on the most commonly awarded schedule reported by legal professionals at that time.
This does mean something useful. In a field where public court-record data is thin, asking lawyers in every state about the typical schedule is a reasonable way to describe a common parenting-time pattern under a defined set of assumptions.
It also has a clear limit. It cannot tell anyone how often fathers get custody, because it never counted a single case. A parenting-time percentage generated from a described schedule is a different kind of information from a count of court orders, settlements, or final custody outcomes.
The difference matters because the 35% figure is often treated as if it came from administrative records. Custody X Change’s own page is more careful than that. It says the work was based on contact with legal professionals, and it explains that the percentages were generated after the schedules were entered into software.
Of the 37 top-ranking pages we tested, only Custody X Change’s own page says the study was a survey of lawyers or gives its year. Every page repeating the number omits both. The original source gives readers enough information to see that this is a lawyer-informed schedule estimate from 2018 rather than a national count of custody awards.
| Element | What it is | Source |
| Headline figure | About 35% of parenting time to fathers | Custody X Change, 2018 |
| Data collection | Emails and calls to lawyers in every state | Custody X Change, 2018 |
| Percentages produced by | The company’s own scheduling software | Custody X Change, 2018 |
| Cases described | Both parents want custody, no complications | Custody X Change, 2018 |
| Court records examined | None | Custody X Change, 2018 |
Where Custody Outcomes Are Actually Counted
The clearest court-record account of physical placement comes from Wisconsin. Judith Bartfeld’s Shared Placement in Wisconsin, published by the Institute for Research on Poverty at the University of Wisconsin-Madison in July 2025, reports figures from Chanda, Koo and Bartfeld using the Wisconsin Court Record Data, a sample of cases from 21 of Wisconsin’s 72 counties.
The report is useful because it counts what court files actually record. It does not ask parents to remember an order years later, and it does not reduce custody to a single household label. It looks at placement time, which is the thing parents usually mean when they talk about custody after divorce.
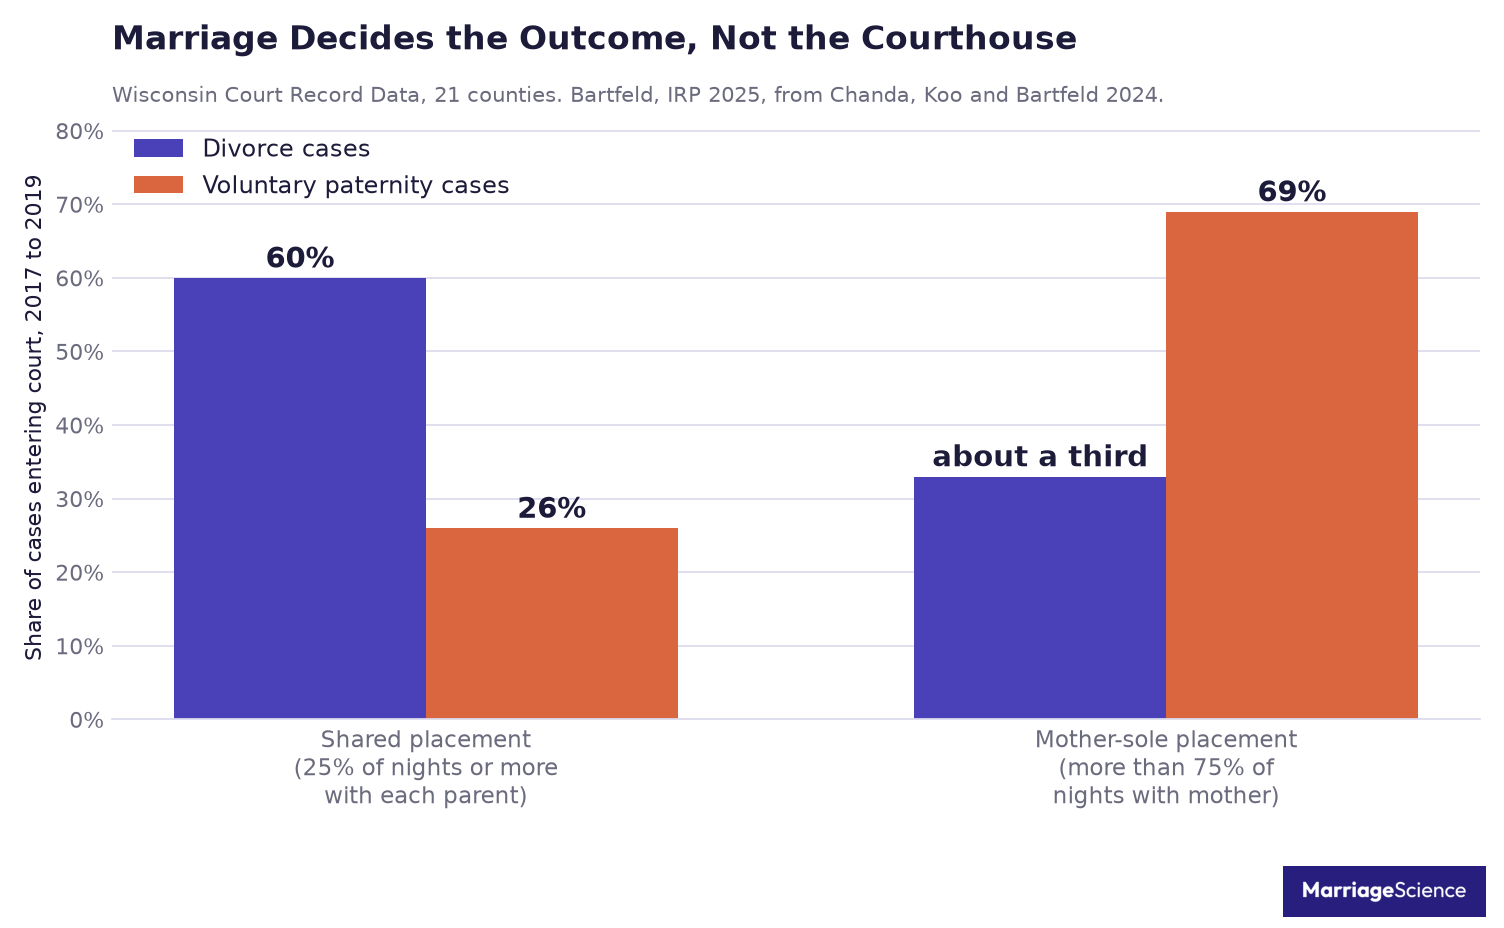
The definitions matter. In the report, mother sole placement is “more than 75% of nights with mothers.” Shared placement is “at least 25% of nights with each parent.” Shared placement includes equal placement, defined as “50% of time with each parent.” Those labels separate a mother-primary schedule from a schedule where both parents have a substantial share of overnights.
For divorce cases entering court between 2017 and 2019, 60% had shared placement, while about a third had mother-sole placement. Equal placement rose from 23% to 44% of divorce cases over the two decades to 2019. Mother-primary placement, meaning 51 to 75% of time with the mother, “has fluctuated in the 11-15% range.”
The longer trend points in the same direction. Shared placement was 14% in the early 1990s, around 40% by the early 2000s, and 60% in the most recent data. The Wisconsin series is therefore one of the rare places where a reader can see change in actual placement orders over time, using repeated court-record measures.
| Wisconsin divorce cases | Share |
| Shared placement, 2017 to 2019 | 60% |
| Mother-sole placement, 2017 to 2019 | About one-third |
| Equal placement, early 2000s | 23% |
| Equal placement, 2017 to 2019 | 44% |
| Shared placement, early 1990s | 14% |
| Shared placement, early 2000s | Around 40% |
Source: Institute for Research on Poverty, 2025, from the Wisconsin Court Record Data.
The earlier peer-reviewed work on the same records is Cancian, Meyer, Brown and Cook in Demography, 2014. It found that between 1988 and 2008 “the proportion of mothers granted sole physical custody fell substantially, the proportion of parents sharing custody increased dramatically, and father-sole custody remained relatively stable.” That finding fits the later Wisconsin pattern, with shared placement growing while father-sole custody did not become the main story.
The first caveat is simple. This is one state and a sample of 21 of its counties. It is not a national figure, and it should not be presented as one. Wisconsin tells us what a strong court-record series can show when the records exist and can be analyzed.
The second caveat is also part of the story. Wisconsin passed legislation encouraging shared placement in 1999 and changed the associated child support guidelines in 2004. That means Wisconsin is not a neutral sample of American family law. Its policy setting matters when interpreting the trend.
That does not weaken the Wisconsin research. It explains why the evidence is so valuable and so limited at the same time. This is the best court-record series in the country, and it covers one state. That is the problem with custody statistics. It is no criticism of the research.
Family law is state law, which is why single-state findings travel badly. Our analysis of the divorce rate by state shows how much the underlying rate of separation varies before any court decides anything.
Marriage Predicts the Outcome More Than the Courthouse Does
The sharpest split in the Wisconsin numbers is not father against mother. It is divorce cases against voluntary paternity cases, meaning cases where the parents were not married.
In Wisconsin divorce cases from 2017 to 2019, 60% had shared placement, while about a third had mother-sole placement. In voluntary paternity cases in the same courts and the same years, 26% had some form of shared placement and 69% had mother-sole placement. The report calls mother-sole placement “the norm” for those paternity cases.
That contrast is the answer to the question readers usually bring to custody statistics. Within one state, one court system and one set of judges, whether a father shares time with his children tracks whether he was married to their mother far more than anything else in these figures.
The courthouse is the same. The case type is different. The outcomes are different too.
The paternity numbers have moved, but they have moved from a much lower baseline. The report says growth in shared placement among paternity cases has been real, while also noting limited overall growth since 2010.
The report also says incomes in paternity cases are substantially lower than in divorce cases. That point should be read as a description of the case populations. It is a warning against treating divorce and paternity files as interchangeable custody data.
The data supports the gap. It does not support a clean story about cause. Marriage may be tied to legal history, household structure, money, bargaining position, parenting routines, or other factors that are outside these figures. Naming the cause would ask more of the report than it can prove.
This distinction is missing from much of the public custody discussion. None of the 37 top-ranking pages we tested distinguishes divorce cases from unmarried-parent cases.
That omission changes the meaning of the claim. A national conversation about fathers and custody that blends divorce cases with unmarried-parent cases is comparing different populations. The Wisconsin data makes that clear in one place, over the same years, under the same court system.
One Question, Three Official Federal Answers
The phrase father custody statistics sounds like it should point to one official number. In federal data, it does not. The US Census Bureau can give three correct answers to what sounds like the same question, because each table is counting a different thing.
The broadest answer is 25.7%. That is the father share of own children under 18 living in “other families” in ACS 2024 table B09002. This table places a father living with an unmarried partner inside a male-householder family, so cohabiting fathers are included.
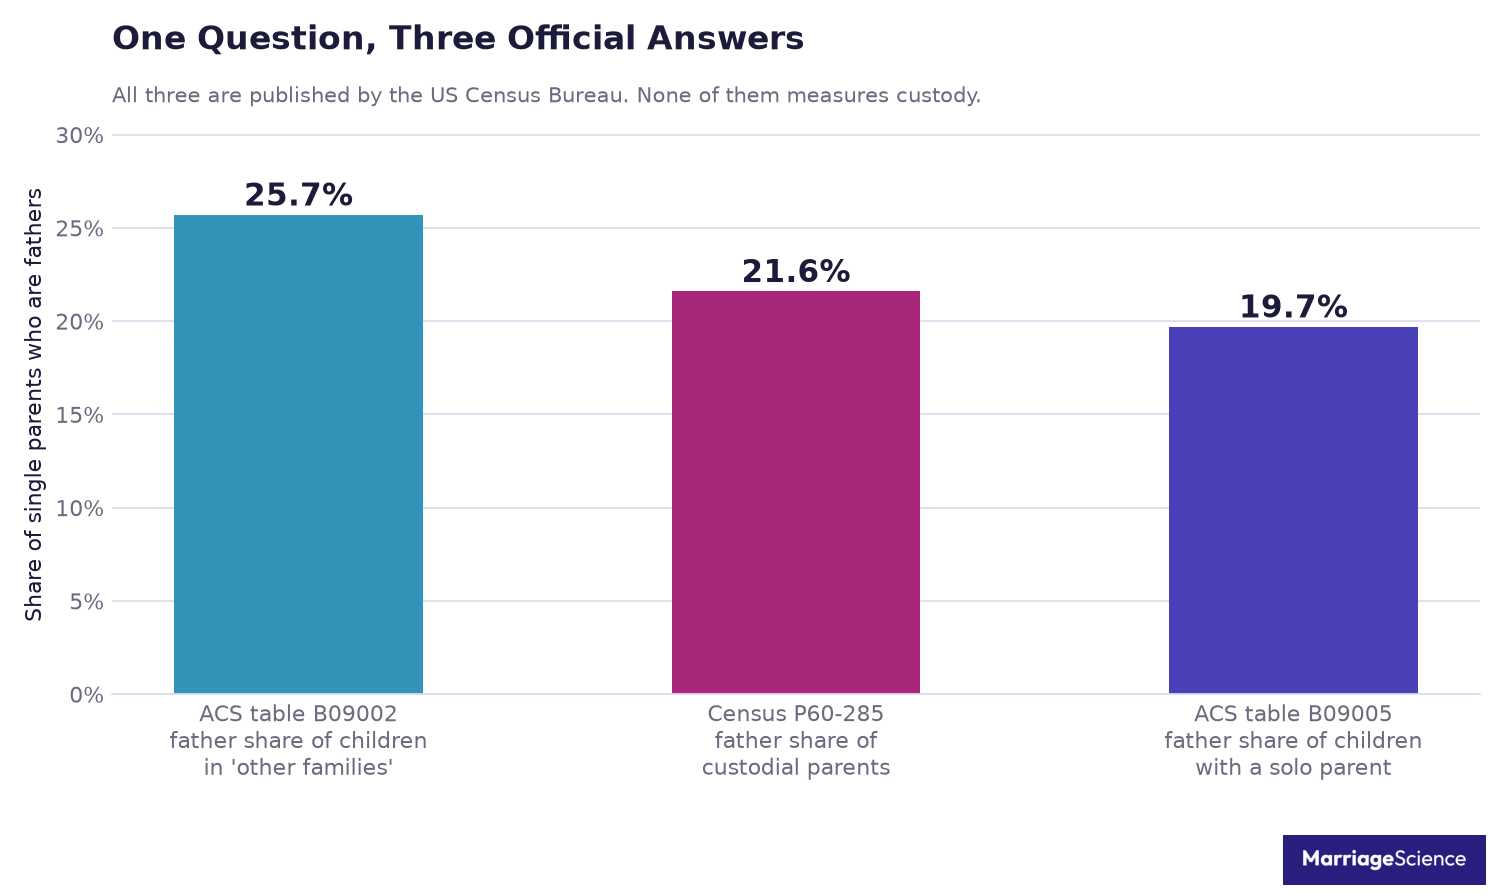
A second answer is 21.6%. That is the father share of custodial parents in Census report P60-285. The report gives counts, 3.0 million custodial fathers and 10.9 million custodial mothers in 2022, and the percentage follows from those counts. In that report, a custodial parent is one who lives with a child under 21 whose other parent lives elsewhere.
A third answer is 19.7%. That is the father share of children under 18 living with a solo parent in ACS 2024 table B09005. This table separates cohabiting couples into their own category, so it does not put cohabiting fathers in the solo parent count.
| Figure | What it counts | Source |
| 25.7% | Father share of children in “other families”, cohabiting fathers included | ACS 2024, table B09002 |
| 21.6% | Father share of custodial parents owed or receiving support | Census P60-285, 2025 |
| 19.7% | Father share of children living with a solo parent, cohabiting couples excluded | ACS 2024, table B09005 |
The gap between 25.7% and 19.7% is entirely definitional. Both figures come from the same survey and the same release. The difference comes from where the Census Bureau puts unmarried partners in the household classification.
That distinction matters because readers rarely see the table choice behind a sentence. One article can honestly say fathers are a quarter of single parents. Another can honestly say fathers are a fifth. Those statements can both be defensible, even though they create different impressions.
The 21.6% figure answers a different question again. It comes from the child support universe, where the label custodial parent is tied to a parent living with a child while the other parent lives elsewhere. It describes who is owed or receiving support. It says nothing about how parenting time is divided.
None of the three measures custody. Two describe where children sleep. The third describes who is owed child support. None tells the reader what a court ordered, how parents share decision-making, or how many overnights a child has with each parent.
This is the missing measurement problem in most public summaries of father custody. The same agency can publish all three figures, and all three can be correct. The error begins when one of them is treated as the father custody rate.
Zero of the 37 top-ranking pages we tested note that the tables disagree. That silence leaves readers with false precision. The sentence looks simple, but the definition underneath it has already decided which fathers count.
Definitions do this to family measures generally. Our marriage statistics set out the same problem for marriage rates, where the denominator changes the headline.
What the Census Custodial-Parent Data Shows
The Census Bureau’s child support series is the federal source that comes closest to a national count of custodial fathers. In Liza C. Valle’s Custodial Parents and Their Child Support: 2022, Current Population Reports P60-285, the Bureau used the Child Support Supplement to the April 2023 Current Population Survey. The Census makes the series available on its child support topic page.
In 2022, 22.2 million children, 27.1% of all children under 21 living in families, had a parent living outside the household. The same report counted 10.9 million custodial mothers and 3.0 million custodial fathers. That is why this dataset matters for father custody statistics, even though it is not a court record and does not describe parenting time.
The wording matters. In this report, custody is observed through residence, so a father appears as a custodial father when the child lives in his household. The same label does not say whether the other parent has frequent parenting time, whether the placement was shared by agreement, or whether a judge ever signed an order.
| Measure | Value | Source |
| Children with a parent living elsewhere | 22.2 million, 27.1% | Census P60-285, 2025 |
| Custodial mothers | 10.9 million | Census P60-285, 2025 |
| Custodial fathers | 3.0 million | Census P60-285, 2025 |
| Custodial parents with an order or agreement | 41.0% | Census P60-285, 2025 |
| Supposed to receive support and received none | 24.5% | Census P60-285, 2025 |
| Family poverty rate, custodial mother | 22.6% | Census P60-285, 2025 |
| Family poverty rate, custodial father | 12.6% | Census P60-285, 2025 |
The marital history figures show that custodial fathers and mothers entered this status through different family paths. Custodial fathers were less likely than mothers to have never married, 26.6%, and more likely to be divorced, 34.8%. Among custodial mothers, 42.7% had never married. The Census table places those histories beside child support status.
The child support numbers warn against treating “custodial parent” as a synonym for “parent who won custody in court.” Only 41.0% of the 13.9 million custodial parents had either a court order or an informal agreement to receive support. For custodial mothers, the figure was 43.2%. A custodial parent in this survey may have no order or agreement and may never have been to court at all.
Payment receipt adds another limit. Among custodial parents who were supposed to receive payments, 24.5%, about 1.1 million, received none. This is a child support finding and it is not a measure of physical custody. It tells readers whether support arrived, and nothing about how overnights were split.
The poverty data show a large economic gap. In 2022, the family poverty rate was 22.6% for families including a custodial mother and 12.6% for families including a custodial father. For all families including a custodial parent, the rate was 20.7%. For all families with children under 21, it was 11.3%.
The main limit is simple. The survey identifies who lives with the child. It does not ask what a court ordered, and a custodial parent here may never have been to court at all. The 41.0% order or agreement figure makes that limit visible, because a majority of these families have no order of any kind. For this article, the data answer a household question tied to child support and poverty. They do not create a national custody-order database.
The money side of a separation is measured better than the custody side. Our analysis of who files for divorce uses Census microdata to compare men and women in the year after a divorce.
Where Children With One Parent Live With Their Father
The Census residence data gives a state-by-state view of children who live with one parent. In ACS 2024 1-year table B09005, 72,736,534 children under 18 live in households. Of those children, 48,553,644, or 66.8%, live with a married couple, 6,224,660, or 8.6%, live with a cohabiting couple, 3,531,575, or 4.9%, live with a father only, and 14,426,655, or 19.8%, live with a mother only.
Those last two groups are the base for the state comparison. Solo-parent children are 24.7% of all children. Among children living with one parent, the father share is 19.7% in the United States.
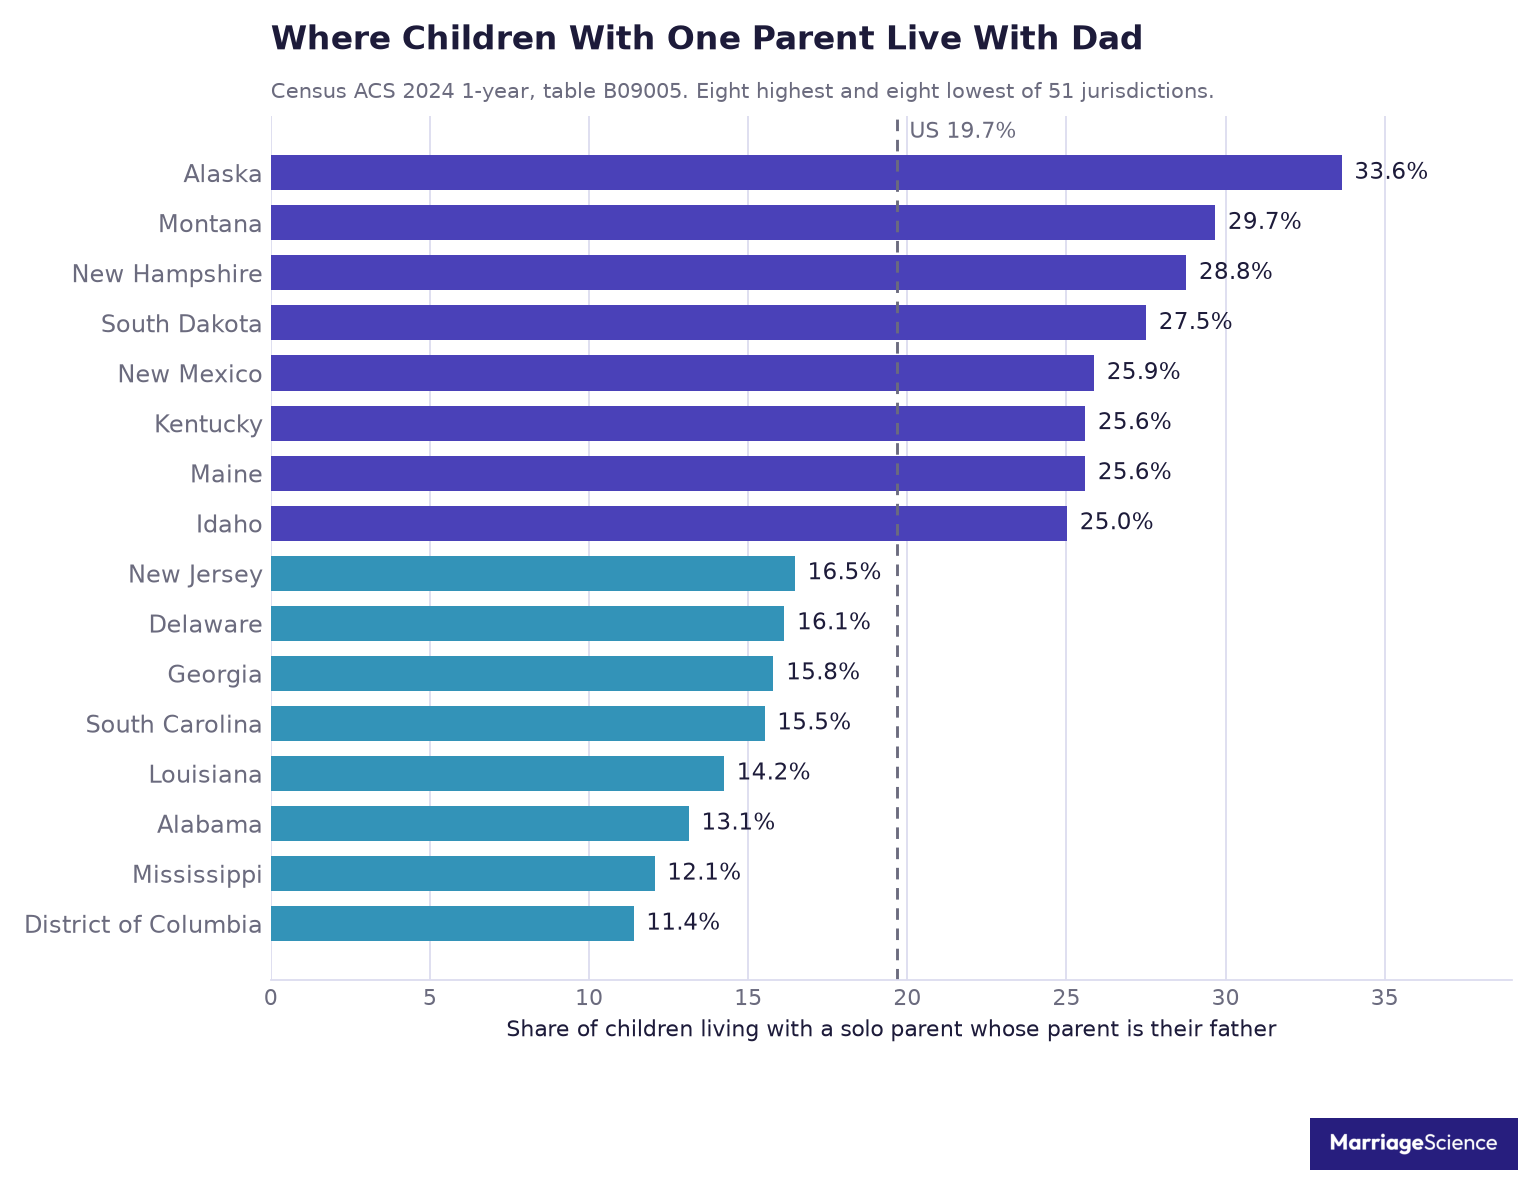
Our calculation divides children living with a father only by children living with either a father only or a mother only. The Census publishes the counts, and the share is ours. All 51 jurisdictions publish both counts, so there is no missing state in this comparison.
The highest father share is in Alaska, at 33.6%. Montana follows at 29.7%, and New Hampshire follows at 28.8%. These are the places in the ACS data where children with one resident parent are most likely to live with their father.
The lowest father share is in the District of Columbia, at 11.4%. Mississippi is next at 12.1%, followed by Alabama at 13.1%. The spread from top to bottom is 22.2 percentage points, or 2.95 times from top to bottom.
| State | Children with a solo father | Children with a solo mother | Father share |
| Alaska | 13,465 | 26,552 | 33.6% |
| Montana | 14,693 | 34,823 | 29.7% |
| New Hampshire | 13,342 | 33,044 | 28.8% |
| United States | 3,531,575 | 14,426,655 | 19.7% |
| Alabama | 46,969 | 310,737 | 13.1% |
| Mississippi | 30,833 | 224,895 | 12.1% |
| District of Columbia | 6,880 | 53,478 | 11.4% |
Source: Census ACS 2024 1-year, table B09005, and our calculation.
This table measures where children sleep. It carries no information about what any court decided. A child counted with a father only may have regular time with a mother elsewhere. A child counted with a mother only may have a father who shares care without being the resident parent in the Census household record.
The state differences should be read with that limit in mind. A state where more children live with their father may have different family law, different marriage patterns, or a different mix of never-married parents. The table cannot separate them.
That limit is also why residence data and custody data should not be treated as the same thing. Census table B09005 is valuable because it is national, current, and available for every jurisdiction in this comparison. It still cannot say whether a father became the resident parent through agreement, court order, death of a parent, incarceration, military deployment, informal family choice, or another path.
For this article, the state table fills a gap in the public statistics people usually see. In our test set, no competitor publishes a per-state father share from Census data. The result is a simple residence measure, built from published counts, that shows how uneven father residence is across the country.
State differences in family patterns often follow work as much as law. Our study of the divorce rate by occupation measures that directly from Census microdata.
A Trend That Is Not a Trend
This is the place where a clean-looking line can mislead. Table B09005 appears to offer a simple history of father custody inside solo-parent households. The chart can make it look as if single fatherhood climbed, fell sharply, and then settled into a new lower level.
First, the apparent pattern. The value was 22.0% in 2010 and 23.6% in 2015. It then appears to drop to 19.1% in 2019, followed by 19.5% in 2022, 19.6% in 2023, and 19.7% in 2024.
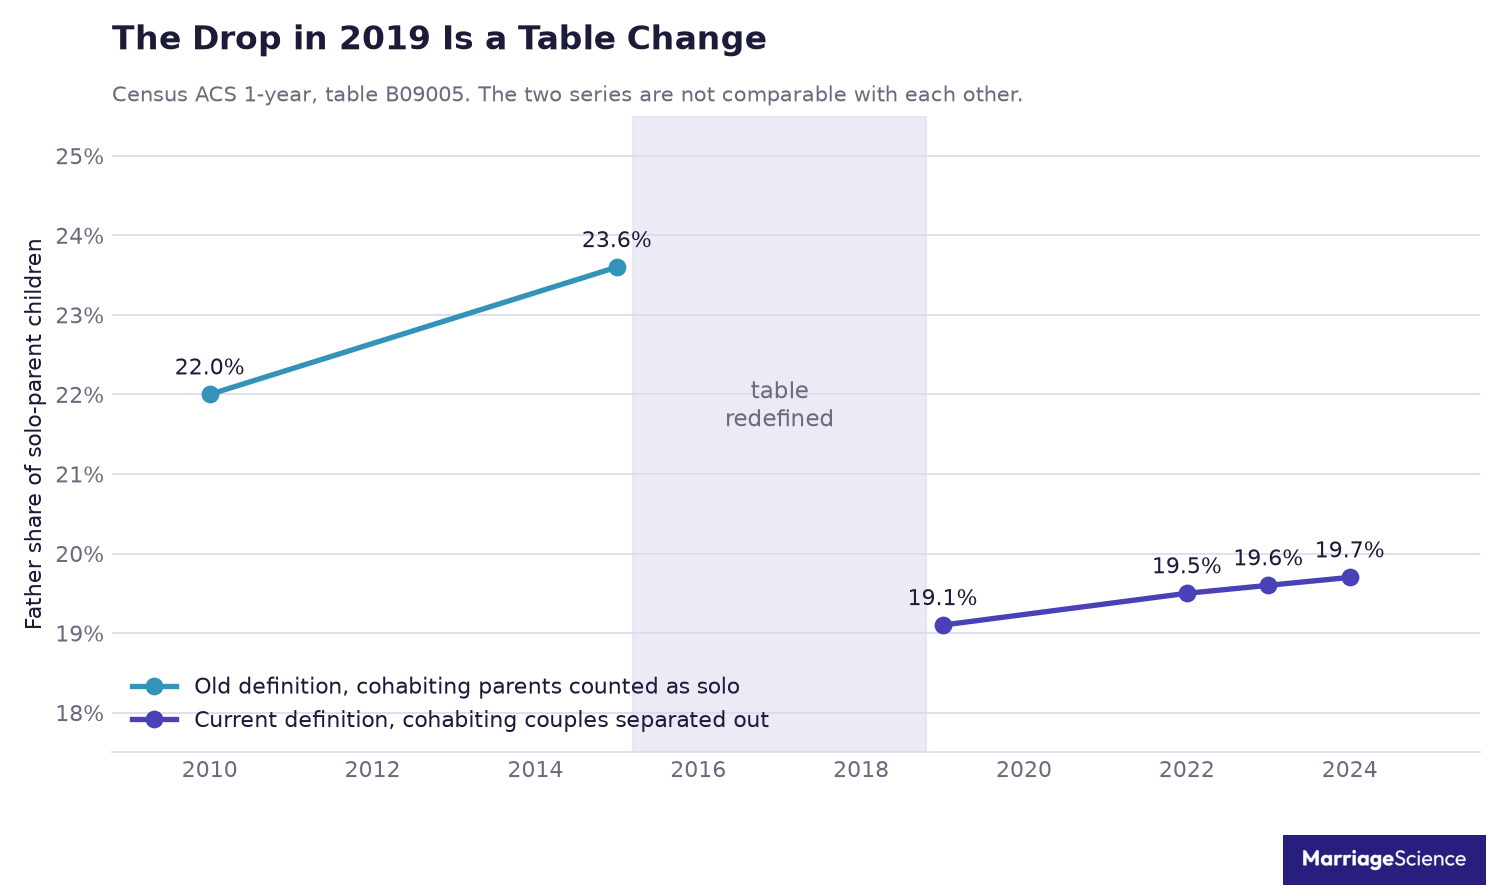
Read as one series, that looks like a sharp fall in single fatherhood after 2015. That reading is wrong, because the categories changed underneath the number. The table name stayed the same, but the table no longer counted the same family arrangements in the same way.
Before 2019, Table B09005 used categories called “male householder, no wife present” and “female householder, no husband present.” Those labels counted a cohabiting parent as a solo parent. From 2019, the table separates cohabiting couples into their own category.
That definition change breaks the long line. The values before 2019 and the values from 2019 onward should not be treated as one continuous trend. The apparent fall after 2015 is a measurement break. Nothing sudden happened to American families in those four years.
Only 2019 onward is comparable. On that basis, the father share of solo-parent children has been effectively flat, rising 0.6 percentage points in five years. The movement from 19.1% to 19.7% says much less than the broken line appears to say at first glance.
We checked the variable labels for each year and did not assume the series was continuous. That check is why this article publishes no long-run trend from this table. A table number carries a definition, and the definition can change while the table name does not.
The Fatherless Homes Statistics Cannot Be True as Attributed
A second trail in the search results is the familiar fatherless homes block. It appeared on six of the 37 pages we downloaded. The block gives large percentages for suicide, homelessness, behavioral disorders, dropping out and prison, often with official-sounding credits.
The problem is not that a reader can see the same numbers repeated. The problem is that the named sources do not support the trail back to a checkable record.
| Claim | Credited to | What we found |
| 63% of youth suicides | “USDHHS, Bureau of the Census” | Death certificates record no household composition |
| 71% of high school dropouts | “National Principals Association“ | That name dates from 1 July 2026, and ERIC holds 0 records for it |
| 85% with behavioral disorders | “Center for Disease Control” | No agency of that name exists |
| 85% of youths in prison | One Georgia county jail and Texas, 1992 | Two jurisdictions, presented as national |
| 90% of homeless and runaway children | Usually nothing | No source to check |
The suicide figure cannot come from the federal mortality file named in the citation. US mortality statistics are built from death certificates. The US Standard Certificate of Death, revision 11/2003, records the father’s name at item 11 and the decedent’s own marital status at item 9.
There is no item anywhere on that certificate for household composition, custody status or whether the decedent lived with a parent. The Census Bureau also does not collect cause-of-death data. A citation to the Census Bureau cannot verify a cause-of-death claim.
The dropout citation has a different failure. The National Principals Association came into existence on 1 July 2026, when the National Association of Secondary School Principals rebranded. Its members approved that change in December 2025.
The dropout statistic has circulated since the 1990s. The organization is real and long established. The name it is credited under is three months old, so nothing published under that name can be the original source for a statistic already circulating in the 1990s.
The research database check points the same way. A search of ERIC, the US Department of Education’s own research database, for the exact phrase “National Principals Association” returns zero records. A control search for “National Association of Secondary School Principals” returns 322.
That is a useful control because it shows the database indexes the real organization. ERIC is not missing the organization as a category. It has no report by the cited name.
The behavioral-disorders citation names an agency that does not exist. The federal agency is the Centers for Disease Control and Prevention. The claim is usually credited to the “Center for Disease Control,” which is not the agency’s name.
A miscited agency name does not automatically make the child outcome claim false. It does mean the citation has not been read closely enough to give a reader a usable path back to the data.
The prison claim has the same trace problem in a different form. It is credited to Fulton Co. Georgia jail populations and Texas Dept. of Corrections 1992, then presented as a national statement about youths in prison. Two jurisdictions cannot be checked as a national source without a named national file or report.
The homelessness claim is weaker still as a citation trail. The 90% figure is usually printed with no source at all. That leaves no table, no agency, no survey name and no method to inspect.
None of these checks proves the underlying claims about children are false. They prove the citations attached to them are not real, so the numbers cannot be checked, updated or contested. A figure that cannot be traced cannot be defended either.
Among the 37 top-ranking pages we tested, none questions any of these figures. The repetition gives the block the feel of established fact, but the attributions collapse when they are followed back to the named sources.
What the Careful Research Actually Finds
The honest version starts with a plain admission. Father absence does matter. A useful account has to say that without turning every hard outcome in a child’s life into a viral custody statistic.
McLanahan, Tach and Schneider reviewed the evidence in “The Causal Effects of Father Absence”, published in Annual Review of Sociology in 2013, volume 39, pages 399 to 427. The review looks at studies using lagged dependent variable models, growth curve models, individual and sibling fixed effects, natural experiments and propensity score matching. Those designs try to separate father absence itself from the other conditions that often sit around it.
That separation matters. Children who lose daily contact with a father may also experience income loss, parental conflict, household moves, school changes or parental stress. Some of those conditions may have started before the separation. The research designs in the review are attempts to keep those forces from being mistaken for the effect of father absence alone.
“Our assessment is that studies using more rigorous designs continue to find negative effects of father absence on offspring well-being, although the magnitude of these effects is smaller than what is found using traditional cross-sectional designs. The evidence is strongest and most consistent for outcomes such as high school graduation, children’s social-emotional adjustment, and adult mental health.”
That conclusion is careful in both directions. It says the negative effects remain when researchers use stronger designs. It also says the effects are smaller than the estimates produced by traditional cross-sectional comparisons.
The outcomes named in the strongest part of the evidence are graduation, social-emotional adjustment and adult mental health. Those are serious outcomes. They are also different from the most common viral block of claims, which is usually loudest about suicide, prison and homelessness.
That mismatch is the key point. The careful literature is most cautious about the outcomes that make the viral claims sound most dramatic. The claims are strongest exactly where the evidence is weakest.
Six of the 37 pages we tested cite this review. None of them carries that caveat. They borrow the authority of the review while leaving out the sentence that limits how the evidence should be read.
The point here is measurement. This page makes no family policy claim. A careful reading allows a direct statement that father absence can harm children. The same reading also warns against converting every severe child outcome into a simple father absence number.
What We Could Not Find
Some of the most useful father custody statistics are absent from the public record we could verify.
We could not find a national percentage of custody awarded to fathers. This article does not promote Wisconsin’s number or Custody X Change’s estimate to national status, because neither one is a national court record count. Those figures can describe the source that produced them, but they cannot support a United States custody rate for fathers.
We also could not find court-record custody outcomes outside a handful of states. Of the 37 top-ranking pages we tested, none carried that record either. That absence matters because a court record and a survey estimate answer different questions: one can record an order or placement result, while the other depends on its own sample, wording and definitions.
We could not build a defensible long-run trend in the father share of solo-parent children. The Census table was redefined in 2019, which breaks the line that would be needed for a clean comparison over time. A chart can still show separate periods, but it cannot treat the old definition and the new definition as the same measurement.
We could not trace the source for fatherless-homes statistics after checking the death certificate, the federal education research database and the named organizations. Repeated wording is not the same as a source trail. When a claim could not be traced back to a record, table or named publication, we left it out.
The missing piece is a national aggregation of state family court records. Several states already publish placement data, but nobody collects them together.
A prenuptial agreement cannot decide custody. Courts settle that on the child’s circumstances at the time, and a clause that tries to fix it in advance does not bind them.
What an agreement can settle is property and spousal support, under rules written state by state, and our prenup guides cover Texas, Georgia, Alabama, Mississippi, Montana, Alaska and New Hampshire.
Methodology and Sources
This page separates official data from claims that circulate in search results. Court placement, household structure, child support income, and research on child outcomes were handled as different evidence streams, because they answer different questions about father custody.
The main court source is the Institute for Research on Poverty report of July 2025. That report uses Wisconsin Court Record Data, a sample of cases from 21 of Wisconsin’s 72 counties. We also used the 2014 Demography paper on the same records to compare how the Wisconsin data have been analyzed over time.
- Court outcomes came from the Wisconsin placement sources, with the July 2025 report treated as the current summary.
- Household and income data came from Census report P60-285, based on the April 2023 Current Population Survey Child Support Supplement, plus American Community Survey 2024 1-year tables B09002 and B09005 pulled from the Census API.
- Claims checking used the Custody X Change study page, the US Standard Certificate of Death revision 11/2003, the ERIC database, and the principals association’s own account of its renaming.
- Research on child outcomes came from the 2013 Annual Review of Sociology review of father absence.
Several ratios in the article are our own calculations from the sources named above. These include the father share of custodial parents, the father share of solo-parent children nationally and by state, the comparison between the two Census tables, and the check on the definitional break in 2019.
We excluded law firm marketing pages, aggregator statistics roundups, and any figure that could not be traced to a primary source. For the search-results check, we tested 37 of the 53 top-ranking pages by downloading them and reading the matched text. We did that reading by hand because two apparent matches turned out to be different papers with similar author names.
That exclusion rule affected several claims that are popular online but weakly sourced. If a page repeated a number without naming the dataset, table, certificate, or publication behind it, we did not use that number in the article. If a claim pointed back to another roundup, we followed the chain until it reached an original source or stopped.
The page will be updated when the next Wisconsin placement figures and the 2025 ACS tables are released. Updates will keep the same separation between court records, Census household counts, income tables, and claims-checking sources, so readers can see which part of the evidence changed.



