


Gray divorce is divorce at age 50 or older. The same idea is sometimes written as grey divorce, and for couples past retirement age it is also called silver divorce.
In 2024, 40.0% of Americans who divorced were 50 or older, about 752,000 people, according to our analysis of the Census Bureau’s American Community Survey.
The older benchmark often quoted is roughly 1 in 4 in 2010, from sociologists Susan Brown and I-Fen Lin. The surprise in the same survey is that the gray divorce rate itself has not risen since 2008. It was 11.2 divorces per 1,000 married adults 50 and older in 2008 and 10.1 in 2024. The share grew because younger couples divorce far less than they used to.
This page adds gray divorce rates for every state, computed from 13.6 million Census records. It also looks at how long those marriages lasted, what the year after divorce looks like, and three claims about gray divorce that the data do not support.
For divorce at every age, including how many marriages end and when, see our roundup of divorce statistics.
Gray Divorce Key Statistics
Unless another source is named, every figure below is our analysis of the Census Bureau’s American Community Survey for 2024. State figures use the 2020 to 2024 five-year file.
- The often quoted doubling of gray divorce between 1990 and 2010 compares 1990 court-record counts with a 2010 Census survey, two instruments that do not measure divorce the same way.
- A 2018 study of couples in the Health and Retirement Study found that an empty nest, retirement and chronic illness were unrelated to the chance of gray divorce.
- In the 2004 AARP study behind many gray divorce claims, 73% of respondents had divorced in their 40s. Only about 26% divorced at 50 or older.
- 40.0% of people who divorced in 2024 were 50 or older, up from 25.8% in 2008. The share rose because younger adults stopped divorcing as often, while the gray divorce rate itself held flat.
- About 752,000 Americans aged 50 or older divorced in the past year, 751,963 in the survey estimate.
- The gray divorce rate was 10.1 divorces per 1,000 married adults aged 50 and older.
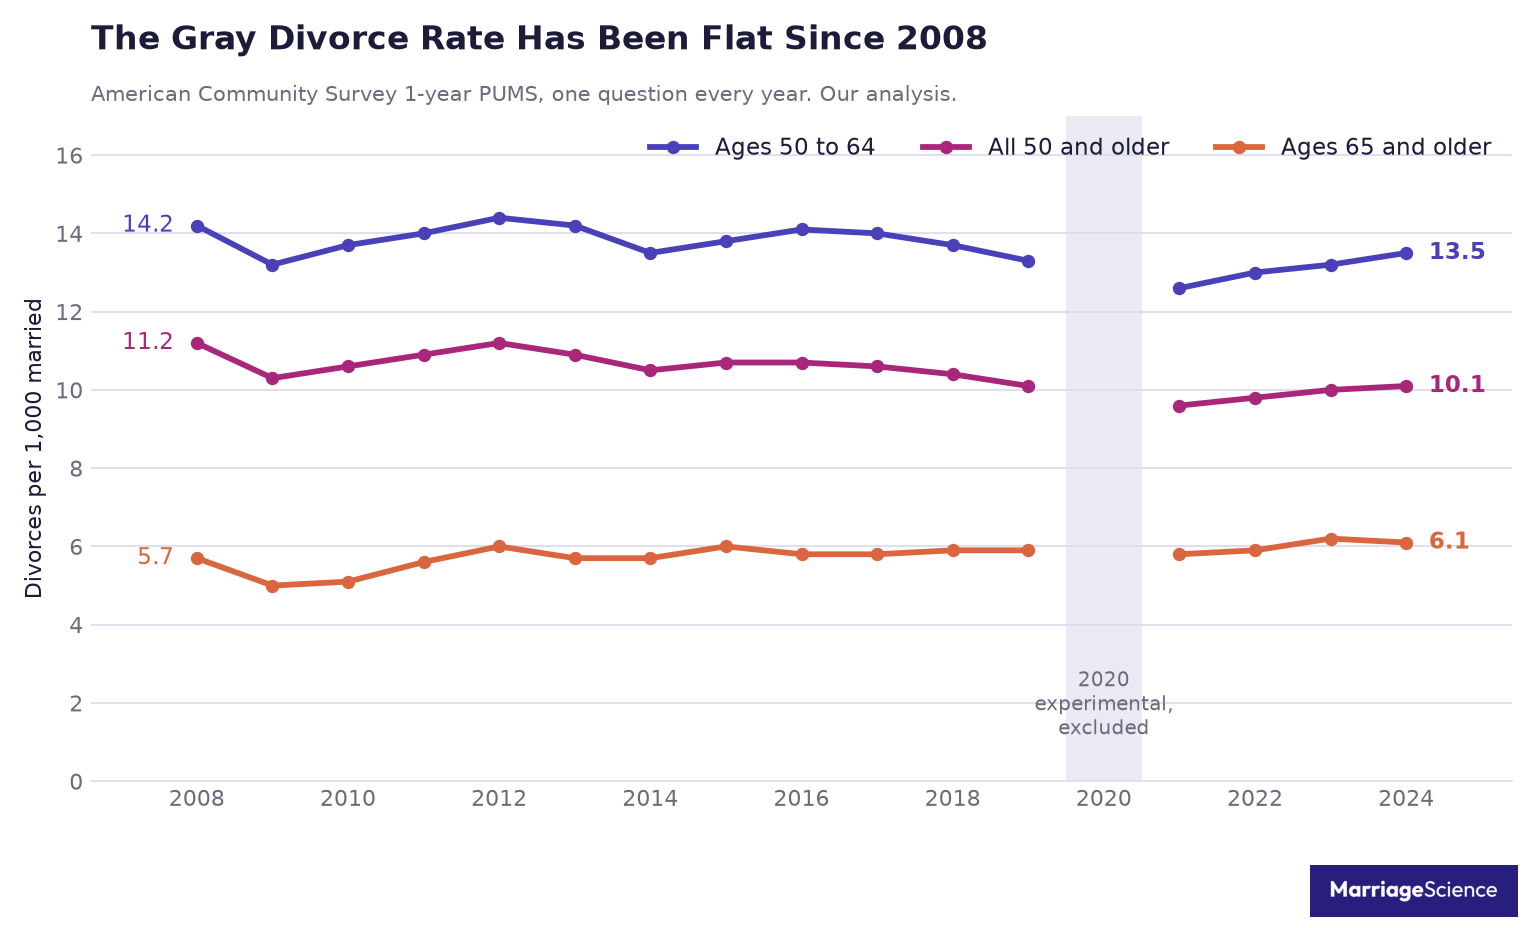
- Measured by the same Census survey every year, the gray divorce rate has not risen since 2008: 11.2 per 1,000 in 2008, compared with 10.1 in 2024.
- Only adults 65 and older are higher than in 2008, at 6.1 per 1,000 against 5.7.
- 11.3% of everyone who divorced in 2024 was 65 or older.
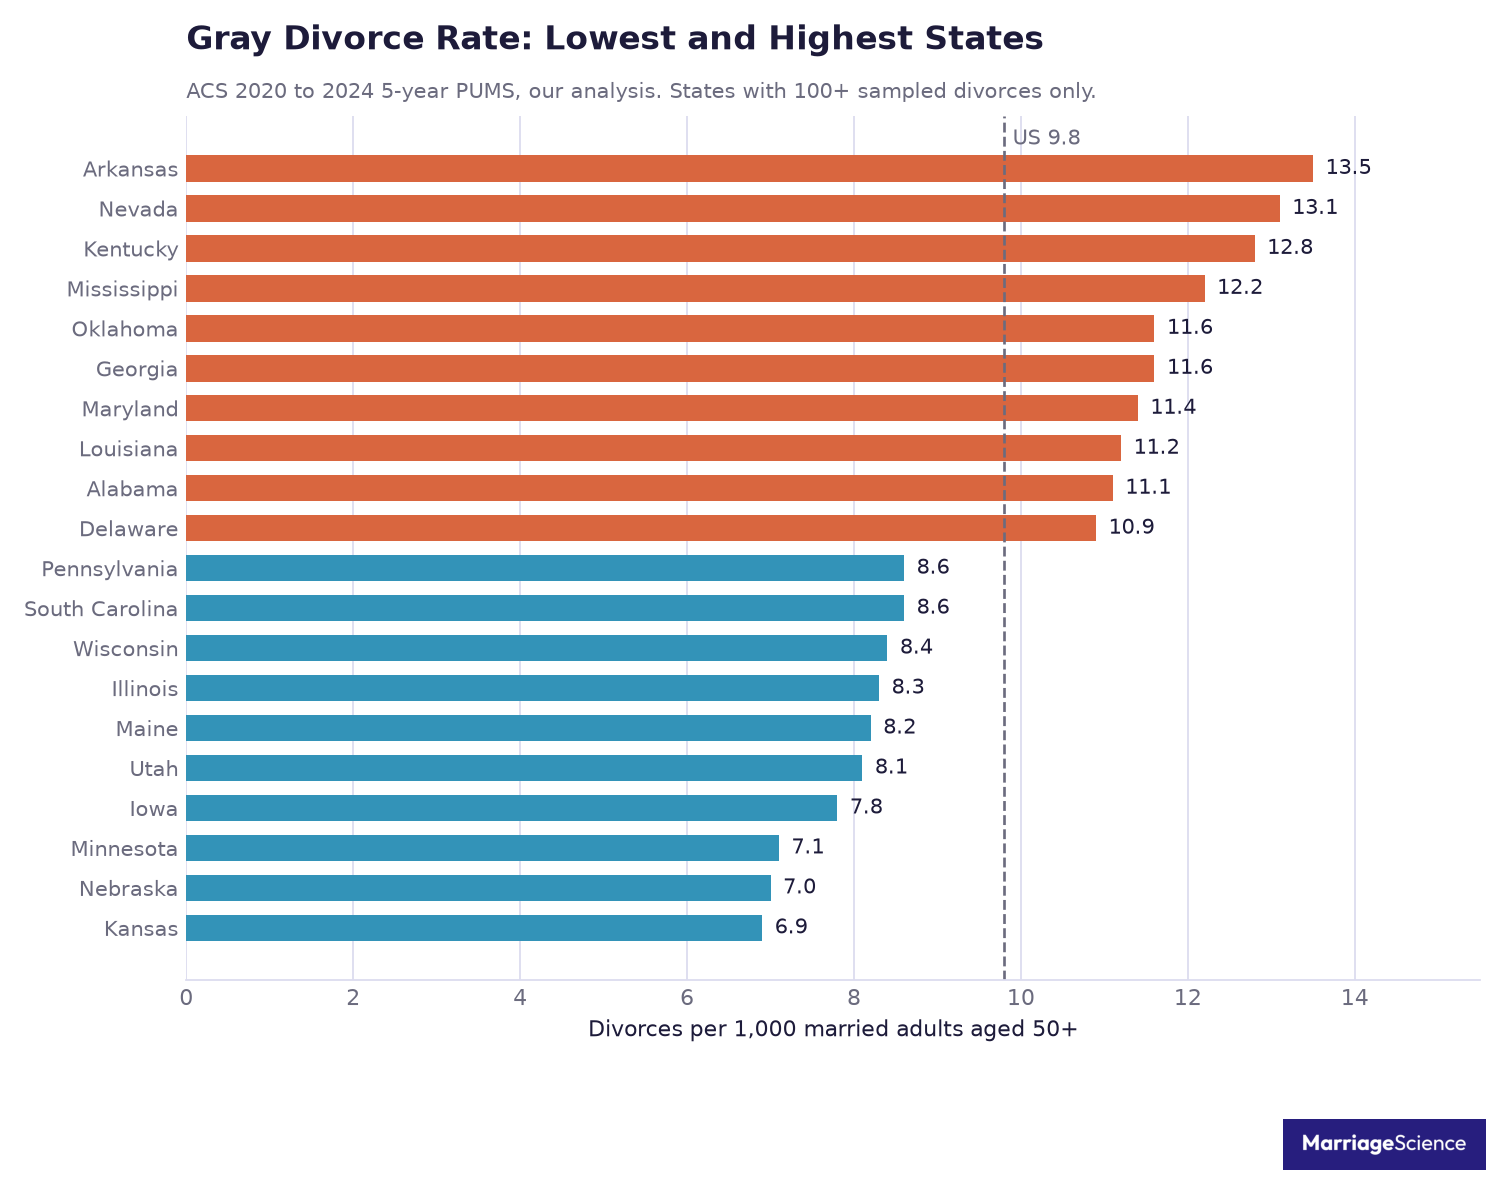
- Arkansas had the highest gray divorce rate of the states with enough data, 13.5 per 1,000. Kansas had the lowest, 6.9.
- In Connecticut, 47.0% of divorces involve someone 50 or older. In Utah, the share is 23.2%.
- First marriages that ended in a gray divorce had lasted a median of 28 years.
- 46.4% of first marriages that ended in a gray divorce had lasted 30 years or more, and 19.6% had lasted 40 years or more.
- Adults 50 and older in a remarriage divorced at 14.7 per 1,000, against 8.1 in a first marriage.
- In the year after a gray divorce, 19.4% of women and 15.9% of men were below the poverty line, against 5.1% of married women and 4.8% of married men aged 50 and older.
- 43.0% of people who divorced at 50 or older were living alone in the year after, against 1.4% of their married peers.
- In the Health and Retirement Study, women’s standard of living fell 45% after a gray divorce and men’s fell 21%.
What Gray Divorce Means and How It Is Measured
Gray divorce means divorce at age 50 or older. The spelling is American, although readers may also see grey divorce in other sources. The boundary matters because divorce risk is measured against the married population in each age group, not against everyone of the same age.
The American Community Survey is the Census Bureau’s annual survey of about 3.5 million addresses. Since 2008, it has asked whether each person divorced in the past 12 months, which lets researchers compare states and age groups using the same question.
Our analysis of Census data uses a refined divorce rate: people who divorced in the past 12 months per 1,000 people who were married at some point during that year. This differs from a crude divorce rate, which counts divorces per 1,000 people in the whole population.
That choice is especially relevant after midlife. Older adults are more likely to be married or widowed, so a per-person rate mixes divorce with the separate question of who is married at all. A refined rate keeps the denominator tied to the people who were at risk of divorce.
The ACS question is also what makes state figures possible, because the federal National Center for Health Statistics stopped collecting detailed divorce records in 1996, so there is no national register of divorces by age.
In 2024, the all-ages refined divorce rate was 13.8 divorces per 1,000 married people. The rate was 18.4 for people under 50 and 10.1 for people age 50 and older. Among people 50 and older, the rate was 9.7 for men and 10.4 for women.
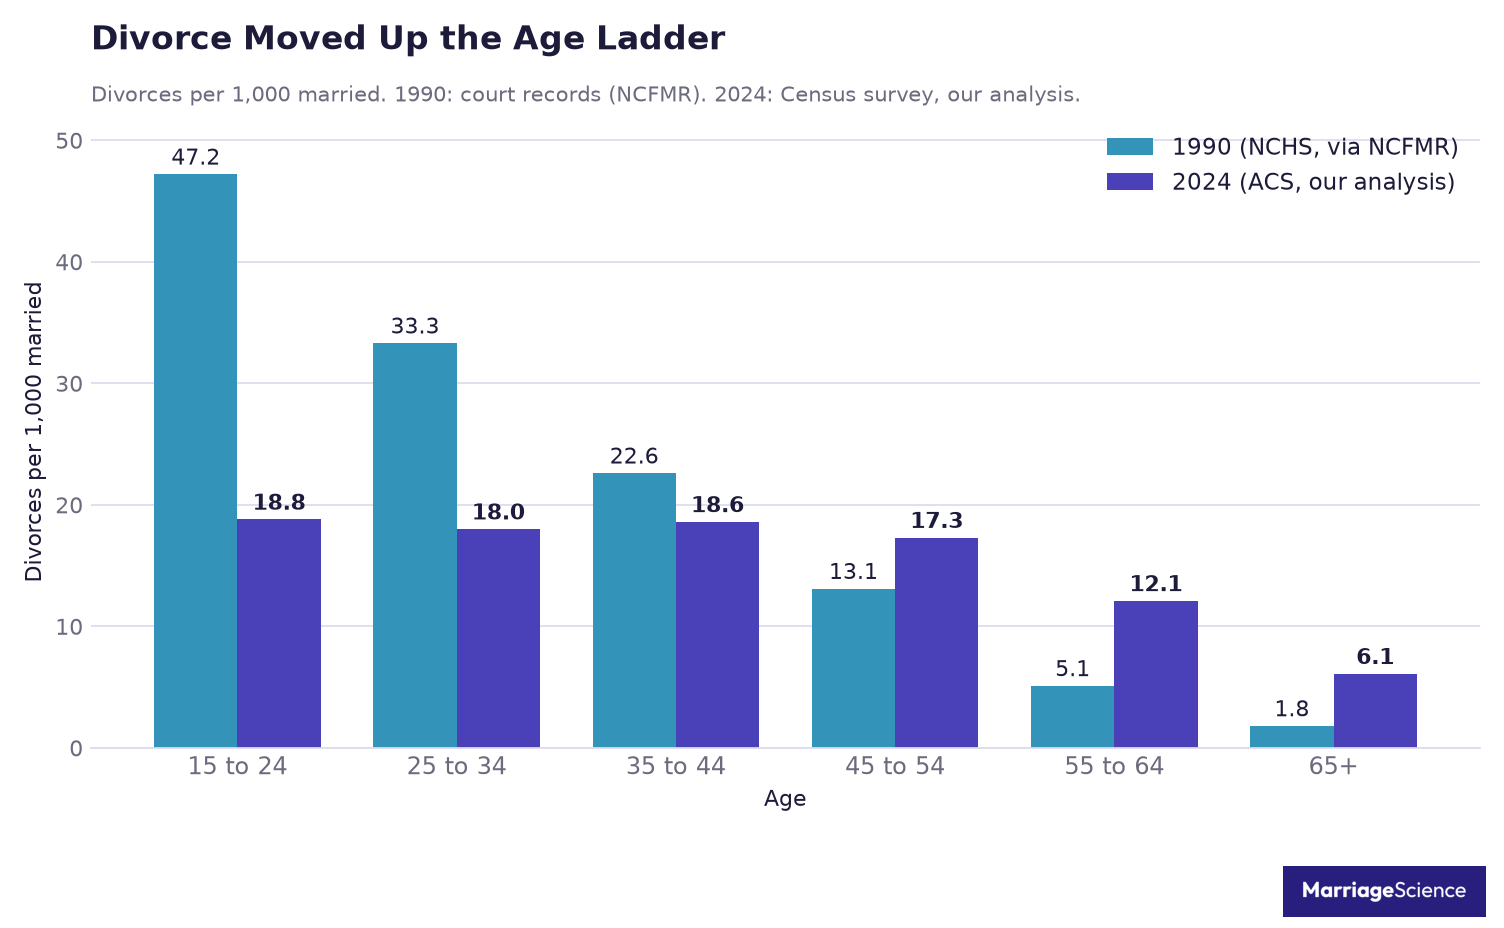
The age pattern is not flat. The highest listed rates are in the younger and middle adult groups, while the rate drops to 12.1 at ages 55 to 64 and 6.1 at age 65 and older. That difference is why the age cutoff should be kept visible when reading gray divorce statistics.
These rates count divorces that happened during the year. They do not show the share of marriages that will eventually end in divorce. The rate can move because divorces change, because the married population changes, or because both change, so the denominator is part of the statistic.
| Age Group | Divorces per 1,000 Married, 2024 |
| 15 to 24 | 18.8 |
| 25 to 34 | 18.0 |
| 35 to 44 | 18.6 |
| 45 to 54 | 17.3 |
| 55 to 64 | 12.1 |
| 65 and older | 6.1 |
| All ages | 13.8 |
| 50 and older | 10.1 |
| Under 50 | 18.4 |
How Common Is Gray Divorce Now?
Gray divorce now accounts for a large share of divorce in the United States. In our analysis of Census data, 751,963 people aged 50 and older divorced in the past year, out of 1,881,028 people who divorced at any age. That is 40.0% of all people divorcing, with 11.3% age 65 or older.
The long-term change is clear. The National Center for Family and Marriage Research (NCFMR), citing Brown, Lin and Julian 2024, puts the share of people divorcing who were 50 or older at 8% in 1990. By 2010, Brown and Lin reported roughly 1 in 4, and by 2019 the figure was 36%.
| Year | Share of people divorcing who were 50 or older | Source |
| 1990 | 8% | NCFMR, citing Brown, Lin and Julian 2024 |
| 2008 | 25.8% | our analysis |
| 2010 | 27.1% | our analysis, Brown and Lin 2012 reported roughly 1 in 4 |
| 2019 | 36.0% | our analysis, Brown and Lin 2022 reported 36% |
| 2024 | 40.0% | our analysis |
The same survey series shows the recent path in more detail. The share of people divorcing who were 50 or older was 25.8% in 2008, 27.1% in 2010, 36.0% in 2019, and 40.0% in 2024. The 2019 figure matches the 36% Brown and Lin reported for that year.
A rising share of divorces after 50 does not mean the gray divorce rate is rising over the same period. From 2008 to 2024, the divorce rate for all ages fell from 20.3 per 1,000 to 13.8. Over those same years, the rate for people aged 50 and older moved from 11.2 to 10.1.
The share rose because younger divorce fell much faster and because the married population got older. When a larger share of married people are over 50, a larger share of the people who could divorce are also over 50. That age structure can raise the 50 and older share of divorces even when the gray divorce rate itself does not rise.
The longer background points in the same direction. In 1990, the divorce rate for ages 15 to 24 was 47.2 per 1,000, according to NCFMR from 1990 vital statistics. In 2024, the rate for ages 15 to 24 was 18.8.
So the headline number has two meanings. Divorce after 50 is now common within the divorce population, reaching 40.0% of people who divorced in the past year. At the same time, the rate for people aged 50 and older was 10.1 per 1,000, lower than the all-age rate of 13.8.
The “Doubling” Compares Two Different Measuring Sticks
The best-known gray divorce statistic comes from Brown and Lin’s 2012 paper, The Gray Divorce Revolution. They reported that the divorce rate among adults 50 and older doubled between 1990 and 2010. Their abstract says they “used data from the 1990 U.S. Vital Statistics Report and the 2010 American Community Survey.”
That line has traveled widely. Of the 26 top-ranking pages we downloaded and read, 17 repeat the doubling, and only the two academic papers themselves say which two data sources were compared. The missing detail matters because the comparison joins two different measuring systems.
The 1990 figure counts court records reported to federal statisticians. The 2010 figure comes from people answering a survey question. Both are serious sources, but they do not measure divorce in the same way.
Kennedy and Ruggles, the 2014 Demography paper by Sheela Kennedy and Steven Ruggles, found that “The ACS yields divorce rate estimates that are not only higher than the retrospective surveys but also higher than the vital statistics.” They also note that by 2005 six states had stopped reporting any divorce data to the federal system.
That does not make the increase vanish. Brown and Lin and Kennedy and Ruggles both find a real rise. Kennedy and Ruggles test an ACS over-count of 15% and still find “a sizable increase in age-standardized divorce,” and they report that divorce rates doubled over two decades among people over 35.
The safer reading is that gray divorce rose a great deal, while the exact multiple depends on the instruments being compared. A court-record baseline and a survey-question endpoint can both be useful, but the join between them should be visible to readers.
For our like-for-like series, we keep the instrument fixed. We use the ACS alone, one question, every year from 2008 to 2024. The Census Bureau released 2020 only as experimental data, so 2020 is left out.
On that consistent instrument, the gray divorce rate for adults 50 and older was 11.2 per 1,000 married in 2008 and 10.1 in 2024. It has not risen since 2008. It stayed between 10.1 and 11.2 through 2019, dipped to 9.6 in 2021, and was back to 10.1 by 2024.
| Year | Age 50+ | Age 50 to 64 | Age 65+ |
| 2008 | 11.2 | 14.2 | 5.7 |
| 2010 | 10.6 | 13.7 | 5.1 |
| 2012 | 11.2 | 14.4 | 6.0 |
| 2014 | 10.5 | 13.5 | 5.7 |
| 2016 | 10.7 | 14.1 | 5.8 |
| 2018 | 10.4 | 13.7 | 5.9 |
| 2019 | 10.1 | 13.3 | 5.9 |
| 2021 | 9.6 | 12.6 | 5.8 |
| 2022 | 9.8 | 13.0 | 5.9 |
| 2023 | 10.0 | 13.2 | 6.2 |
| 2024 | 10.1 | 13.5 | 6.1 |
The age split shows why the 50 and older category needs care. Ages 50 to 64 were at 14.2 in 2008 and 13.5 in 2024. Ages 65 and older were at 5.7 in 2008 and 6.1 in 2024, making them the only gray group above its 2008 level.
That pattern matches Brown and Lin’s 2022 finding that adults 65 and older are the only age group whose divorce rate is still increasing. The younger gray-divorce ages have not followed the same path in the ACS series since 2008.
So the rise that made headlines happened before 2008, in the years covered by the mixed 1990 to 2010 comparison. Since then, the rate has been flat to lower on the ACS measure. What has grown since is the share of all divorces that occur at 50+, which is covered above.
Brown, Lin and Julian, in their 2024 paper, found that the gray divorce rate dropped after the pandemic began, more for middle-aged than older adults, and “For older adults, the divorce rate essentially stalled.” That is close to what the annual ACS line shows after 2021.
Our series closely tracks the National Center for Family and Marriage Research’s published figures for 2023, running 0.1 to 0.4 per 1,000 higher, as described in the methodology section.
Gray Divorce Rates by State
Gray divorce rates vary widely by state, even when the same age group and the same rate definition are used. The state view is useful because older married adults are not spread evenly across the country, and the age mix of a state can change how its divorce profile looks.
These figures come from the 2020 to 2024 five-year file of the American Community Survey, which pools five years so smaller states have enough cases. Nationally, the five-year gray divorce rate is 9.8 per 1,000 married adults 50 and older.
The table below compares each state on the same footing. It lists rank, state, gray divorce rate (50+), divorce rate under 50, and the share of the state’s divorces that are 50+.
Read the rankings with the sample rule in mind. States are ranked only if the sample holds at least 100 people aged 50 or older who divorced. Six fall short and are shown unranked: District of Columbia (59), Alaska (63), South Dakota (66), Wyoming (68), Vermont (68), and North Dakota (87). DC’s rate, 18.7, comes from 59 cases and should not be read as the highest in the country.
| Rank | State | Gray divorce rate, 50+ | Divorce rate, under 50 | Share of divorces at 50+ |
| 1 | Arkansas | 13.5 | 28.5 | 34.7% |
| 2 | Nevada | 13.1 | 24.0 | 39.2% |
| 3 | Kentucky | 12.8 | 24.1 | 38.3% |
| 4 | Mississippi | 12.2 | 26.5 | 36.2% |
| 5 | Oklahoma | 11.6 | 24.5 | 32.6% |
| 6 | Georgia | 11.6 | 21.2 | 37.7% |
| 7 | Maryland | 11.4 | 18.9 | 43.0% |
| 8 | Louisiana | 11.2 | 21.5 | 39.0% |
| 9 | Alabama | 11.1 | 29.4 | 32.1% |
| 10 | Delaware | 10.9 | 25.1 | 40.9% |
| 11 | New Mexico | 10.7 | 23.7 | 37.6% |
| 12 | Florida | 10.6 | 21.4 | 42.6% |
| 13 | Texas | 10.6 | 19.2 | 34.0% |
| 14 | North Carolina | 10.5 | 19.7 | 39.6% |
| 15 | Virginia | 10.5 | 17.9 | 40.7% |
| 16 | Tennessee | 10.3 | 25.7 | 31.5% |
| 17 | Idaho | 10.2 | 17.7 | 38.2% |
| 18 | Indiana | 10.2 | 23.7 | 33.0% |
| 19 | Oregon | 10.2 | 23.9 | 34.0% |
| 20 | Montana | 10.2 | 19.7 | 40.3% |
| 21 | New York | 10.0 | 15.4 | 46.4% |
| 22 | Rhode Island | 9.9 | 17.1 | 45.2% |
| 23 | West Virginia | 9.6 | 28.3 | 33.0% |
| 24 | California | 9.6 | 15.3 | 41.9% |
| 25 | Colorado | 9.5 | 20.1 | 32.2% |
| 26 | Missouri | 9.5 | 22.9 | 33.0% |
| 27 | Arizona | 9.5 | 20.9 | 37.0% |
| 28 | New Hampshire | 9.4 | 21.1 | 41.3% |
| 29 | Ohio | 9.2 | 20.0 | 37.3% |
| 30 | New Jersey | 9.1 | 13.7 | 46.1% |
| 31 | Massachusetts | 9.0 | 15.1 | 44.7% |
| 32 | Connecticut | 9.0 | 14.6 | 47.0% |
| 33 | Washington | 8.9 | 18.5 | 33.8% |
| 34 | Hawaii | 8.7 | 14.3 | 44.8% |
| 35 | Michigan | 8.6 | 18.2 | 39.6% |
| 36 | Pennsylvania | 8.6 | 18.3 | 40.0% |
| 37 | South Carolina | 8.6 | 19.1 | 37.8% |
| 38 | Wisconsin | 8.4 | 17.5 | 40.1% |
| 39 | Illinois | 8.3 | 17.2 | 37.5% |
| 40 | Maine | 8.2 | 20.7 | 38.5% |
| 41 | Utah | 8.1 | 19.7 | 23.2% |
| 42 | Iowa | 7.8 | 19.3 | 34.1% |
| 43 | Minnesota | 7.1 | 18.8 | 31.6% |
| 44 | Nebraska | 7.0 | 20.9 | 27.0% |
| 45 | Kansas | 6.9 | 19.5 | 28.1% |
| Not ranked | Alaska (63 sampled divorces) | 9.2 | 24.3 | 25.8% |
| Not ranked | District of Columbia (59 sampled divorces) | 18.7 | 10.9 | 53.5% |
| Not ranked | North Dakota (87 sampled divorces) | 10.7 | 15.4 | 41.8% |
| Not ranked | South Dakota (66 sampled divorces) | 6.2 | 22.0 | 25.4% |
| Not ranked | Vermont (68 sampled divorces) | 6.8 | 18.5 | 37.1% |
| Not ranked | Wyoming (68 sampled divorces) | 11.1 | 20.7 | 38.3% |
Rates are divorces in the past 12 months per 1,000 people married during the year, from the 2020 to 2024 American Community Survey five-year file. States with fewer than 100 sampled divorces at 50 or older are listed at the end without a rank.
Among ranked states, Arkansas has the highest gray divorce rate at 13.5 per 1,000 married adults 50 and older. Nevada follows at 13.1, then Kentucky at 12.8, Mississippi at 12.2, Oklahoma at 11.6, and Georgia at 11.6.
The lowest ranked states are clustered well below the national five-year gray divorce rate of 9.8. Kansas is lowest at 6.9, followed by Nebraska at 7.0, Minnesota at 7.1, Iowa at 7.8, Utah at 8.1, and Maine at 8.2. The highest ranked state is about double the lowest.
A state’s gray divorce rate measures divorces among married adults 50 and older, so it is a direct rate for that age group. A state’s gray share measures how much of all divorce in the state involves someone 50 or older, so it also depends on divorce levels under 50 and on the age structure of the married population.
That difference is clear in the Northeast pattern. New Jersey’s divorce rate for adults under 50 is 13.7, the lowest of any state, and its gray rate is an ordinary 9.1. Because younger-adult divorce is so low there, 46.1% of New Jersey’s divorces involve someone 50 or older. Connecticut, at 47.0%, and New York, at 46.4%, look the same.
At the other end of the share column, Utah has the smallest gray share at 23.2%. Nebraska follows at 27.0%, and Kansas follows at 28.1%.
The state table is best read as two related views of late-life divorce. The rate column shows where divorce after 50 is more or less common among married older adults. The share column shows how much older adults account for the divorce caseload within a state.
For every age group together, our divorce rate by state analysis ranks each state on two separate measures.
How Long Those Marriages Lasted
Length of marriage changes the meaning of gray divorce. For people who divorced at 50 or older, the typical first marriage had lasted 28 years, using duration measured as the survey year minus the year they married.
Our analysis of Census data finds that 55.8% of people divorcing at 50 or older were ending a first marriage, 29.7% a second marriage, and 14.5% a third or later marriage. The duration profile is different for those groups, so first marriages and remarriages need to be read separately.
Among first marriages, the median duration was 28 years. A quarter had lasted 22 years or less, and a quarter had lasted 37 years or more. The National Center for Family and Marriage Research found a median of 29 years for first marriages in its 2022 analysis, with the same 22 and 37 quartiles.
The long-marriage share is large among first-marriage gray divorces. 46.4% had lasted 30 years or more, and 19.6% had lasted 40 years or more. In this part of the data, divorce after 30 years of marriage describes nearly half of first-marriage gray divorces.
Short first marriages are a much smaller part of the pattern. 4.4% of first marriages ending in gray divorce had lasted five years or less. The duration numbers point much more toward long marriages than recent unions.
Remarriages were shorter in the same age range. The median remarriage ending in gray divorce had lasted 17 years, and the middle half ran from 8 to 26 years. 13.9% had lasted five years or less.
The table shows how wide the gap is. The first-marriage distribution sits at a longer duration at every percentile shown, while remarriages have a larger short-duration share.
| Measure | First marriage | Remarriage |
| 25th percentile | 22 years | 8 years |
| Median | 28 years | 17 years |
| 75th percentile | 37 years | 26 years |
| Lasted 30+ years | 46.4% | 18.3% |
| Lasted five years or less | 4.4% | 13.9% |
These differences matter because the phrase gray divorce can cover marriages with very different histories. A person ending a first marriage after 37 years or more is in the same age-defined category as a person ending a remarriage after five years or less. The age threshold is the same, but the marital timeline can be very different.
How long marriages last in general, including the ones still going, is covered in our analysis of average marriage length.
Who Divorces After 50
Gray divorce is not spread evenly across older married adults.
Remarriage is the clearest dividing line in the 2024 data. Adults age 50 and older in a first marriage divorced at a rate of 8.1 per 1,000 married adults, while those in a remarriage divorced at 14.7 per 1,000. That remarriage rate was about 1.8 times as high. In 2010, Brown and Lin found the remarriage rate 2.5 times as high.
Education also separates older divorce rates. Among married adults age 50 and older, the rate was 14.3 per 1,000 for people with no high school diploma, 10.5 for people with a high school diploma or GED, 11.0 for people with some college or an associate degree, and 8.1 for people with a bachelor’s degree or more.
| Group | Divorces per 1,000 married, age 50+ |
| First marriage | 8.1 |
| Remarriage | 14.7 |
| No diploma | 14.3 |
| High school or GED | 10.5 |
| Some college | 11.0 |
| Bachelor’s or more | 8.1 |
| Men | 9.7 |
| Women | 10.4 |
Sex differences were smaller than the remarriage and education gaps. In 2024, married men age 50 and older divorced at 9.7 per 1,000, while married women did so at 10.4 per 1,000. Women were 48.9% of people divorcing at 50 or older, so the rate comparison and the share of divorces describe different parts of the same pattern.
Repeated gray divorce is visible in longitudinal data. An NCFMR analysis of the Health and Retirement Study from 1998 to 2018 found that, among people who had a gray divorce, 8.5% of men and 6.5% of women had two or more. That measure follows people over time, while the Census rate captures divorces reported in a single past 12 month window.
A small share of older adults who divorced also remarried quickly. In 2024, 3.4% of people who divorced at 50 or older had also remarried within the same year. This does not explain why the divorce occurred, but it shows that divorce and remarriage can appear in the same annual record.
The profile of gray divorce is therefore most sharply tied to marriage order, with education also sorting risk. Men and women have close rates, and a small share experience more than one gray divorce.
Empty Nest and Retirement Are Not the Trigger
Empty nest is a common story in gray divorce coverage. In our analysis, of the 26 top-ranking pages on gray divorce we downloaded and read, 8 present empty nest syndrome as a cause or trigger of gray divorce. Several also name retirement.
The research record is more cautious. Lin, Brown, Wright and Hammersmith tested those turning points directly in a 2018 study in The Journals of Gerontology. The study followed married couples in the Health and Retirement Study from 1998 to 2012.
The authors wrote, “Contrary to our expectations, the onset of an empty nest, the wife’s or husband’s retirement, and the wife’s or husband’s chronic conditions were unrelated to the likelihood of gray divorce.” That sentence matters because it addresses the exact explanation that often appears in public summaries of gray divorce.
Brown and Lin’s own 2022 review points in the same direction. It notes that more recent work found no evidence for the empty nest or retirement explanation.
That does not mean an empty nest never matters inside a particular marriage. The finding is narrower and stronger: these events did not predict gray divorce at the population level in the research cited here.
The same study found a different pattern. “Marital duration, marital quality, home ownership, and wealth were negatively related to the risk of gray divorce.” The authors conclude that gray divorce “is especially likely to occur among couples who are socially and economically disadvantaged”.
Our education gradient points in the same direction. The divorce rate after 50 is 14.3 per 1,000 without a diploma against 8.1 with a bachelor’s degree. That gap fits the study’s finding that gray divorce is more likely among economically disadvantaged couples.
The distinction is important for how gray divorce is described. Empty nest and retirement are easy explanations to repeat. The evidence summarized here found no population-level link between either one and divorce after 50.
The Money After a Gray Divorce
Money after a gray divorce often looks different for women and men. The best before-and-after evidence in this section comes from Lin and Brown. Their 2021 study followed people in the Health and Retirement Study through a gray divorce and found that women experienced a 45% decline in their standard of living, measured by an income-to-needs ratio, whereas men’s dropped by just 21%. Wealth fell by roughly half for both. Repartnering offset most of women’s losses, but few repartner.
Our analysis of Census data gives a separate, current snapshot. It compares people 50+ who divorced in the past year with people 50+ who were married in 2024. The result is a clear split on poverty, near-poverty, homeownership, and moving. Recently divorced adults were much more likely to be below the poverty line, less likely to own their home, and more likely to have moved in the past year.
| Measure | Divorced past year, women | Married women | Divorced past year, men | Married men |
| Below poverty | 19.4% | 5.1% | 15.9% | 4.8% |
| Under twice the poverty line | 38.0% | 14.1% | 28.9% | 13.9% |
| Owns home | 62.2% | 88.5% | 60.7% | 87.7% |
| Moved in past year | 19.1% | 4.5% | 19.1% | 4.8% |
The poverty gap is wide for both sexes. Among women 50+ who divorced in the past year, 19.4% were below poverty, compared with 5.1% of married women. Among men, the figures were 15.9% and 4.8%. The same pattern appears under twice the poverty line, where 38.0% of recently divorced women and 28.9% of recently divorced men fell below that threshold, compared with 14.1% of married women and 13.9% of married men.
Housing shows the same strain in another form. Homeownership was 62.2% for women who divorced in the past year, compared with 88.5% for married women. For men, it was 60.7% compared with 87.7%. Moving was also far more common after divorce. Among recently divorced women and men, 19.1% had moved in the past year. The married comparison groups were 4.5% for women and 4.8% for men.
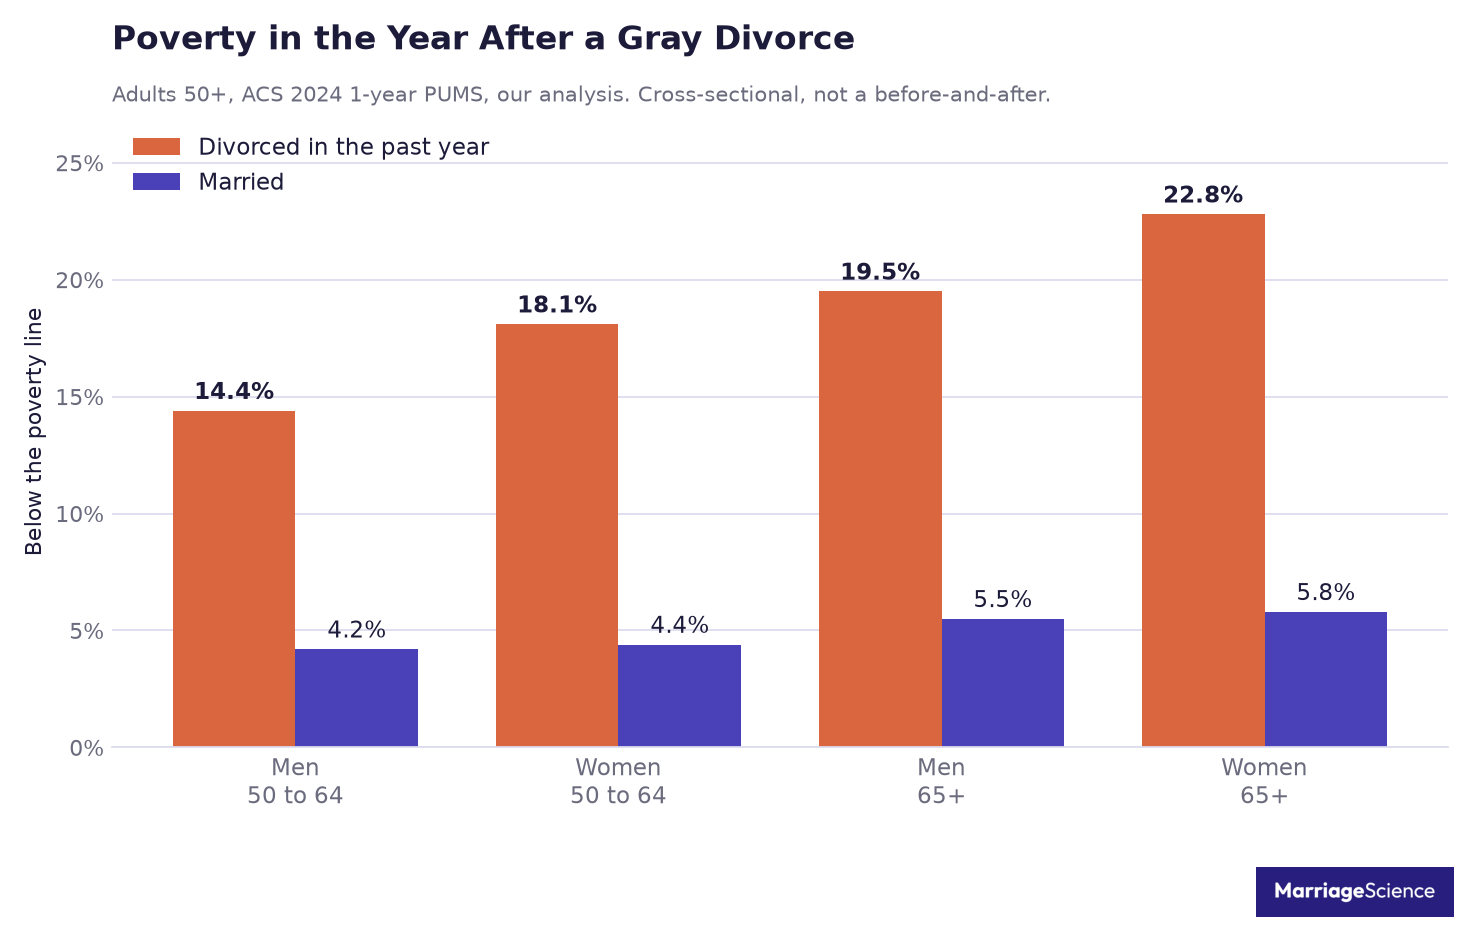
Age mix does not explain the poverty difference. The gray-divorced group is younger, with a median age of 59, while married peers have a median age of 63 to 64. We repeated the poverty comparison inside age bands, and the pattern holds. At ages 50 to 64, poverty was 14.4% for recently divorced men compared with 4.2% for married men, and 18.1% for recently divorced women compared with 4.4% for married women. At 65 and older, it was 19.5% versus 5.5% for men and 22.8% versus 5.8% for women.
These Census figures are a snapshot of who people are in the year after divorce, not a before-and-after record of the same people. Some were already poorer before they divorced, since the 2018 study found disadvantaged couples divorce more. That caveat matters because the table should not be read as the full financial effect of divorce by itself. The 45% and 21% declines are the before-and-after measure.
Living Alone After 50
Living alone is one of the clearest household changes after gray divorce. In our analysis, 43.0% of people who divorced at 50 or older lived alone in the year after the divorce, against 1.4% of married peers. The share was higher for men than for women, at 46.4% for men and 39.6% for women.
The pattern was even more concentrated among older divorced adults. Among those 65 and older, 55.4% of men and 53.8% of women lived alone after divorce. That means living alone was the majority arrangement for both men and women in this older group, even though the overall post-divorce figure was lower across everyone 50 or older.
The Health and Retirement Study (Lin, Brown and colleagues, 2023, 1,057 people) reported a similar split in living arrangements after gray divorce. About half lived alone upon gray divorce, one third lived with others, and 14% lived with a new partner. Remarriage within the same year was uncommon in our analysis, with 3.4% remarried within the same year.
Living alone and feeling alone are different things, and the research on the second is collected in our loneliness statistics.
The AARP Study Everyone Cites
AARP published The Divorce Experience: A Study of Divorce at Midlife and Beyond in May 2004. It was a web-panel survey run by Knowledge Networks, and it became one of the best-known early sources on divorce in midlife and later life.
The study is often cited because it asked divorced adults to look back on who initiated the split, what led to it, and how life changed afterward.
The sample was specific: 1,147 respondents, 581 men and 566 women ages 40 to 79 who were divorced at least once during their 40s, 50s, or 60s. That detail matters because the report covered people who divorced between 40 and 69.
The age mix also matters. The majority, about 73 percent, divorced in their 40s. About one in five (22%) divorced in their 50s, while 4 percent divorced in their 60s or older.
By that reading, about 26% of the sample went through what is now called a gray divorce. Most respondents, though, divorced before age 50, so the report should not be treated as a pure study of divorce after 50.
Its most quoted finding is about initiation. Among women, 66 percent report that they asked for the divorce, while only 41 percent of men say they did. That sentence is easy to overread.
Those figures are each sex describing its own divorce. Neither is a share of all divorces, and they come mostly from people who divorced in their 40s. The numbers are still useful, but they should be used with that frame attached.
Several ranking pages credit the report with coining or popularizing the term gray divorce. The 153-page report does not use the word gray or grey anywhere. It discusses midlife divorce without using the label.
The report is still good for a detailed early portrait of midlife divorce. It should be cited as an AARP study of adults who divorced in their 40s, 50s, or 60s, with most of the sample coming from the youngest part of that range.
Who asks for the divorce at any age, and where the famous two-thirds figure comes from, is the subject of our analysis of who initiates divorce.
Methodology and Sources
Our analysis uses the American Community Survey Public Use Microdata Sample, accessed through the Census Bureau API. The main national file is the 2024 one-year file, with 2,912,790 person records aged 15 and older, and the state file is the 2020 to 2024 five-year file, with 13,625,218 records.
Trend years come from the 2008 to 2023 one-year files, with 2020 excluded. The divorce rate is people who divorced in the past 12 months per 1,000 people who were married or divorced during the year, the convention used by the National Center for Family and Marriage Research.
Before extending the series, we checked our 2023 rates against NCFMR’s published 2023 rates. Our rates were 14.1 for all ages, 11.8 for 55 to 64, and 6.2 for 65+, compared with NCFMR’s 13.7, 11.4, and 6.1.
Our series runs slightly higher, by 0.1 to 0.4 per 1,000, most likely because of small differences in how the married population is defined. The ranking of age groups is the same.
We also checked the results against published gray divorce research. Our 2019 share of divorces at 50+, 36.0%, matches the 36% Brown and Lin published for 2019. For marriage duration at first gray divorce, NCFMR’s 2022 median is 29 years, compared with 28 in our 2024 file.
State estimates use the 2020 to 2024 five-year file. We ranked states only when the sample included 100 or more divorces at 50+, which reduces the chance that very small cell counts shape the list.
Poverty and living arrangement comparisons use the 2024 one-year file. The comparison group is people 50+ who divorced in the past year, with 8,020 records, against married people 50+, with 911,482 records. We repeated those comparisons inside age bands, so differences at older ages were not mixed with differences at younger ages.
We left out several figures that circulate online. We did not use the $400,000 gray divorce mistake figure from a financial planner’s page because it is an anecdote. We also left out cause-of-divorce percentages from law-firm pages because none trace to a survey with a published sample.
We did not report employment after divorce as a snapshot statistic. In this age range, employment is driven heavily by age, so a single current-status comparison can mislead.
- American Community Survey PUMS 2008 to 2024
- Brown and Lin 2012
- Brown and Lin 2022
- Brown, Lin and Julian 2024
- Kennedy and Ruggles 2014
- Lin, Brown, Wright and Hammersmith 2018
- Lin and Brown 2021
- Lin, Brown and colleagues 2023
- NCFMR Family Profiles FP-24-12, FP-24-22, FP-25-24
- AARP, The Divorce Experience, 2004



