


Women want or file for about 69% of divorces in the United States. That is the direct answer. The twist is that the American figure comes from one study, and the best court-record evidence shows the female share has been falling for decades where filing data can be checked case by case.
The 69% estimate rests on 92 marital breakups in a single survey panel. Its 95% confidence interval runs from 61% to 78%, which means the study points to a clear female majority, while leaving real uncertainty around the exact share.
England and Wales publishes a complete court record of who applied, going back to 1858, and it tells a longer story. The female share peaked at 72.3% in 1992 and fell to 63.3% in 2023. That decline is the part most search results miss.
This article reads the actual court records, corrects a false statistic that Google’s own AI summary is currently repeating, and reports our own analysis of Census microdata on what happens to men and women in the year after a divorce. The answer is still that women initiate most divorces, but the cleaner record says the gap is smaller than it used to be.
Key Statistics on Who Initiates Divorce
The best known modern estimate is simple: women initiate a clear majority of heterosexual marital breakups. The historical and administrative data below add scale, time, legal grounds, and post-divorce household context.
- Women accounted for 69% of the breakups of heterosexual marriages (Rosenfeld, 2018).
- That estimate is based on 92 marital breakups, with a 95% confidence interval of 61% to 78% (Rosenfeld, 2018).
- The panel behind it followed 2,262 couples from 2009 to 2015 and recorded 371 breakups in total (Rosenfeld, 2018).
- Among cohabiting couples, the woman wanted the breakup 56% of the time, and the confidence interval, 47% to 65%, includes parity (Rosenfeld, 2018).
- In a 1940s Detroit sample, 264 of 425 divorces were initiated by the wife, 105 by the husband and 56 mutually (Goode, 1956).
- In England and Wales, women filed 40.8% of divorce petitions in 1900 (ONS, 2023 dataset).
- The female share of sole divorce applications in England and Wales peaked at 72.3% in 1992 (our calculation from ONS counts).
- By 2023, the female share of sole divorce applications in England and Wales had fallen to 63.3%, a drop of 9.0 percentage points (our calculation from ONS counts).
- In 2023, 19,743 of 100,787 divorces in England and Wales were joint applications, 19.6% of the total (ONS, 2023).
- In 1979, male petitioners cited adultery in 40.7% of cases and female petitioners in 24.1% (our calculation from ONS Table 4a).
- By 2015, adultery had converged to 11.7% for men and 12.3% for women (our calculation from ONS Table 4a).
- Among Americans who divorced in the past 12 months, 18.3% of women and 12.6% of men were below the poverty line (our analysis, ACS 2024 1-year PUMS).
- 41.8% of recently divorced women who head their own household live with a child under 18, against 23.7% of men (our analysis, ACS 2024 1-year PUMS).
- Men and women moved house at almost the same rate after divorce, 25.4% against 24.6% (our analysis, ACS 2024 1-year PUMS).
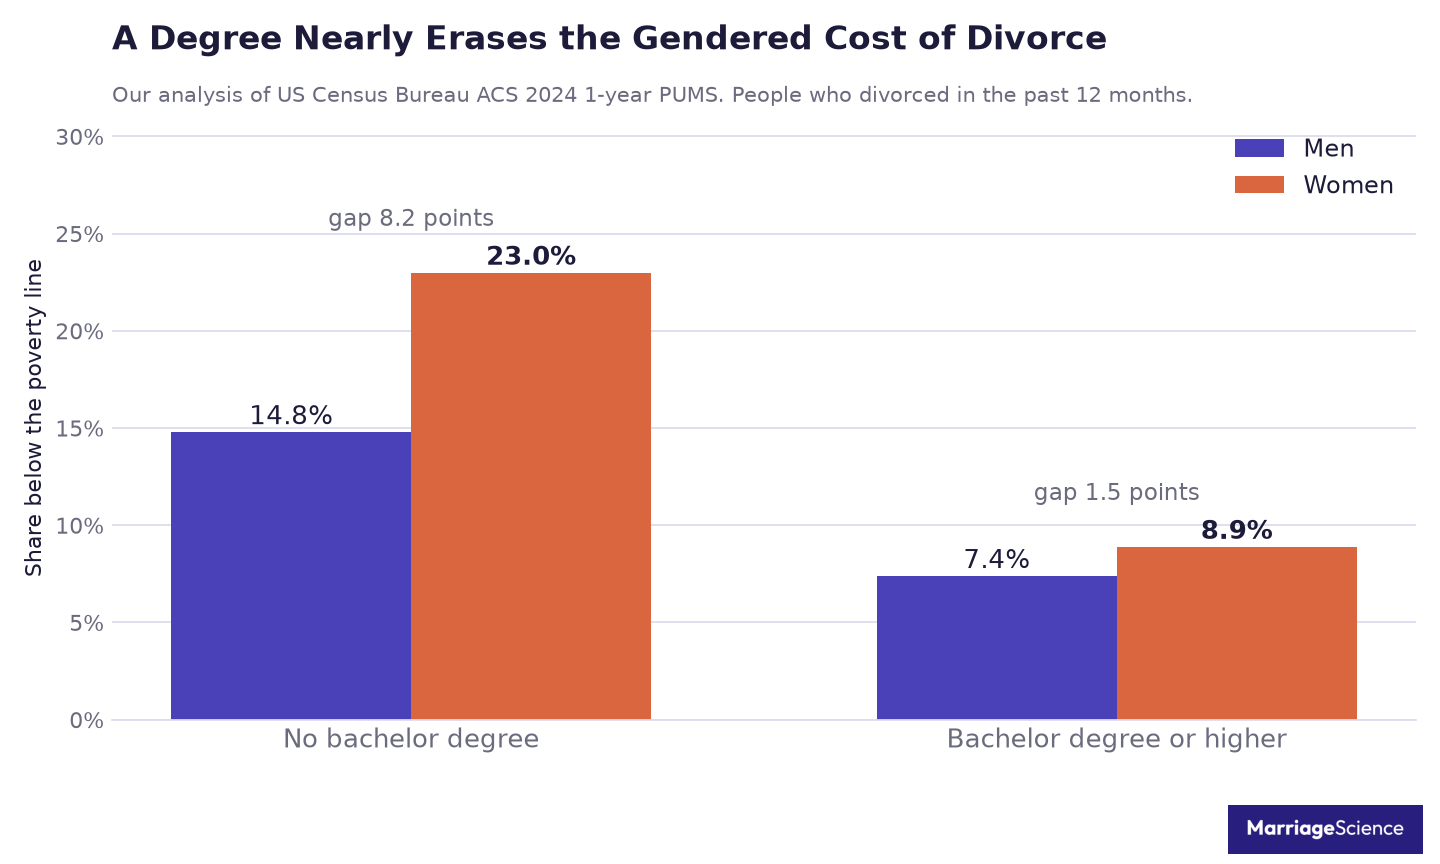
- Among divorcees with a bachelor degree, the poverty gap between women and men narrows to 1.5 percentage points, against 8.2 points for those without one (our analysis, ACS 2024 1-year PUMS).
The Short Answer, and the 92 Breakups Behind It
The 69% figure comes from Michael J. Rosenfeld, a Stanford sociologist, in “Who wants the Breakup? Gender and Breakup in Heterosexual Couples”. The paper was published as a chapter in Social Networks and the Life Course, Springer, 2018, pages 221 to 243.
Rosenfeld used the How Couples Meet and Stay Together survey, from waves 1 in 2009 through wave 5 in 2015. The survey followed 2,262 couples and recorded 95,006 couple-months of exposure to the risk of breakup. Across that period, it recorded 371 breakups.
The thin part is the divorce base. Of the 371 breakups, 92 were marital breakups. Women accounted for 69% of those marital breakups, using Rosenfeld’s scoring rule for who wanted the breakup more.
That rule matters. If the woman wanted the breakup more, the case scored 1 for female initiation. If the man wanted it more, it scored 0. If both partners wanted it equally, it scored 0.5. The study measured reported desire for the breakup. A name on a court filing is a different thing.
That is why the number is both useful and less exact than it often sounds. Rosenfeld reported a 95% confidence interval of 61% to 78%, and the result was significantly different from 50%. He also found that 19% of marital breakups were wanted equally by both partners.
The count of divorces is not the uncertain part. Our divorce statistics for 2026 cover how many American marriages end each year. What rests on 92 cases is the split between who wanted it.
The finding reached the public before the chapter appeared. An ASA conference press release dated 22 August 2015 said, “Rosenfeld found that women initiated 69 percent of all divorces, compared to 31 percent for men.” Nearly every page repeating the number cites that press release.
Rosenfeld also documents ego bias in breakup reports. When people are asked afterward, they tend to magnify their own agency in a breakup. Male and female respondents can therefore give different answers about the same kind of event, which is another reason to read the 69% figure as an estimate.
The estimate still has a strong historical echo. In William J. Goode’s After Divorce, published in 1956, page 144 reported 105 divorces initiated by the husband, 264 by the wife and 56 mutually among recently divorced women in Detroit. Counting mutual cases as half female gives 69%.
Two studies about 60 years apart landed on the same number. That does not make either sample large. It does make the estimate credible, while reminding readers that the famous 69% rests in Rosenfeld’s modern data on 92 marital breakups.
| Metric | Value | Source |
| Marital breakups analyzed | 92 | Rosenfeld, 2018 |
| Share wanted more by the wife | 69% | Rosenfeld, 2018 |
| 95% confidence interval | 61% to 78% | Rosenfeld, 2018 |
| Wanted equally by both | 19% | Rosenfeld, 2018 |
| Couples followed, 2009 to 2015 | 2,262 | Rosenfeld, 2018 |
| All breakups recorded | 371 | Rosenfeld, 2018 |
| Wife-initiated divorces, 1940s Detroit | 264 of 425 | Goode, 1956 |
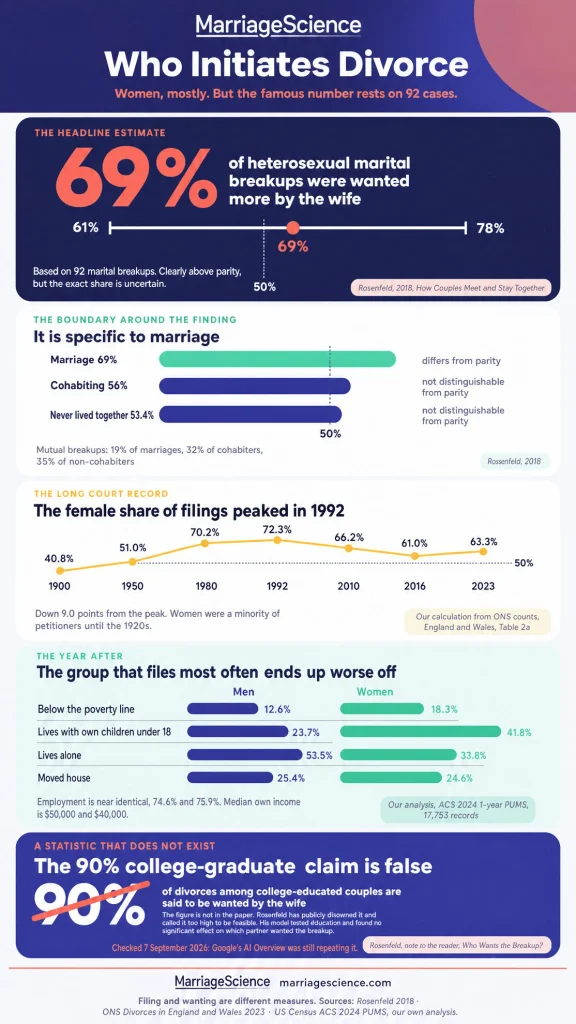
The 90% Claim About College Graduates Is False
A statistic now circulates in articles, social posts, and search summaries: that 90% of divorces among college-educated couples are wanted by the wife.
It is usually attributed to Michael J. Rosenfeld or to research presented by the American Sociological Association. The attribution gives the number a scholarly look, but the number is not in the paper.
Somewhere along the way, an erroneous claim started getting repeated in popular commentary: that 90% of divorces among college educated people were wanted by the wife. This 90% college women’s divorce preference is definitely Not in the data, not in the paper, and is in my view too high to be feasible. So, if you see that erroneous claim, know that it is wrong and alert me: some folks have been good enough to fix and correct this error when they were alerted to it.
Michael J. Rosenfeld, note to the reader, Who wants the Breakup?
That note appears on the front page of Rosenfeld’s own paper, which makes this correction unusually direct. The original author publicly disowned the number and said it was too high to be feasible. That leaves little room for treating the claim as a disputed reading of the same result.
The American Sociological Association press release does not contain the claim either. We read the full text. It discusses Rosenfeld’s finding about women more often wanting divorce in different-sex marriages, but it does not say that the share rises to 90% among college-educated couples.
The paper did address education. Rosenfeld’s Model 3 included the female partner’s education and the education gap between partners as controls. Neither had a significant effect on which partner wanted the breakup, so the education claim is not a mild overstatement of a real result. The paper tested education and found nothing.
This matters because the error has moved into the answer layer of search. We checked Google’s AI Overview on 7 September 2026 for the queries what percentage of divorces are initiated by women and who files for divorce more. Both summaries stated that the figure climbs to about 90% when the woman is college-educated, and both credited research presented by the American Sociological Association.
An AI summary now sits above the results for these queries, and it is repeating an error that the original author has publicly disowned. For a statistic about who initiates divorce, that is a serious sourcing problem. The safest correction is also the plainest one: the 90% college-graduate claim is false.
Women Have Not Always Been the Ones Filing
England and Wales give an unusually long court record for this question. The Office for National Statistics divorce dataset publishes every divorce granted in England and Wales, with the sex of the applicant, in one file that runs from 1858 to 2023. These are court records. Every case appears in them, because no divorce is granted without one.
ONS publishes the counts. The percentages below are ours, computed from those counts, so every female share on this page is a MarriageScience calculation from the official applicant totals.
Using applicant sex lets us ask a narrower question than how marriages end. It asks who went to court as the named applicant in each granted divorce. That is a legal record of initiation, and it can be tracked across a very long run of cases.
The oldest rows need care. Divorce in England and Wales before the Matrimonial Causes Act 1923 was not equally available to both spouses, so the ability to petition was itself gendered. Those early applicant totals are shaped by law as much as marital preference.
In 1900, court records show 303 male applicants and 209 female applicants. That made women 40.8% of petitioners, a minority. By 1930, the pattern had changed: 1,520 male applicants and 2,043 female applicants, making women 57.3% of petitioners.
| Year | Female share of sole applications | Male and female applicant counts |
| 1900 | 40.8% | 303 male, 209 female |
| 1930 | 57.3% | 1,520 male, 2,043 female |
| 1950 | 51.0% | 15,138 male, 15,732 female |
| 1970 | 61.4% | not shown |
| 1980 | 70.2% | 44,034 male, 103,796 female |
The swing did not move in a straight line. The female share first passed half in the 1920s, fell back, and settled above half from 1949 on. In 1950, with 15,138 male applicants and 15,732 female applicants, women were 51.0% of petitioners.
That 1950 figure is close to even, and it sits after the point at which the female majority became the regular pattern. This is why a single modern percentage can be misleading without the older records. The long file shows both a change in who could bring cases and a later pattern in who did bring them.
The later rows show why the modern fact can feel older than it is. In 1970, women accounted for 61.4% of sole applications. In 1980, the ONS counts were 44,034 male applicants and 103,796 female applicants, putting the female share at 70.2%.
The honest reading is simple: women initiating most divorces is roughly a century old in these court records, but it is not a permanent feature of marriage.
The record starts with men as the larger applicant group, crosses into female-majority territory during the 1920s, and becomes steadily female-majority after 1949. That history frames the current question as a change over time instead of a fixed rule about wives and husbands.
Marriage itself moved over the same century. The average age at first marriage has risen sharply since the middle of the twentieth century, so the people petitioning in 1930 and the people petitioning today married at very different points in their lives.
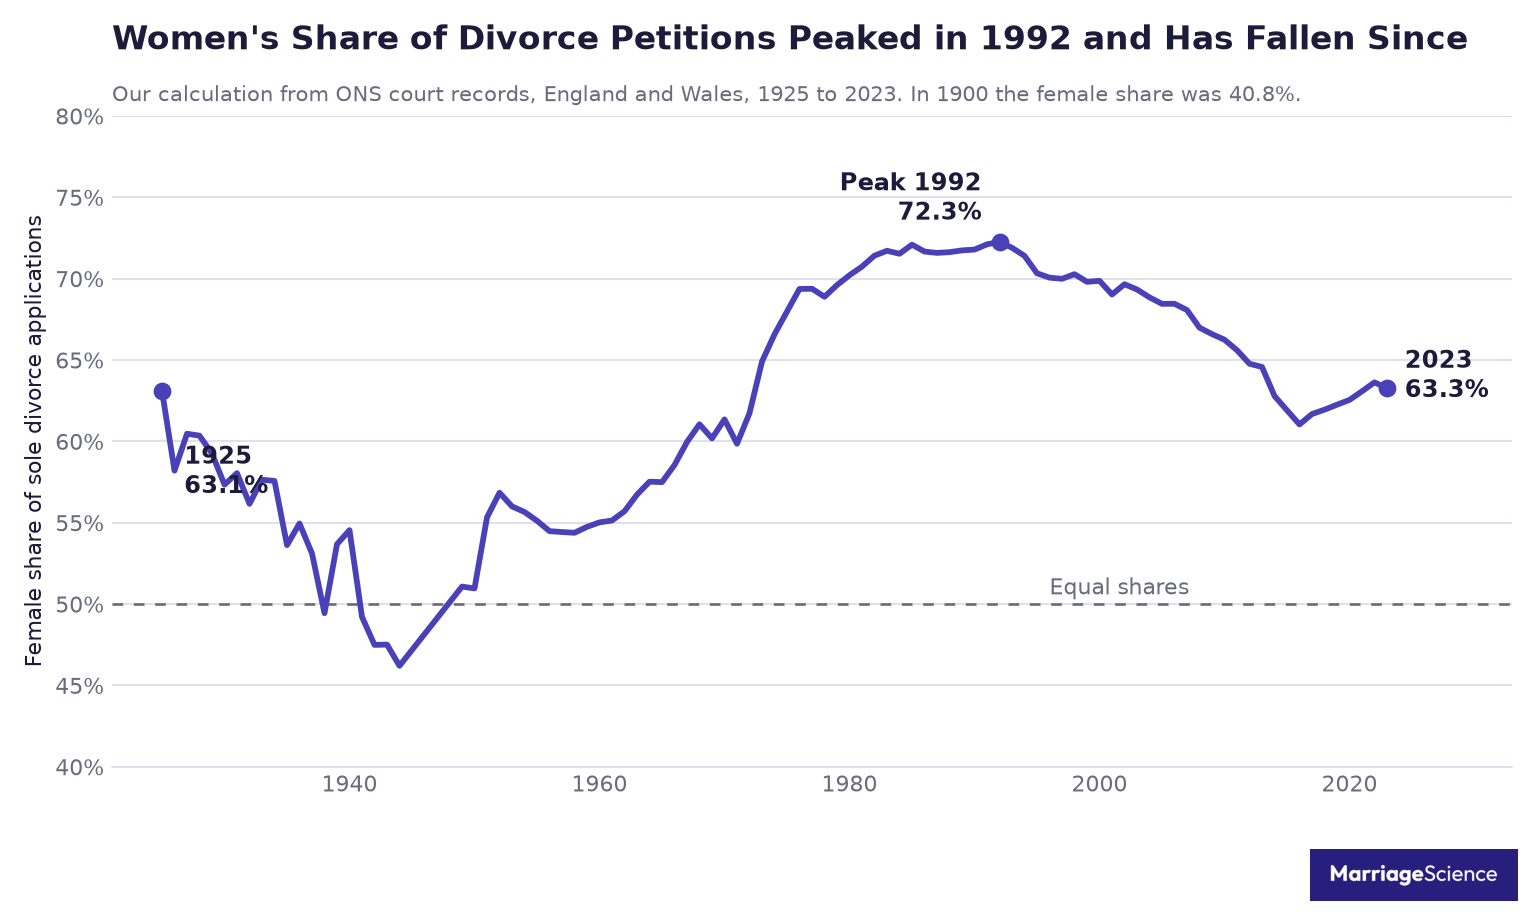
The common shorthand is that women file around 70% of the time. The England and Wales court record says something more specific. The female share of sole applications peaked in 1992 at 72.3%, then declined for decades before sitting at 63.3% in 2023.
The figures below are our calculations from ONS Table 2a counts. They track sole applications, so the denominator is female applicants plus male applicants. They do not include joint applications in the share.
It is a filing measure. It says nothing about desire, blame or relationship quality. That distinction matters when the figures are read as behavior.
| Year | Female share of sole applications | Female and male applicants |
| 1992 | 72.3% | 115,628 female applicants, 44,378 male |
| 2000 | 69.9% | not shown |
| 2010 | 66.2% | not shown |
| 2016 | 61.0% | not shown |
| 2021 | 63.1% | not shown |
| 2023 | 63.3% | 50,164 female applicants, 29,123 male |
From the 1992 peak to 2023, the female share fell by 9.0 percentage points. That change is large enough to matter because it cuts against the static version of the claim. The female share was 69.9% in 2000, 66.2% in 2010, and 61.0% in 2016, the modern low.
That pattern changes the interpretation of the headline. A current claim that women file around 70% of the time sounds stable, as if the same proportion has held across the record. The ONS counts point the other way: the female share has been lower than the 1992 peak in each comparison year shown here.
The decline was visible before the law changed. The 2016 low of 61.0% sits under the old law, so it does not depend on the April 2022 reform. The later figures still belong in the table, but 2022 and 2023 need care because joint applications appeared after the law changed in April 2022.
The movement in the share was not caused by more men filing. Male applicant counts went from 44,378 in 1992 to 29,123 in 2023. Female counts fell further, from 115,628 to 50,164, and total divorces fell as well.
That is the key arithmetic behind the falling share. When both male and female sole applications fall, the percentage can still move if either side falls faster. In this record, female petitions dropped faster than male petitions, so women remained the majority of applicants while their share became smaller.
This evidence has limits. It is England and Wales, not the United States. Filing is also a legal act, so the applicant named in the record is not always the spouse who first wanted the marriage to end.
Still, the series matters because few countries publish a complete case-by-case record of who starts the legal process, and none of them reaches back as far. It does not prove that women are becoming happier in marriage, or that men are becoming more likely to want divorce. It proves a narrower point: the measured female share of sole legal starts has moved, and it has moved down from its peak.
The same caution applies to any single headline figure. Divorce rates themselves vary widely by place, as our analysis of the divorce rate by state shows, and one national share can hide a great deal of variation underneath it.
A Fifth of English Divorces Now Have No Single Applicant
The cleanest answer to who files for divorce is getting less clean in England and Wales. The Divorce, Dissolution and Separation Act 2020 came into force in England and Wales in April 2022, introduced no-fault divorce, and allowed couples to apply jointly. That means some divorce records now start with two applicants instead of one.
In 2022, the new route was still small: 2,039 joint applications out of 78,759 divorces, or 2.6%. In 2023, it became a major category: 19,743 joint applications out of 100,787 divorces, or 19.6%. In its second full year the joint route accounted for nearly one divorce in five.
| Year | Joint applications | Share of all divorces |
| 2022 | 2,039 | 2.6% |
| 2023 | 19,743 | 19.6% |
That legal change matters for a statistics article about initiation because “who initiated” assumes there is one initiator. For a fifth of English divorces in 2023 the court record does not name one, by design. The filing is still an application to end a marriage, but the administrative label no longer assigns the first move to either spouse.
This does not mean every joint application reflects equal emotional timing, equal negotiation, or equal desire to divorce. Court data records the procedural route.
The private sequence of conversations that came before it leaves no trace. A couple may file together after one spouse first raised separation, after mediation, after a long mutual decision, or after practical discussions about cost and paperwork.
It does mean the usual filing statistic becomes a weaker proxy for marital initiative wherever joint applications are common.
Before joint filing, a petition had to sit under one name in the court data, even if the breakup had been discussed by both spouses for a long time. After the reform, part of that shared decision-making can appear directly in the application type.
The comparison with the United States has a hard limit. The United States has no equivalent national category, so no comparable American figure exists. State court systems may differ in their forms and labels, but there is no national series that matches the English joint-application line shown here.
For readers comparing countries, that gap is part of the finding. A national filing share can answer who is named first only when the legal system requires someone to be named first.
What Petitioners Actually Told the Court
The court file does not record a clean motive for divorce. For England and Wales, the ONS Table 4a data used here records the legal ground named by sole petitioners on a fault-based form. That makes the pattern useful, but only if it is read as paperwork shaped by law and procedure.
On adultery, the older gender split was real. In 1979, 40.7% of male sole petitioners cited adultery, compared with 24.1% of female sole petitioners. In the same data, a man who filed was about 1.7 times more likely than a woman who filed to cite adultery.
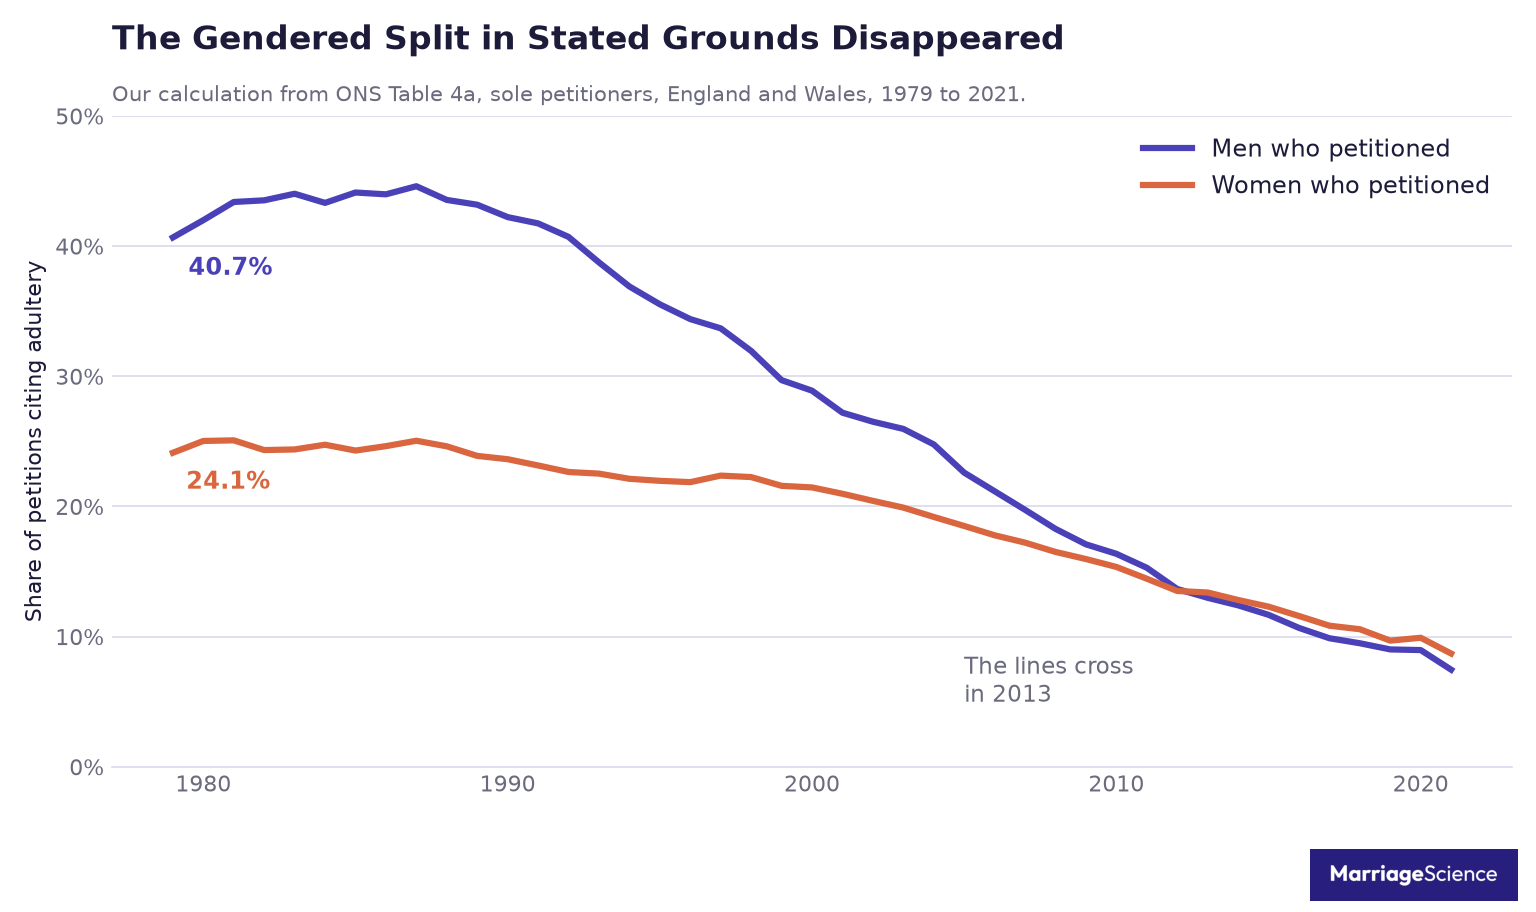
That split did not last. Male petitioners still cited adultery at 42.2% in 1990, while female petitioners were at 23.6%. After that, both shares moved down, and the male share fell faster.
| Year | Adultery, men | Adultery, women | Gap, percentage points |
| 1979 | 40.7% | 24.1% | Men +16.6 points |
| 1990 | 42.2% | 23.6% | Men +18.6 points |
| 2000 | 28.9% | 21.5% | Men +7.4 points |
| 2010 | 16.4% | 15.4% | Men +1.0 point |
| 2015 | 11.7% | 12.3% | Women +0.6 points |
| 2021 | 7.5% | 8.7% | Women +1.2 points |
By 2000, male petitioners cited adultery at 28.9%, and female petitioners cited it at 21.5%. By 2010, the figures were close, 16.4% for men and 15.4% for women. By 2015 women cited it slightly more often than men, 12.3% against 11.7%, and the same ordering appeared in 2021, at 8.7% for women and 7.5% for men.
Whether the ground named on the form matched what actually happened in the marriage is a separate question. On the underlying behavior, our review of who cheats more, men or women covers what the survey evidence supports.
Unreasonable behaviour tells the other side of the paperwork story. It is the legal term used on the English court form, which is why the British spelling stays. In 1979, it was cited by 8.7% of male sole petitioners and 40.9% of female sole petitioners. By 1990, the male share had risen to 21.8%, while the female share was 54.8%.
The later series kept the female share higher, but the old divide was less simple. In 2000, unreasonable behaviour was cited by 27.6% of male petitioners and 52.4% of female petitioners. In 2010, the figures were 36.0% and 54.6%. In 2015, they were 37.0% and 52.3%. In 2021, they were 34.8% and 48.1%.
The caveat matters. These are legal grounds selected on a form under a fault-based system. They were never meant to be a truthful account of why a marriage ended.
Couples could choose whichever ground let the divorce proceed fastest. A stated ground could reflect legal convenience, negotiation, advice, or the proof needed for the petition, along with any private facts behind the breakup.
Even with that limit, the trend is useful. It says something about how the law was used over more than 40 years. It also removes the evidential basis for a fixed claim that men and women file for different reasons. In the court paperwork, the old adultery gap narrowed, crossed over, and had largely stopped doing the work that older summaries still assign to it.
The Explanations the Data Rules Out
Rosenfeld’s analysis matters because it tested the explanations that usually sound most convincing in divorce commentary. The paper did not stop at asking which spouse wanted the breakup. Rosenfeld’s Model 3 controlled for the female partner’s age, the income gap between partners, the female partner’s education, the education gap, household income, the number of minor children, the respondent’s race, evangelical Christian identity for both partners, and relationship duration.
That list matters because it puts several familiar theories into the same model. If divorce initiation were mainly a simple story about who earns more, who has more schooling, who is younger, or who holds more bargaining power, those measures would be expected to move the result. They did not. None of the power-differential coefficients were significant. Higher female income had no significant effect on which partner wanted the breakup. The female partner’s age had no gendered effect.
Rosenfeld stated the point directly: “Neither women’s supposedly greater sensitivity to relationship problems, nor income gaps, nor education gaps, nor conservative religious identity, nor woman’s age, nor the presence of children explain why women are so much more likely than men to desire exit from heterosexual marriage”.
The finding is narrower than a universal theory of divorce. It says these measured differences did not explain the gender gap in who wanted out of marriage in his analysis.
The measure that did hold was relationship quality. Married women reported lower relationship quality than married men, while men and women in non-marital relationships reported similar levels. That pattern points away from a broad claim that women are simply more inclined to leave all romantic unions. The gender gap appeared inside marriage, and it was tied to how marriage felt to the spouses reporting on it.
Rosenfeld’s own reading, in the ASA release, was institutional. He said, “I think that marriage as an institution has been a little bit slow to catch up with expectations for gender equality.” The sentence does not claim that every wife has the same complaint. It places the gap inside the everyday organization of marriage, where expectations about fairness can clash with lived arrangements.
This also sharpens the contrast with an older economic explanation. Margaret F. Brinig and Douglas W. Allen, in “‘These Boots Are Made for Walking’: Why Most Divorce Filers Are Women“, American Law and Economics Review, 2000, argued that filing is rational behavior “based on spouses’ relative power in the marriage, their opportunities following divorce, and their anticipation of custody”. Their argument treated divorce filing as a strategic move shaped by bargaining position and expected outcomes after divorce.
Rosenfeld’s controls speak directly to part of that account. The income, education, age, household, religion, children, race, and duration controls tested the power and opportunity side, and the results did not support it.
Custody anticipation is different. His data could not test what spouses expected about custody if they filed, so that part of the Brinig and Allen argument remains outside this particular test.
Non-Marital Breakups Are Close to Even
The best-known headline about this research is that women initiate more divorces. The ASA release itself carried a more specific title: “Women More Likely Than Men to Initiate Divorces, But Not Non-Marital Breakups”. The back half of that sentence changes the interpretation. Rosenfeld was not describing a universal female tendency to end heterosexual relationships. He was describing a divorce pattern.
The contrast is clearest when the relationship types are placed side by side. Marriage is the outlier. Cohabiting relationships and relationships where the partners had never lived together sit much closer to an even split.
| Relationship type | Share of breakups wanted more by the woman | Whether it differs from parity |
| Marriage | 69% | Yes |
| Cohabiting | 56% | No |
| Never lived together | 53.4% | No |
Among cohabiting couples, 56% of breakups were wanted more by the woman. That estimate was based on 76 breakups, with a 95% confidence interval of 47% to 65%. Because that interval includes 50, the result is not distinguishable from parity.
Couples who had never lived together showed the same basic pattern. The share was 53.4%, also not distinguishable from parity. In plain terms, the unmarried results do not show the same female-initiated breakup gap found in divorce.
Mutual breakups were also far more common outside marriage. They accounted for 19% of marital breakups, compared with 32% among cohabiters and 35% among non-cohabiters. That difference makes the non-marital pattern look less like one partner exiting and more like a shared decision to stop.
Rosenfeld put the point directly in the ASA release: “The breakups of non-marital heterosexual relationships in the U.S. are quite gender neutral and fairly egalitarian.” His phrasing matters because it separates divorce from relationship breakup behavior more broadly.
He also said: “I assumed, and I think other scholars assumed, that women’s role in breakups was an essential attribute of heterosexual relationships, but it turns out that women’s role in initiating breakups is unique to heterosexual marriage.” That is the key boundary around the finding.
This is why the non-marital half of the result matters. Any explanation based on something general about men and women, such as women noticing relationship problems sooner, should appear among unmarried couples too. It does not. The evidence points to something specific about marriage itself.
What the Year After a Divorce Looks Like for Men and Women
For this section, we pulled every record in the US Census Bureau’s American Community Survey Public Use Microdata Sample for 2024 where the respondent reported divorcing in the past 12 months.
That is 17,753 people in the 1-year file, 8,542 men and 9,211 women, representing 1,881,028 Americans. We repeated the whole analysis on the 2020 to 2024 5-year file, 83,955 records, and every finding below holds.
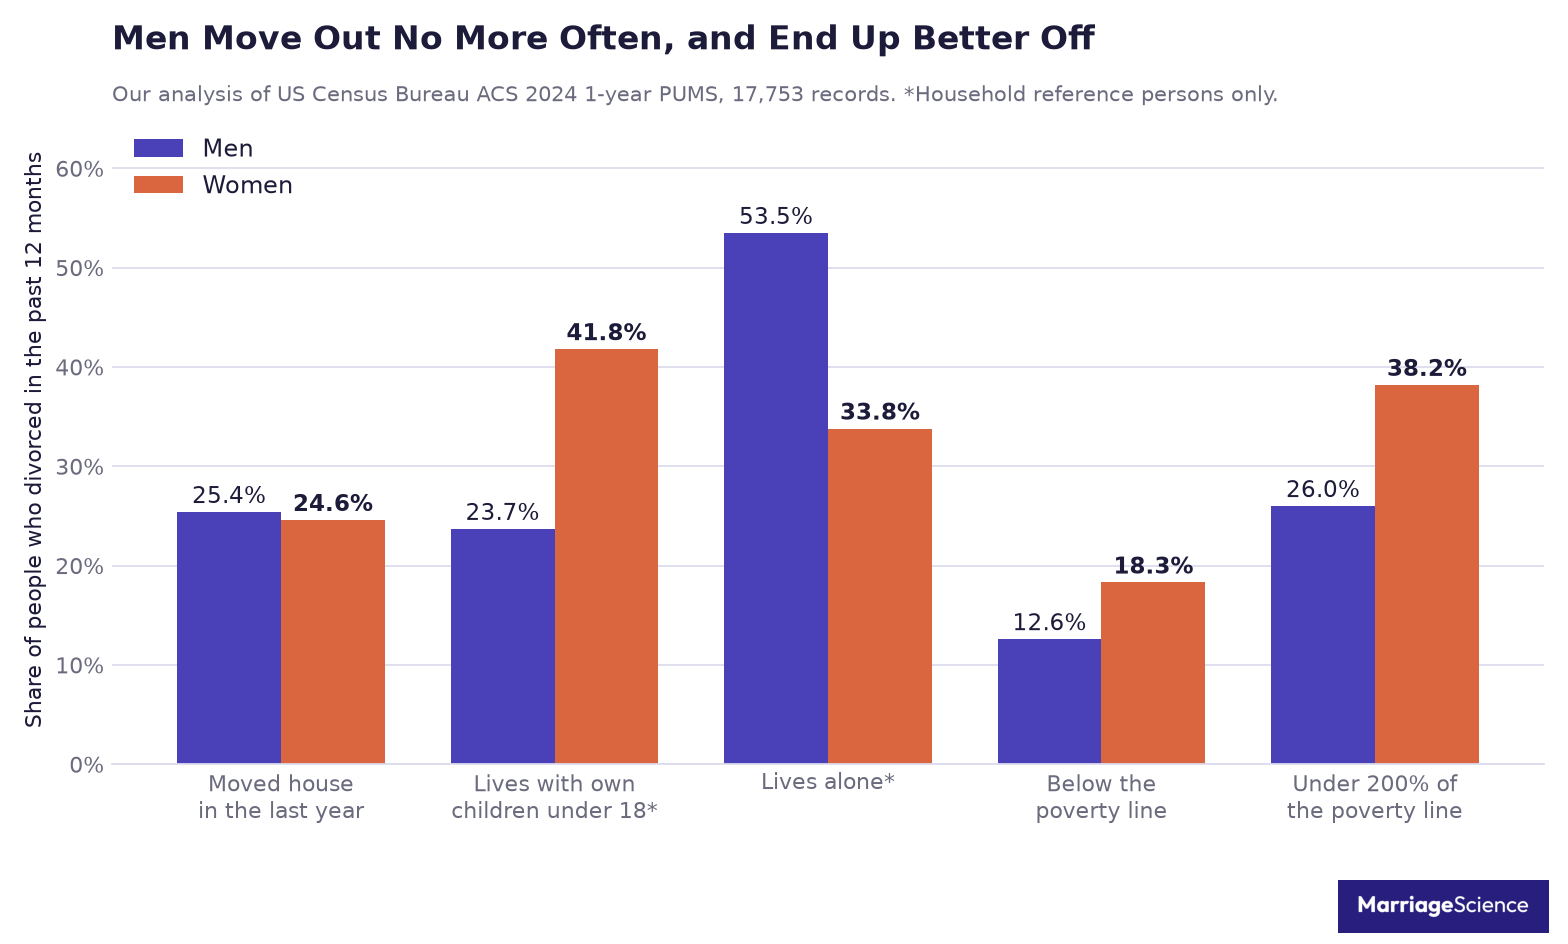
The folk belief that the man moves out after a divorce is not in the data. In the year after divorce, 25.4% of men and 24.6% of women had moved house, within one percentage point of each other. The first visible split is less about who left the address and more about what kind of household each person was living in afterward.
| Measure | Men | Women |
| Moved house in the last year | 25.4% | 24.6% |
| Heads their own household | 66.3% | 72.7% |
| Lives with own children under 18 (household heads) | 23.7% | 41.8% |
| Lives alone (household heads) | 53.5% | 33.8% |
| Employed | 74.6% | 75.9% |
| Below the poverty line | 12.6% | 18.3% |
| Under 200% of the poverty line | 26.0% | 38.2% |
| Median own income | $50,000 | $40,000 |
| Median household income | $82,000 | $69,060 |
Women were more likely to be heading the household after divorce, at 72.7% compared with 66.3% of men. Among people who headed their own household, the family arrangement looked very different by sex. Women were far more likely to live with their own children under 18, 41.8% compared with 23.7% of men, while men were much more likely to be living alone, 53.5% compared with 33.8% of women.
That child gap is especially clear in the ages when children at home are most common. Among household heads ages 30 to 39, 66.2% of women lived with children at home, compared with 35.5% of men. In the same age band, the poverty rate was 17.3% for women and 10.0% for men, so the caregiving split sits alongside a clear economic split.
The money line runs the other way from the household line. Women were employed at almost the same rate as men, 75.9% compared with 74.6%, but their median own income was $40,000 compared with $50,000 for men.
Their median household income was also lower, $69,060 compared with $82,000, and they were more likely to be below the poverty line, 18.3% compared with 12.6%. The wider hardship measure tells the same story, with 38.2% of women under 200% of the poverty line compared with 26.0% of men.
Read together, these results push against a simple advantage story. The group that files most often is also the group that is materially worse off a year later, even with similar employment and a higher chance of heading a household. That is an argument against reading the filing gap as women extracting an advantage. It does not, on its own, explain why women file more often, but it does show what the year after divorce looks like in the ACS data.
There is one measurement problem in the totals. The survey records 986,508 women and 894,520 men divorcing in the same twelve months, and every opposite-sex divorce involves one of each, so the 10% difference is a reporting artifact. It does not affect any of the within-sex percentages above, which are calculated separately for men and for women.
A Degree Nearly Erases the Gendered Cost of Divorce
The education split is the cleanest way to see what divorce costs after the filing question is put aside. In our ACS 2024 1-year PUMS cut, the gendered financial penalty is concentrated among recently divorced people without a bachelor degree.
Without a bachelor degree, the poverty rate is 14.8% for men and 23.0% for women, a gap of 8.2 percentage points. With a bachelor degree or higher, the poverty rate is 7.4% for men and 8.9% for women, a gap of 1.5 percentage points.
| Education | Poverty rate, men | Poverty rate, women | Median own income, men and women |
| Without a bachelor degree | 14.8% | 23.0% | Men $42,500, women $31,000 |
| With a bachelor degree or higher | 7.4% | 8.9% | Men $81,100, women $67,000 |
The income gap remains visible in both education groups. Among people without a degree, median own income is $42,500 for men and $31,000 for women. Among people with a degree, it is $81,100 for men and $67,000 for women.
A degree does not buy pay parity after divorce. Graduate women still report lower median own income than graduate men. What changes is the poverty risk, which moves from a wide gender gap among people without a degree to a much smaller gap among graduates.
This distinction matters because the false 90% claim mixes two different questions. One question is who wanted the divorce. The other is what divorce costs afterward.
Rosenfeld tested education against who wanted the divorce and found no effect. In that context, education does not explain the gendered pattern in initiation. It is the wrong variable for proving the 90% story.
Education matters enormously for the second question. In our data, it sharply divides high poverty risk from low poverty risk after divorce. That is why the same variable can be irrelevant to initiation and central to financial outcomes.
The graduate group also complicates a simple story about who is at risk. Recently divorced women are more likely than recently divorced men to hold a bachelor degree or higher, 33.4% against 28.5%. Even with that edge, women come out poorer overall, at 18.3% below the poverty line against 12.6% of men.
The table also shows why averages can blur the real pressure point. If degree holders and people without a degree are pooled together, the smaller graduate poverty gap sits beside the larger non-graduate gap. The financial risk is much sharper for women without a bachelor degree.
That is the group where the gendered cost of divorce is most visible in the ACS 2024 1-year PUMS data.
Why the United States Cannot Answer This From Records
The United States does not have a current national record system that says who filed for divorce. That absence is the main reason the American evidence on initiation rests on a small survey, while the cleaner administrative count comes from England and Wales.
The National Center for Health Statistics used to collect detailed divorce records from states through the Vital Statistics Cooperative Program. Those records were built from state reporting, so they could capture more than a simple count of divorces. They also depended on state participation, which made the system incomplete even before it ended.
A Federal Register notice dated 15 December 1995 announced the cutoff. It said that from 1 January 1996, “detailed data from States participating in the marriage and divorce components of the Vital Statistics Cooperative Program (VSCP) will no longer be obtained”.
The notice gave a budget reason, not a scientific one. Its stated explanation was, “This change is being made to prioritize programs in a period of tightened resource constraints.” In practice, that decision removed the main national pipeline that could have supported a record based answer to who petitions for divorce in the United States.
The old system was limited before it stopped. The same notice recorded that detailed records had covered roughly 77% of marriages and 49% of divorces nationally. That means the country never had complete detailed coverage through that program, and after the change it lost even that partial national source.
NCHS still publishes counts of divorces. Those counts can tell readers how many divorces were recorded by reporting areas. They do not say which spouse filed, which spouse wanted out, or how legal initiation differs from the private decision to end a marriage.
The consequence is direct. The United States has had no national record of who petitions for divorce for thirty years. England and Wales has one going back to 1858, so an American question often gets answered with an English number or with a survey of 92 breakups.
That does not make the question unknowable. It means the relevant American data sit in court systems. No published national vital statistics file carries them. State court administrative data would settle it, since some states hold filing party information. None publish it in a comparable national form.
Methodology and Sources
This article combines our own analysis of Census microdata with published court records and prior research on divorce initiation. Figures are current as of September 2026.
For the United States demographic tables, we analyzed the US Census Bureau, American Community Survey Public Use Microdata Sample, 2024 1-year and 2020 to 2024 5-year files. We accessed the files through the Census Bureau API on 7 September 2026. The universe is people aged 15 and over who reported divorcing in the past twelve months.
The ACS work uses 17,753 records in the 1-year file and 83,955 in the 5-year file. All percentages in those results are weighted with the person weight. Medians are weighted medians.
Poverty is measured with the Census income-to-poverty ratio. Household composition figures are restricted to household reference persons so that “own children” has a clear meaning in the public-use files.
For England and Wales court records, we used the Office for National Statistics, Divorces in England and Wales, 2023 edition, tables 2a and 4a. The ONS 2023 edition is the most recent complete year. ONS publishes counts, and the shares and percentage changes reported from those tables are ours.
The survey estimate for who wanted the divorce comes from Rosenfeld 2018, How Couples Meet and Stay Together, waves 1 to 5. The historical comparison comes from Goode, After Divorce, 1956. The economic argument about filing incentives comes from Brinig and Allen, American Law and Economics Review, 2000.
For data availability, we cite Federal Register notice 95-30566, 15 December 1995. That notice matters because it explains why court-based petitioner data stopped being available in a form that could support a continuing national United States series.
We left out claims that could not be checked against a primary source. We found no verifiable United States figure for the share of divorce petitions filed by women drawn from court records since 1996, and no reliable figure for who initiates divorce among same-sex couples. Widely circulated numbers on both were traced only to secondary write-ups and are not reported here.
Some sources measure legal filing, while others measure who first wanted or initiated the breakup. We keep those ideas separate because they answer different questions. Filing is a court action, while wanting the divorce is a survey response about the relationship before the case reached court.
This article sits in our statistics hub, which collects the rest of our research on marriage, divorce and dating.



