


TL;DR: The average American man now marries for the first time at 30.8 and the average woman at 28.8. Both are the oldest figures ever recorded, and the bigger change is that Americans now have their first child before they marry.
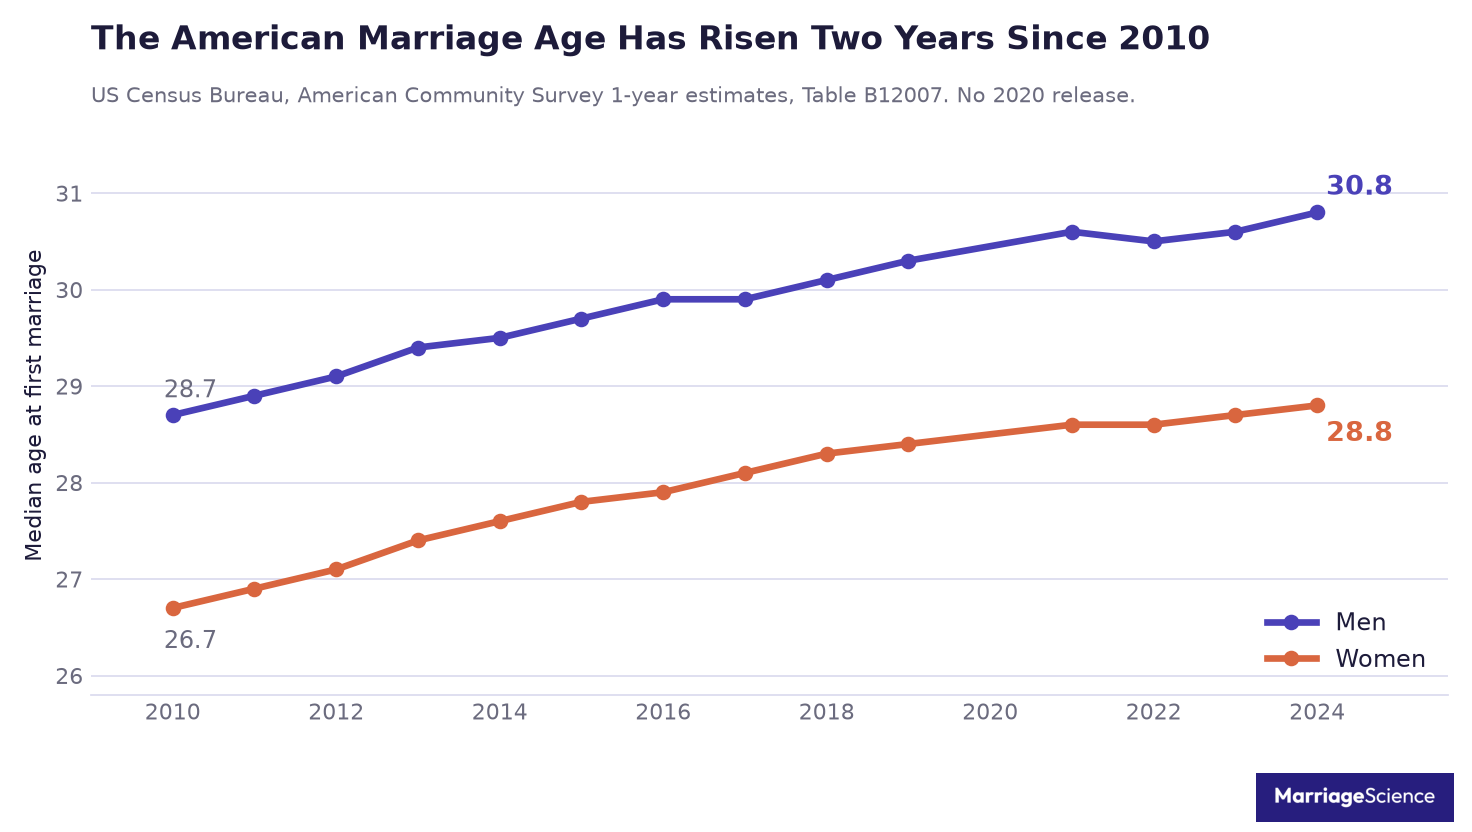
Median age at first marriage in 2024 was 30.8 for men and 28.8 for women (US Census Bureau, American Community Survey 2024, Table B12007, our own query of the Census API).
In 2010 those numbers were 28.7 and 26.7. Two years have been added to the American wedding in a decade and a half.
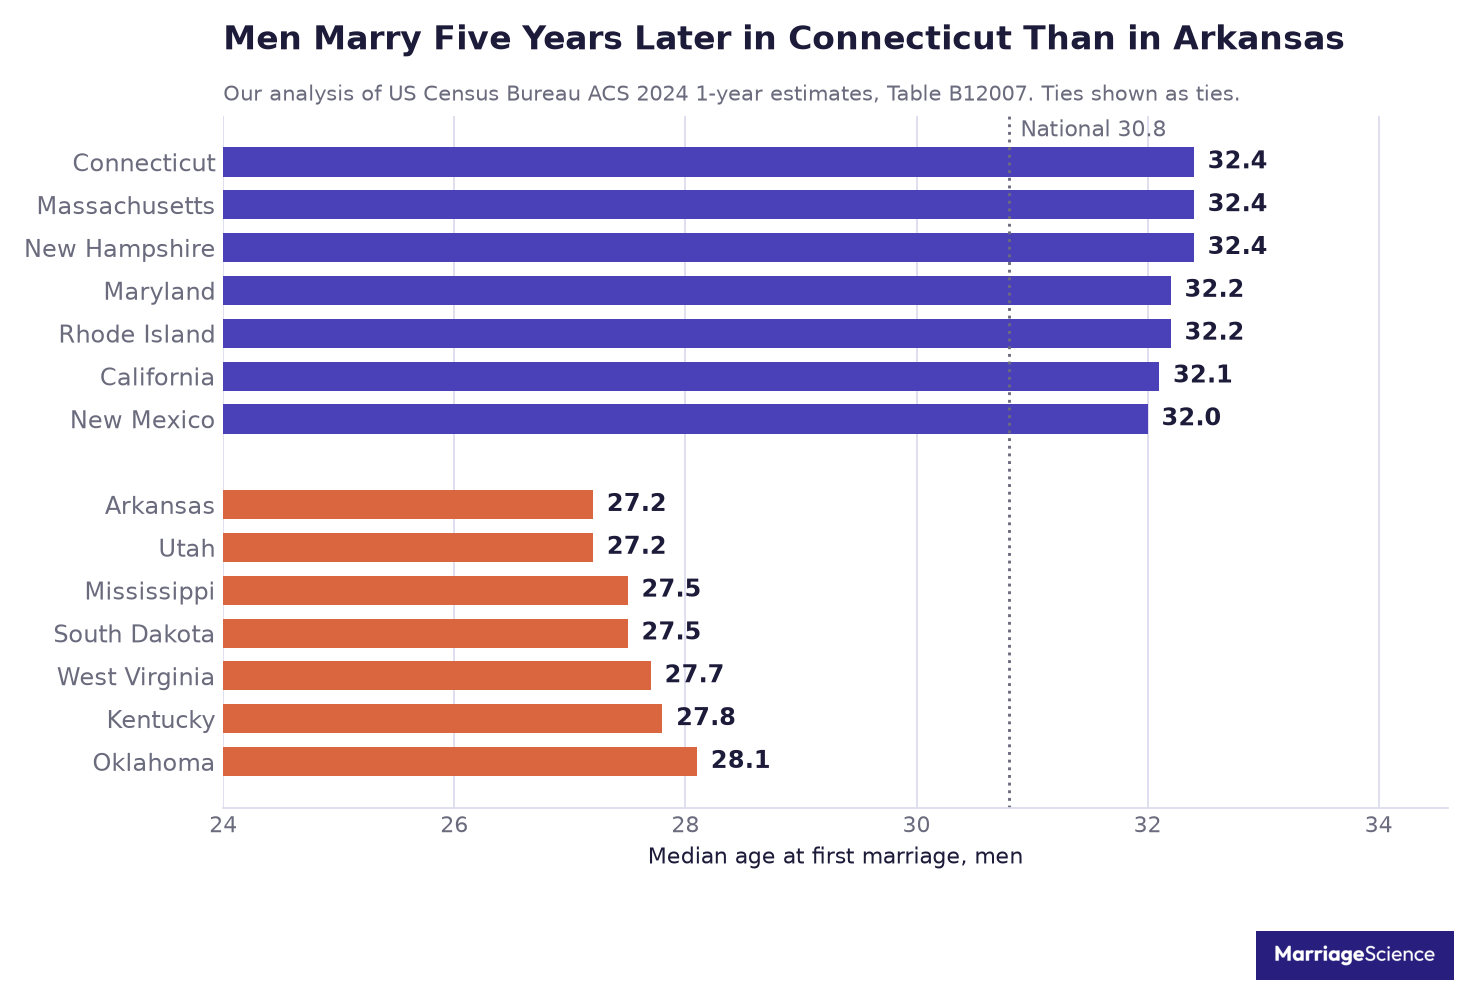
Where you live matters more than most people expect. A man in Connecticut marries five years later than a man in Arkansas, and the gap between the earliest and latest states for women is over seven years.
We pulled the national series and all 51 state-level figures straight from the Census API, and took the long historical trend from the National Center for Family and Marriage Research. Numbers that could not be traced to a government survey are named at the end and left out of everything above.
Key Average Marriage Age Statistics
- Men marry for the first time at a median age of 30.8 and women at 28.8 (ACS 2024, Table B12007).
- Both figures are the highest on record and have risen every year since 2022 (ACS 1-year series, 2010 to 2024).
- Men gained 2.1 years and women 2.1 years since 2010, from 28.7 and 26.7 (ACS 1-year series).
- Women’s median age at first marriage rose 29% between 1980 and 2023, from 22.0 to 28.4 (NCFMR, Family Profiles FP-25-13, 2025, using Census CPS Table MS-2).
- The median age at first birth crossed below the median age at first marriage in 1991 and has stayed there ever since (NCFMR, 2025).
- About 40% of American children have been born to unmarried mothers every year since 2008, against 18.4% in 1980 (NCFMR, 2025, using CDC birth data files).
- Connecticut, Massachusetts and New Hampshire tie for the latest male marriage age at 32.4 (our analysis of ACS 2024 state estimates).
- Arkansas and Utah tie for the earliest at 27.2 for men, a 5.2 year spread across the country (our analysis, ACS 2024).
- Utah women marry earliest at 25.2 and women in the District of Columbia latest at 32.3, a spread of 7.1 years (our analysis, ACS 2024).
- The District of Columbia is the only place in America where women marry later than men, 32.3 against 32.2 (our analysis, ACS 2024).
- Men marry 1.95 years later than women on average across the 51 jurisdictions (our analysis, ACS 2024).
- Louisiana has the widest gender gap at 2.9 years, men at 30.2 and women at 27.3 (our analysis, ACS 2024).
- Women’s median age at first birth reached 27.9 in 2023, its own historic high, up 23% since 1980 (NCFMR, 2025).
- Since 2008 men have added 2.6 years and women 2.5 years to their age at first marriage (NCFMR, Family Profiles FP-25-09, 2025).
- The median age at remarriage is 46 for men and 43 for women, up from 40 and 34 (NCFMR, Family Profiles FP-20-10, 2020).
- In 1890 the median age at first marriage was 26.1 for men and 22.0 for women, and women were still at 22.0 in 1980 (NCFMR, Family Profiles FP-22-15).
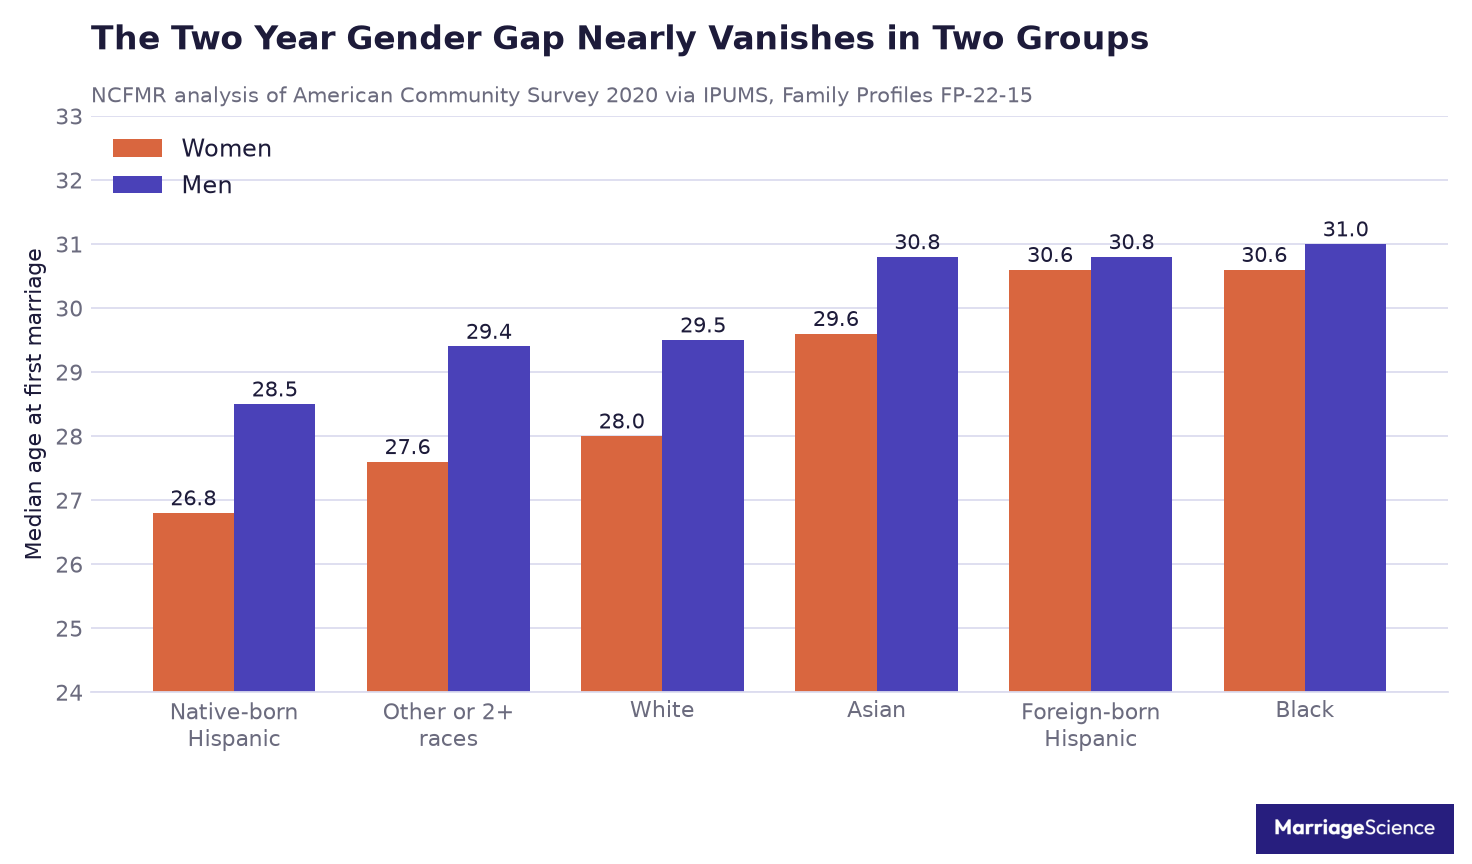
- Black men marry latest of any group at 31.0 and native-born Hispanic men earliest at 28.5 (NCFMR analysis of ACS 2020 via IPUMS).
- The gender gap is 0.2 years among foreign-born Hispanic couples and 1.9 years among people of other or multiple races (NCFMR, ACS 2020).
- The two federal surveys disagree by about three months, with the ACS putting women at 28.7 in 2023 and the CPS at 28.4 (ACS Table B12007 and Census CPS Table MS-2).
What the Average Marriage Age Is Right Now
30.8 for men and 28.8 for women, measured across everyone aged 15 to 54 who has married once.
These are medians and not means, which is the right choice here. A handful of people marrying for the first time at 70 would drag an average upward and describe nobody. The median splits the population in half, so half of first marriages happen before 30.8 for men and half after.
The climb has been steady and undramatic. Men added roughly one year every seven years across the whole series, with a single small reversal in 2022 when the figure slipped from 30.6 to 30.5 before resuming.
Women have not gone backwards at all. Across every ACS year released since 2010 their figure has risen or held flat, never once fallen. There is no 2020 reading, because the pandemic stopped the Census Bureau publishing standard one-year estimates that year.
Measured from 2008, the National Center for Family and Marriage Research puts the gain at 2.6 years for men and 2.5 for women, with both sexes at their highest levels since collection began.
Two years of delay across a decade and a half sounds modest until you consider what sits inside it. Later marriage compresses the window for having children, changes who owns property before the wedding, and moves the whole question of financial planning into a period when both partners already have careers and assets.
| Year | Men | Women |
| 2010 | 28.7 | 26.7 |
| 2013 | 29.4 | 27.4 |
| 2016 | 29.9 | 27.9 |
| 2019 | 30.3 | 28.4 |
| 2020 | Not released | Not released |
| 2021 | 30.6 | 28.6 |
| 2022 | 30.5 | 28.6 |
| 2023 | 30.6 | 28.7 |
| 2024 | 30.8 | 28.8 |
The Two Government Surveys Do Not Agree
If you have seen two different marriage ages quoted for the same year, this is why.
The Census Bureau runs two separate instruments that both produce this number. The American Community Survey samples about 3.5 million addresses a year. The Current Population Survey is smaller and older, and its Table MS-2 carries the series back to 1890.
For 2023 the ACS put women at 28.7 and the CPS put them at 28.4. Three months apart, from the same agency, in the same year.
The gap is not always that small, and it does not always run the same way. NCFMR compared the two for 2020 and found the CPS at 30.5 for men and 28.1 for women against 29.7 and 28.3 in the ACS. The CPS was nearly a year higher for men and two months lower for women in the same year.
Neither is wrong. They use different samples, different questionnaires and slightly different universes, and gaps of this size on a median are well within what that produces.
The practical rule is to use the ACS for anything current or geographic, because its sample is large enough to hold up at state level, and the CPS for anything historical, because it is the only series that reaches back to the nineteenth century. Mixing them inside one trend line is the error worth avoiding.
| Survey | Women, 2023 | Best used for |
| American Community Survey, Table B12007 | 28.7 | Current and state-level figures |
| Current Population Survey, Table MS-2 | 28.4 | Long trends back to 1890 |
How the Marriage Age Changed Since 1980
The long view makes the recent movement look small.
Women married at 22.0 in 1980. By 2023 that was 28.4, a rise of 29% across forty three years.
Push the series back further and something odd appears. When the census first measured this in 1890, the median age at first marriage for women was 22.0 and for men 26.1 (NCFMR, Family Profiles FP-22-15).
22.0 is the same figure as 1980. American women in the Reagan era married at exactly the age their great-grandmothers did, ninety years apart.
The century in between was not flat. NCFMR describes the American marriage age as rising steadily since the middle of the twentieth century, which places the low point in the middle of the record and not at its start. The marriage age people think of as traditional belongs to that mid-century trough.
The increase came in bursts. Between 1980 and 1990 the figure jumped almost two years, from 22.0 to 23.9. Growth then slowed sharply, adding only 1.4 years across the following fifteen years to reach 25.3 by 2005.
From 2006 it accelerated again, climbing from 25.5 to 28.1 by 2020. The all time high arrived in 2021 at 28.6, then dipped to 28.2 in 2022 and recovered to 28.4 in 2023.
That 2021 spike and 2022 dip are worth reading carefully. They line up with the pandemic, when weddings were cancelled and then held in a rush, and a median calculated on who married in a disrupted year moves for reasons that have nothing to do with what people want.
| Period | Women’s median age at first marriage | Change |
| 1980 to 1990 | 22.0 to 23.9 | Up 1.9 years |
| 1990 to 2005 | 23.9 to 25.3 | Up 1.4 years |
| 2006 to 2020 | 25.5 to 28.1 | Up 2.6 years |
| 2021 | 28.6 | Historic high |
| 2023 | 28.4 | After a dip to 28.2 |
Americans Now Have Children Before They Marry
This is the finding that matters most, and almost nobody quoting marriage-age statistics mentions it.
Through the 1980s American women married before they had their first child. In 1980 the median age at first marriage was 22.0 and the median age at first birth was 22.6, so the wedding came first by about seven months.
In 1991 the two lines crossed. Since that year the median age at first birth has been consistently lower than the median age at first marriage, and the order of the two events has reversed for the population as a whole.
By 2023 women were having a first child at 27.9 and marrying at 28.4. Both are historic highs, and childbirth is still arriving first.
The share of births to unmarried mothers tracks the same shift. It was 18.4% in 1980, reached 29.5% by the crossover year of 1991, and has sat at roughly 40% every year since 2008.
The two medians have also stayed close. The widest the gap ever got was 1.1 years in 2008, and it has run between 0.9 and 0.3 years since. Marriage and the first child now happen within roughly the same twelve months for the typical woman, in the opposite order to the one most people assume.
So the rising marriage age is not a story about people delaying family formation. It is a story about marriage and childbearing coming apart, with the wedding moving later while the first child did not move nearly as far.
| Metric | Value | Source |
| Year the two medians crossed | 1991 | NCFMR FP-25-13, 2025 |
| Women’s median age at first birth, 1980 | 22.6 | NCFMR FP-25-13, 2025 |
| Women’s median age at first birth, 2023 | 27.9 | NCFMR FP-25-13, 2025 |
| Births to unmarried mothers, 1980 | 18.4% | CDC birth data via NCFMR |
| Births to unmarried mothers, since 2008 | About 40% | CDC birth data via NCFMR |
| Widest gap between the two medians | 1.1 years, in 2008 | NCFMR FP-25-13, 2025 |
Average Marriage Age by State
We queried the Census API for all 50 states and the District of Columbia and computed the rankings ourselves. The state spread is far wider than the national trend.
Three states tie at the top for men. Connecticut, Massachusetts and New Hampshire all record 32.4, and their margins of error overlap enough that naming a single winner would be false precision.
At the other end Arkansas and Utah tie at 27.2. The distance between the two ends is 5.2 years, which dwarfs the 2.1 years the national figure moved across the whole 2010 to 2024 series.
For women the spread is wider still at 7.1 years. Utah records 25.2 and the District of Columbia 32.3.
Behind those extremes the ordering is orderly. Maryland and Rhode Island follow at 32.2 for men, California at 32.1 and New Mexico at 32.0. At the young end Mississippi and South Dakota sit at 27.5, West Virginia at 27.7 and Kentucky at 27.8.
For women the late end is Massachusetts and Rhode Island at 30.9, then California and New York at 30.4. The early end is Utah at 25.2, Idaho at 25.4 and Alaska at 25.5.
These are one-year estimates, so the small states carry real uncertainty. The median margin of error is 0.6 years for men and 0.5 for women, and a handful of low-population states run wider than that, which is why we report ties as ties.
The pattern is regional and consistent. The Northeast corridor and the coastal metros marry late, the Mountain West and the South marry early, and Utah sits at the young extreme on both measures.
| State | Men | Women |
| Connecticut | 32.4 | 30.3 |
| Massachusetts | 32.4 | 30.9 |
| New Hampshire | 32.4 | 30.0 |
| District of Columbia | 32.2 | 32.3 |
| Utah | 27.2 | 25.2 |
| Arkansas | 27.2 | 25.8 |
| Mississippi | 27.5 | 26.5 |
| Idaho | 28.2 | 25.4 |
The Gender Gap, and the One Place It Reverses
Men marry later than women almost everywhere, by an average of 1.95 years across the 51 jurisdictions.
Louisiana runs the widest gap at 2.9 years, with men at 30.2 and women at 27.3. Alaska, Idaho and Wyoming all sit at 2.8.
The District of Columbia is the single exception in the country. Women there record 32.3 and men 32.2, so women marry a fraction later than men.
That reversal is small enough to sit inside the margin of error, so the safe reading is that DC is the one place where the usual gap has closed completely.
West Virginia has the narrowest genuine gap at 0.9 years, followed by Mississippi and Vermont at 1.0. West Virginia and Mississippi sit at the early end of the marriage-age table and Vermont at the late end, so a narrow gap has nothing to do with when a state marries.
| Jurisdiction | Gap, men minus women | Men / Women |
| Louisiana | 2.9 years | 30.2 / 27.3 |
| Alaska | 2.8 years | 28.3 / 25.5 |
| Idaho | 2.8 years | 28.2 / 25.4 |
| National average | 1.95 years | 30.8 / 28.8 |
| West Virginia | 0.9 years | 27.7 / 26.8 |
| District of Columbia | Minus 0.1 years | 32.2 / 32.3 |
Marriage Age by Race and Ethnicity
The national median hides a four year range between groups, and the gender gap varies even more than the ages do.
Among women who married in the year before the 2020 survey, Black women and foreign-born Hispanic women married latest at 30.6. Native-born Hispanic women married earliest at 26.8, with White women at 28.0 and Asian women at 29.6.
Among men, Black men married latest at 31.0, followed by Asian and foreign-born Hispanic men at 30.8. Native-born Hispanic men married earliest at 28.5 and White men at 29.5.
The gender gaps are the more striking part. Foreign-born Hispanic couples marry only 0.2 years apart and Black couples 0.4 years, against 1.6 years for White couples and 1.9 for people of other or multiple races.
So the roughly two year gender gap that shows up in every national headline is close to absent in two of the largest groups in the country. It is an average of very different patterns and describes no group particularly well.
| Group | Women / Men | Gender gap |
| Black | 30.6 / 31.0 | 0.4 years |
| Foreign-born Hispanic | 30.6 / 30.8 | 0.2 years |
| Asian | 29.6 / 30.8 | 1.2 years |
| White | 28.0 / 29.5 | 1.6 years |
| Other or two or more races | 27.6 / 29.4 | 1.9 years |
| Native-born Hispanic | 26.8 / 28.5 | 1.7 years |
Average Age of a Second Marriage
Remarriage happens roughly fifteen years later than a first marriage.
The median age at remarriage is 46 for men and 43 for women, up from 40 and 34 in the earlier data the same researchers examined.
Women’s remarriage age has risen much faster than men’s, which has narrowed the gender gap on second marriages considerably more than on first ones.
Remarriage is measured less often and less consistently than first marriage, so treat these as the right order of magnitude rather than a figure with the precision of the ACS numbers above. If you are marrying again, our guide to prenup versus postnup covers the paperwork side.
| Metric | Men | Women |
| Median age at first marriage, 2024 | 30.8 | 28.8 |
| Median age at remarriage | 46 | 43 |
| Earlier remarriage figure | 40 | 34 |
What Historical Marriage Age Claims Are Worth
People search for the average marriage age in medieval Europe, in ancient Rome, even in the year 500. Those numbers circulate widely and none of them is a measurement.
The American series begins in 1890, when the census first collected it. Everything before that comes from parish registers, tax rolls and legal records that survive unevenly, cover small populations and were never designed to produce a national statistic.
Historians do estimate marriage ages for particular places and periods, and that work is real. What does not exist is a global or even national average for any year before modern record keeping, and figures presented that way on social media are invented or extrapolated from a single village.
We left every pre-1890 figure out. The same rule applies to wedding-industry surveys, which report the age of couples who bought a service and cannot describe the country. For the wider set of research summaries, see our marriage statistics page and the statistics hub, and our average marriage length page covers what happens after the wedding.
People who marry later tend to arrive with more already in their own name, a home, a pension, sometimes a business. That is the situation a prenuptial agreement is written for, and what it can do differs by state, including in Maryland, Connecticut, Utah, Louisiana, New Mexico, Rhode Island and South Dakota.
Methodology and Sources
National and state figures come from our own queries of the Census Bureau API for Table B12007, Median Age at First Marriage, American Community Survey 1-year estimates. The universe is people aged 15 to 54. State rankings, the gender gaps and the spreads were computed by us from those estimates, and we checked every ranking against its published margin of error before naming it.
Our 2023 national figures match those published by the National Center for Family and Marriage Research to the decimal, which is the cross-check we used to confirm the pull was correct.
Historical trend figures, the first-birth crossover and the non-marital birth shares come from NCFMR Family Profiles FP-25-13, which uses Census Current Population Survey Table MS-2 and the CDC National Center for Health Statistics final birth data files. Remarriage figures come from NCFMR Family Profiles FP-20-10. The 1890 baseline and the race and ethnicity breakdown come from NCFMR Family Profiles FP-22-15, which uses CPS Table MS-2 and NCFMR analysis of ACS 2020 through IPUMS.
We excluded wedding-industry surveys, aggregator statistics pages and every pre-1890 historical claim. Where a number could only be found on those, we left it out and said so.



