


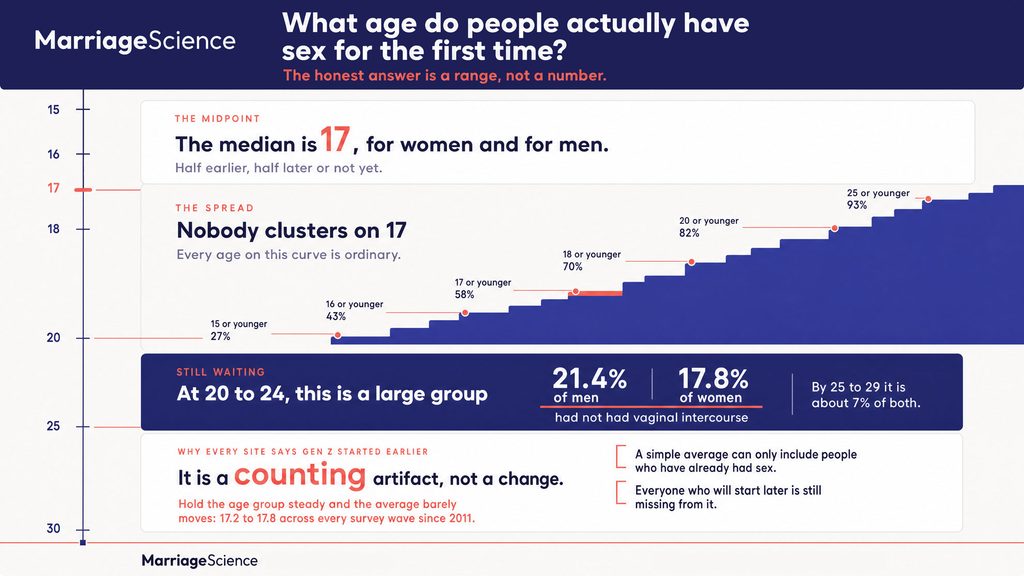
In the United States, the typical age for first vaginal intercourse is 17. In 2017 to 2019, half of women and half of men had had sex by the end of age 17, according to our analysis of the CDC’s National Survey of Family Growth.
That does not make 17 a deadline.
The range is wide: about one in four had sex at 15 or younger, and about one in five men aged 20 to 24 had not had vaginal intercourse yet (21.4%). Both are ordinary.
The number most sites repeat, 17.4, comes from a 2018 online survey of 1,000 people run by an online pharmacy. That survey published no sampling method.
This page covers the ages from CDC data, where the 17.4 figure came from, why simple averages make young people look like they start earlier, whether young adults are waiting longer, and the gaps by gender, race and family.
Key Statistics on the Average Age of Losing Virginity
Unless another source is named, every figure below comes from our analysis of the CDC’s National Survey of Family Growth (NSFG), based on interviews from 2011 to 2019. In that survey, “had sex” means first vaginal intercourse.
- The widely repeated average of 17.4 comes from a 2018 online survey of 1,000 people by the online pharmacy Zava, which published no sampling method.
- The median age at first sex was 17 for both women and men in 2017 to 2019.
- Among adults aged 25 to 49 who have had sex, the average age at first sex was 17.3 for women and 17.4 for men.
- 27.3% of women and 26.6% of men had sex at 15 or younger.
- 58.1% of women and 57.3% of men had sex before turning 18.
- 70.1% of women and 68.6% of men had sex at 18 or younger.
- By age 20 or younger, 81.9% of women and 80.4% of men had had sex.
- 21.4% of men and 17.8% of women aged 20 to 24 had not had vaginal intercourse.
- At 25 to 29, 7.2% of women and 6.9% of men had not had vaginal intercourse.
- The average age among 25 to 49 year olds stayed between 17.2 and 17.8 in all four survey waves.
- Among 20 to 24 year olds, the share who had sex before 18 slid from 60.1% to 53.6% for women between the 2011 to 2013 and 2017 to 2019 waves, a change inside the margin of error.
- CDC report (NCHS, 2023): 40.5% of never-married teenage girls and 38.7% of teenage boys aged 15 to 19 had ever had vaginal intercourse in 2015 to 2019.
- CDC report (NCHS, 2023): for teenage boys that share fell from 45.7% in 2002.
- CDC report (NCHS, 2023): 77.3% of teenage girls used contraception the first time.
- A simple average makes people born 1995 to 2003 look like they started at 16.0, because it only counts those who have already had sex.
- Women who did not live with both parents through age 18 were more likely to have had sex before 18, 71.9% against 48.8%.
What Is the Average Age of Losing Virginity?
In the CDC survey for 2017 to 2019, the median age at first sex was 17 for women and for men. In the survey, “first sex” means first vaginal intercourse with an opposite-sex partner.
The median is a midpoint. Half had sex at 17 or younger, half later or not yet.
The average, or mean, is very close to the median. Among adults aged 25 to 49 who have had sex, the average age was 17.3 for women and 17.4 for men.
We use 25 to 49 for the mean so that almost everyone in the group has already had sex, which keeps the average honest. If younger teens were mixed into that calculation, the average would be pulled by people who have not reached later ages yet.
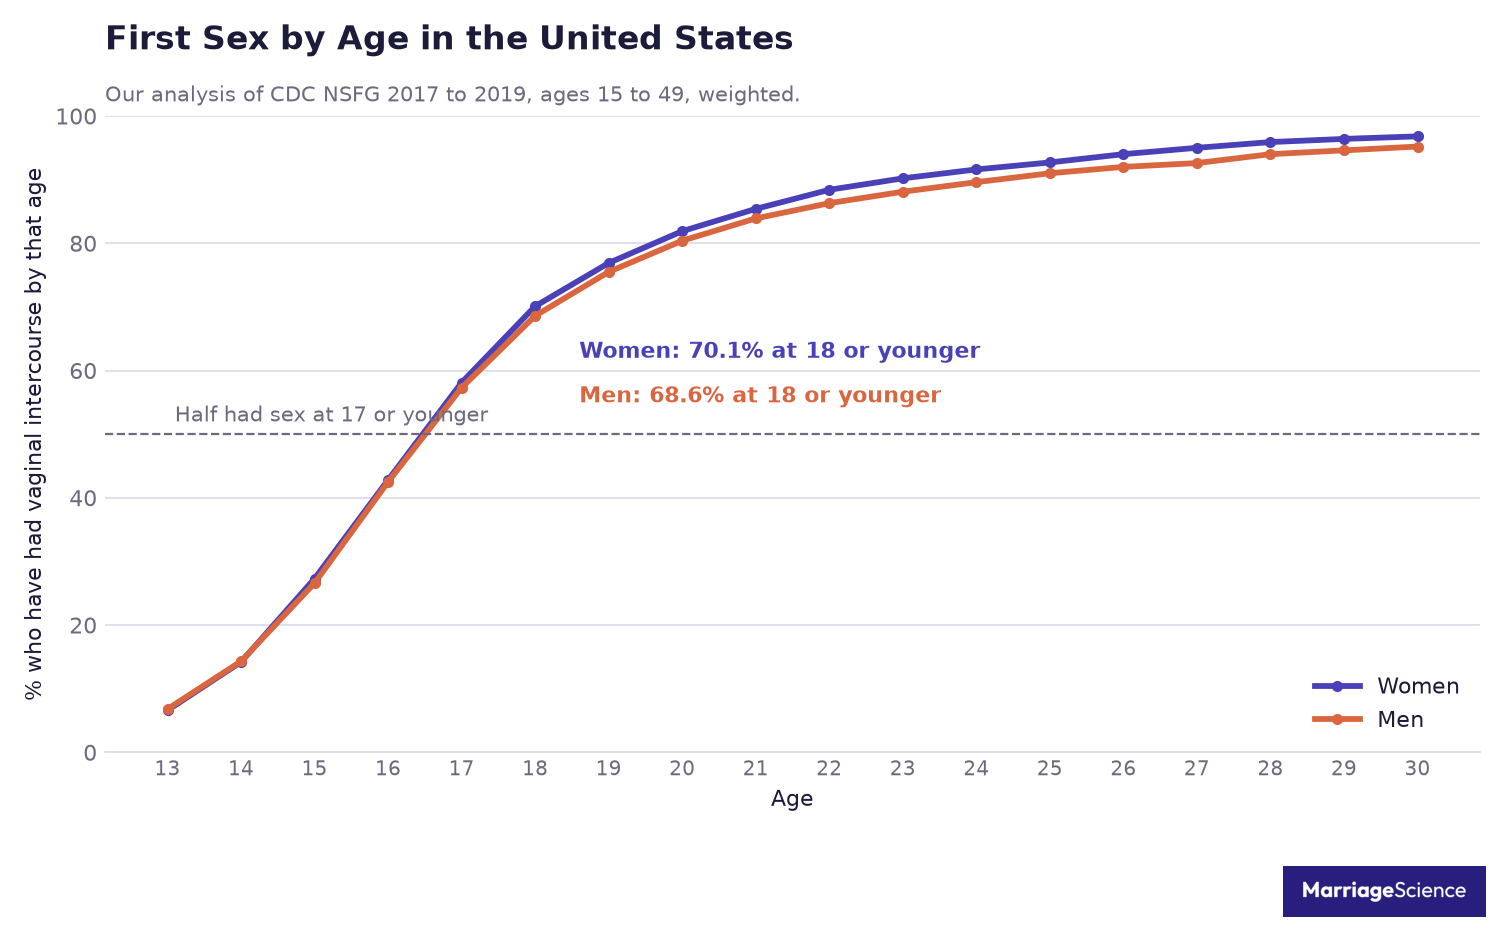
Women and men follow almost the same path in this data. At 16 or younger, the figures are 42.8% for women and 42.5% for men.
Before 18, the figures are 58.1% for women and 57.3% for men. That is why the median lands at 17 for both groups, even though the full distribution stretches across a wide range of ages.
The spread is wide at both ends. Among women, 27.3% had sex at 15 or younger, while 7.2% of women aged 25 to 29 had not had vaginal intercourse.
No age in this data is the right one. It shows a wide range.
The figures describe timing across a national survey. They set no rule for any one person.
The table gives the cumulative share who had had sex by each age. Read each row as “by this age or earlier,” using the same CDC NSFG 2017 to 2019 data and our analysis.
| Age | Women who had had sex | Men who had had sex |
|---|---|---|
| 15 or younger | 27.3% | 26.6% |
| 16 or younger | 42.8% | 42.5% |
| 17 or younger | 58.1% | 57.3% |
| 18 or younger | 70.1% | 68.6% |
| 20 or younger | 81.9% | 80.4% |
| 25 or younger | 92.7% | 91.0% |
| 30 or younger | 96.8% | 95.2% |
CDC NSFG 2017 to 2019, our analysis, 6,141 women and 5,206 men.
What comes after the first time is in our average number of sexual partners statistics.
Where the 17.4 Figure Comes From
The 17.4 figure often appears online as if it were a settled national average. The trail leads back to Seventeen (the magazine), whose article on the average age teens lose their virginity gives 17.4 and credits Zava, an online doctor service previously known as DrEd.
The Zava source is a 2018 page called Sexual Journeys. Its methodology statement is short: “We surveyed 500 Americans and 500 Europeans for a total of 1,000 respondents.”
That sentence is the main public description of the survey behind the number. The page gives no sampling method, no weighting and no response rate.
Those missing details matter because they tell readers how much confidence to place in a survey estimate. A national health survey usually explains how respondents were selected, how the results were weighted and how participation was measured.
Zava’s 17.4 value also appears only inside a chart image. That makes the number harder to inspect, quote and compare than a value printed in the body of a report or in a data table.
The same page makes a generational claim that is more telling than the headline average. It says, “Gen Zers averaging an age of just over 16 when they first had sex and Gen Xers barely over 18”.
The next section explains why an online survey of this kind would produce exactly that pattern. For now, the key point is that the CDC data do not show younger adults starting earlier.
That does not mean 17.4 is wildly wrong as a single adult average. It is close to the NSFG average of 17.3 to 17.4, so the number is not far off for adults.
The trouble is the source. The number comes from a sample nobody can check, and its generational claim does not hold up in the CDC data.
Why Simple Averages Make Young People Look Early
A simple average leaves out people who have not reached the event yet.
The trap is called right-censoring. A 20 year old who has not had sex yet cannot be counted in an average age at first sex among people who have had sex, since that age has not happened for that person.
In a young group, the average is built from the people who started earlier. People who will start later are still waiting, so they are missing from the calculation, and the average drops.
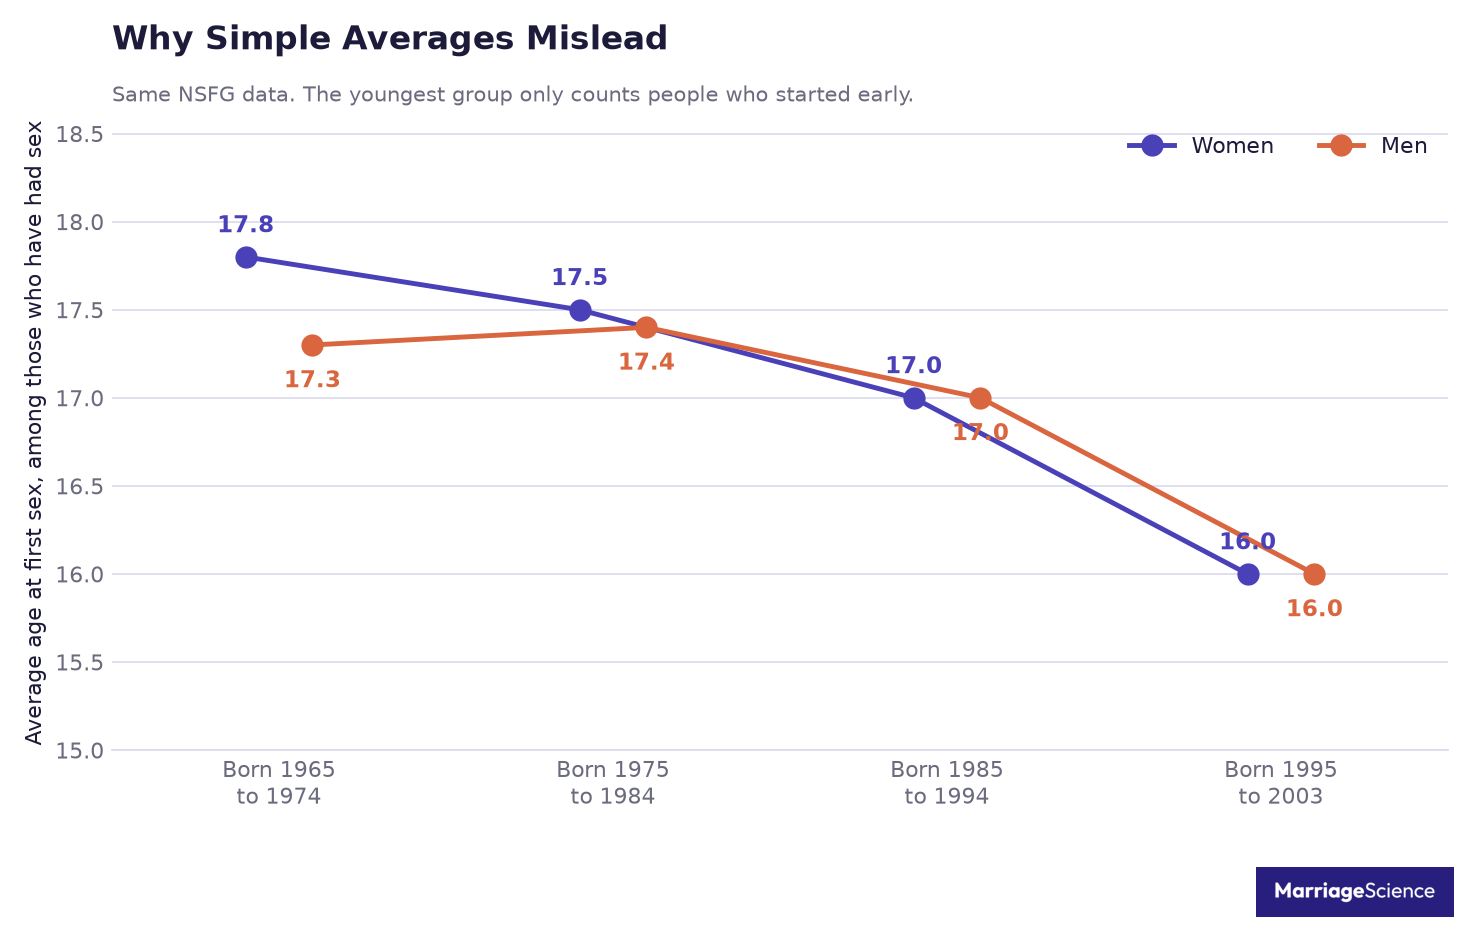
Our analysis shows the pattern in the same CDC data. The simple averages by birth year look lower for younger respondents.
| Born | Simple average, women | Simple average, men |
|---|---|---|
| 1965 to 1974 | 17.8 | 17.3 |
| 1975 to 1984 | 17.5 | 17.4 |
| 1985 to 1994 | 17.0 | 17.0 |
| 1995 to 2003 | 16.0 | 16.0 |
Read straight down the table, and the youngest birth group appears to start earliest. Among respondents aged 18 to 21, the simple average was 16.3 for women and 16.2 for men.
That pattern can be mistaken for a real shift toward earlier first sex. Yet among 20 to 24 year olds, the share who had sex before 18 was no higher than among 25 to 29 year olds in 2017 to 2019.
For women, the figures were 53.6% against 57.9%. For men, they were 51.6% against 58.6%.
So the drop in the simple average is a counting effect. It is the same effect behind Zava’s “just over 16” for Gen Z.
Our figures avoid it by using the survival method, which keeps people who have not had sex yet in the count up to their current age. The average we report is for adults aged 25 to 49.
Are Young Adults Waiting Longer?
The honest answer is maybe a little, and the CDC data cannot yet say for sure. The best comparison holds the age group steady, then asks the same question across the same survey series.
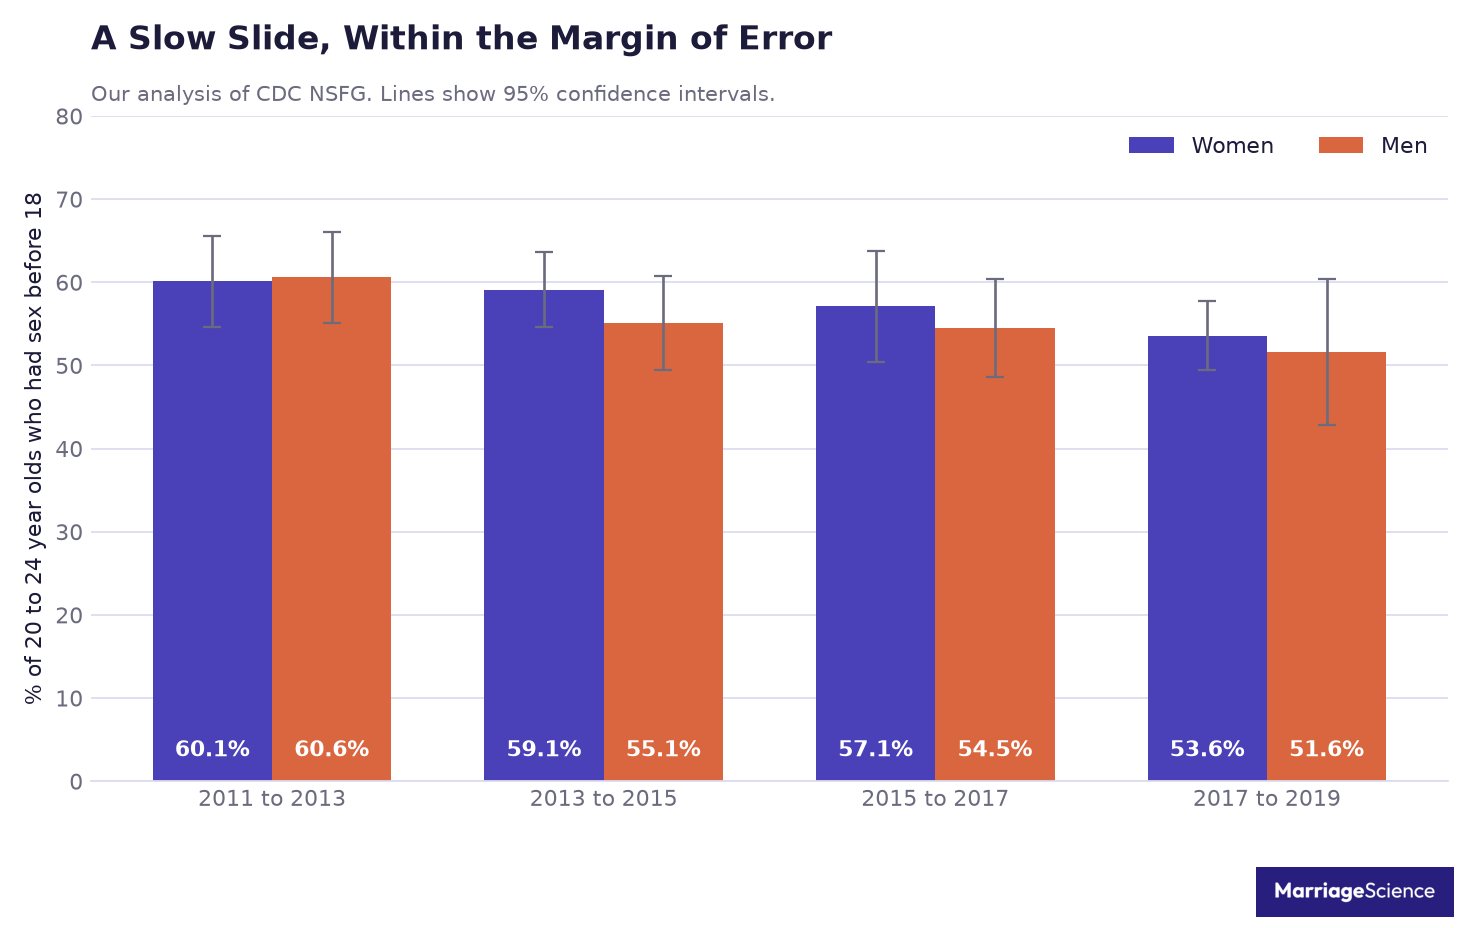
Among 20 to 24 year olds, the share who had vaginal intercourse before 18 fell in each listed wave for women and men. For women, it moved from 60.1% in 2011 to 2013 to 53.6% in 2017 to 2019, and for men it moved from 60.6% to 51.6%.
| Survey wave | Women 20 to 24, sex before 18 | Men 20 to 24, sex before 18 |
|---|---|---|
| 2011 to 2013 | 60.1% | 60.6% |
| 2013 to 2015 | 59.1% | 55.1% |
| 2015 to 2017 | 57.1% | 54.5% |
| 2017 to 2019 | 53.6% | 51.6% |
That pattern looks like a small move toward later first sex, but it needs caution. Each change sits inside the survey’s margin of error, so it is a hint, not a finding.
The same caution appears when the age group changes. Among 25 to 29 year olds, the series has no clear direction, with women moving from 56.2% to 57.9% for sex before 18.
The average age among 25 to 49 year olds barely moved. Across the four waves, women are listed at 17.4, 17.5, 17.8, and 17.3, while men are listed at 17.2, 17.4, 17.4, and 17.4.
That is why our analysis reads the trend as possible but unsettled. The table for 20 to 24 year olds points in one direction, but the wider age comparisons do not give the same clean line.
The CDC’s National Health Statistics Reports teen report gives a related snapshot for never-married teenagers aged 15 to 19. In 2015 to 2019, 40.5% of girls and 38.7% of boys had ever had vaginal intercourse.
The teen figures are not the same measure as the young adult recall table. They describe whether teenagers had ever had vaginal intercourse by the interview, while the young adult table asks adults whether it happened before 18.
The report states, “For females this percentage was stable across the four time points, but for males this percentage decreased from the 2002 (45.7%) and 2011-2015 (44.2%) time points.”
The same teen report also describes contraception the first time. It says 77.3% of teenage girls used a method of contraception the first time, and for teenage boys the share rose from 82.0% in 2002 to 92.1% in 2015 to 2019.
Taken together, the CDC figures support a careful answer. Younger adults may be waiting a little longer, especially in the 20 to 24 comparison, but the evidence is not strong enough to treat that as a settled national shift.
For how this generation dates, see our Gen Z dating statistics.
How Many Adults Have Not Had Sex Yet
These figures are a useful check for readers who have not had sex and worry that they are alone. In this section, the survey measure is narrow: never having had vaginal intercourse with an opposite-sex partner.
That definition matters. People counted in this group may have had other kinds of sex, including with a same-sex partner.
In 2017 to 2019, among adults ages 20 to 24, 17.8% of women and 21.4% of men had never had vaginal intercourse. Put plainly, at 20 to 24, roughly one man in five and one woman in six had not had vaginal intercourse.
That is a large group, and it sits inside the same national survey data used for the rest of this article. It does not make any one age the right age.
| Age | Women who have not had vaginal intercourse | Men who have not had vaginal intercourse |
|---|---|---|
| 20 to 24 | 17.8% | 21.4% |
| 25 to 29 | 7.2% | 6.9% |
| 30 to 49 | 1.4% | 2.6% |
The share is lower in the next age group. Among adults ages 25 to 29, 7.2% of women and 6.9% of men had never had vaginal intercourse.
Among adults ages 30 to 49, the figures were 1.4% for women and 2.6% for men.
These numbers describe a survey category. They say nothing about a person’s worth.
For someone who has not had vaginal intercourse, the main point is simple: the data include people in the same position across adult age groups. The survey records a behavior, within a specific definition, without judging waiting or not waiting.
Once people are in a relationship, our analysis of how often couples have sex shows how much that also varies.
Differences by Race and Ethnicity
Race and ethnicity are reported here for adults aged 25 to 44, using interviews from 2011 to 2019 pooled. The measure is the share who had vaginal intercourse before turning 18, matching the survey definition of first sex.
Our analysis finds that the overall shares were close for women and men, at 58.1% and 60.2%. The group rows show more separation than the all-adult totals, especially for Black adults and for adults recorded as other or multiple race.
| Group | Women, sex before 18 | Men, sex before 18 |
|---|---|---|
| Black | 67.7% | 75.4% |
| White | 60.6% | 59.3% |
| Hispanic | 53.8% | 60.7% |
| Other or multiple race | 40.3% | 47.2% |
| All adults 25 to 44 | 58.1% | 60.2% |
Among women, the share was 67.7% for Black adults, 60.6% for White adults, 53.8% for Hispanic adults, and 40.3% for adults in the other or multiple race category. Groups other than Hispanic are non-Hispanic.
Among men, the share was 75.4% for Black adults, 60.7% for Hispanic adults, 59.3% for White adults, and 47.2% for adults in the other or multiple race category.
The survey does not record why groups differ, and we do not guess.
These figures describe differences in reported timing within this pooled sample. They say nothing about any one person.
Family Structure and First Sex
This measure uses adults 25 to 44 in the 2011 to 2019 survey who reported whether they had sex before 18.
The survey also asks whether each person lived with both biological or adoptive parents from birth to age 18. The results were linked with family structure for both women and men.
The comparison separates respondents into those who lived with both parents through age 18 and those who did not. It does not describe why a household changed, how long a change lasted, or what else was happening in a person’s life.
| Lived with both parents to 18 | Women, sex before 18 | Men, sex before 18 |
|---|---|---|
| Yes | 48.8% | 52.5% |
| No | 71.9% | 72.9% |
Among women who lived with both parents to 18, 48.8% had sex before 18. Among women who did not, the share was 71.9%.
The pattern was similar for men. The share was 52.5% for men who lived with both parents to 18 and 72.9% for men who did not.
This is an association, not a cause and effect finding. The survey cannot show that family structure causes earlier sex.
Family change and first sex can happen in either order, and many other things differ between these groups.
Read the table as a snapshot from this survey. It says nothing about any one family.
For teen relationships themselves, see what percent of high school relationships last.
What This Data Does Not Tell You
The NSFG uses a narrow survey definition.
In the NSFG, “first sex” means first vaginal intercourse with an opposite-sex partner. That definition says nothing about first oral sex, or first sex between two women or two men.
The survey population also has boundaries.
The figures come from people aged 15 to 49 in the United States, interviewed 2011 to 2019. They should not be read as a measure of teenagers or adults in other countries, or of every age group in the United States.
The ages are self-reported.
Respondents gave their answers from memory, and those answers are recorded as whole years. That means the data can show broad patterns by age, sex, and group, but it cannot pin down timing by month or exact birthday.
The age at first vaginal intercourse also does not tell us whether that first time was wanted. We did not analyze that question here.
These numbers are timing data only. They do not describe what someone’s first experience was like.
For the next milestone many people ask about, see our figures on the average marriage age.
Methodology and Sources
Our analysis used the public-use respondent files from the CDC National Survey of Family Growth for 2011 to 2013, 2013 to 2015, 2015 to 2017 and 2017 to 2019. The files include women and men aged 15 to 49, with 42,062 interviews in total.
The latest figures come from the 2017 to 2019 wave. Pooled figures use the official 2011 to 2019 weights published by the CDC’s National Center for Health Statistics, which cover ages 15 to 44.
To estimate the age distribution, we used a weighted survival estimate, Kaplan-Meier. People who have not had sex count until their current age, which keeps teenagers and young adults who are still in the survey from pulling the estimates downward simply by being young.
Group comparisons use adults aged 25 to 44. Margins of error use the survey’s own sampling design, so the uncertainty reflects the way the National Survey of Family Growth sampled respondents.
Before using the pipeline for this article, we checked it against a published CDC figure. The National Health Statistics Reports report on teenagers gives 40.5% of never-married girls and 38.7% of never-married boys aged 15 to 19 in 2015 to 2019, and our pipeline gives 40.5% and 38.7%.
We did not publish a birth-cohort trend. The youngest group’s figure moved by more than ten points depending on the age at which they were interviewed, so we compared the same age group across waves instead.
This choice keeps the main estimates tied to a federal survey with public documentation and public files. It also lets readers separate the survey result from the private polling and ranking material that often circulates online.
We also left out brand surveys, including Durex and Zava, as sources of figures. Country rankings were left out because they mix surveys with different questions, which would make side-by-side figures look more comparable than they are.



