


The median high school relationship lasts about 14 months, and roughly 60% of teenagers who are in a steady relationship are still in one a year later (Carver, Joyner and Udry, Add Health 2003; Meier and Allen, The Sociological Quarterly 2009). Duration climbs steeply with age: relationships reported by 12 to 13 year olds average 5 months, while those reported by 16 to 18 year olds average 20 months.
What almost nobody can tell you is the number people actually search for, which is the share of high school couples still together five or ten years later. No national survey has ever tracked a cohort of named high school couples that far. Every figure claiming to do so traces back to a single marketing blog post from 2017.
We aggregated data from the National Longitudinal Study of Adolescent to Adult Health, the CDC Youth Risk Behavior Survey, Monitoring the Future, the Pew Research Center, Bowling Green State University’s National Center for Family and Marriage Research, and peer-reviewed work in The Sociological Quarterly and the Journal of Social and Personal Relationships.
Key Takeaways
- The median adolescent romantic relationship runs 14 months, based on the Add Health national sample (Carver, Joyner and Udry, 2003).
- Average duration is 5 months at ages 12 to 13, 8 months at 14 to 15, and 20 months at 16 to 18 (Carver, Joyner and Udry, Add Health 2003).
- Nearly 60% of teenagers in a steady relationship at one interview were in a steady relationship a year later, the closest thing to a national survival rate that exists (Meier and Allen, The Sociological Quarterly 2009).
- Among teenagers who did change relationship status over that year, 71% moved forward and 29% moved backward (Meier and Allen, 2009).
- 35% of U.S. teenagers aged 13 to 17 had any romantic relationship experience; 64% had none (Pew Research Center, Teens, Technology and Romantic Relationships 2015).
- The share of 12th graders who report never dating rose from 14% in 1991 to 38% in 2013 (Child Trends analysis of Monitoring the Future).
- 56% of Gen Z adults say they had a romantic relationship as a teenager, against 78% of Baby Boomers (Survey Center on American Life, 2024).
- 3% of newly married men in 2018 married before turning 20, down from 18% in 1960 (NCFMR Family Profile FP-20-09, 2020).
- Marrying at 25 rather than 20 cuts divorce risk by more than half (Wolfinger, National Survey of Family Growth analysis, Institute for Family Studies 2015).
- 10.4% of high school students who dated in the past year experienced physical dating violence, and 5.9% experienced sexual dating violence (CDC Youth Risk Behavior Survey, 2023).
- The widely quoted claim that “only 2% of marriages are to a high school sweetheart” has no primary source. It originates in a 2017 marketing blog post and has been recycled ever since.
- Teenagers in a stable steady relationship were 1.9 times as likely to be married by ages 18 to 25 as those who were taking up dating for the first time (Meier and Allen, 2009).
1. How Long High School Relationships Actually Last
Mean and median tell different stories here, and the gap is the whole story. The Add Health median of 14 months sits above the average for every age band under 16, because a small number of long relationships among older teenagers pull the average up while the bulk of younger relationships end within a few months.
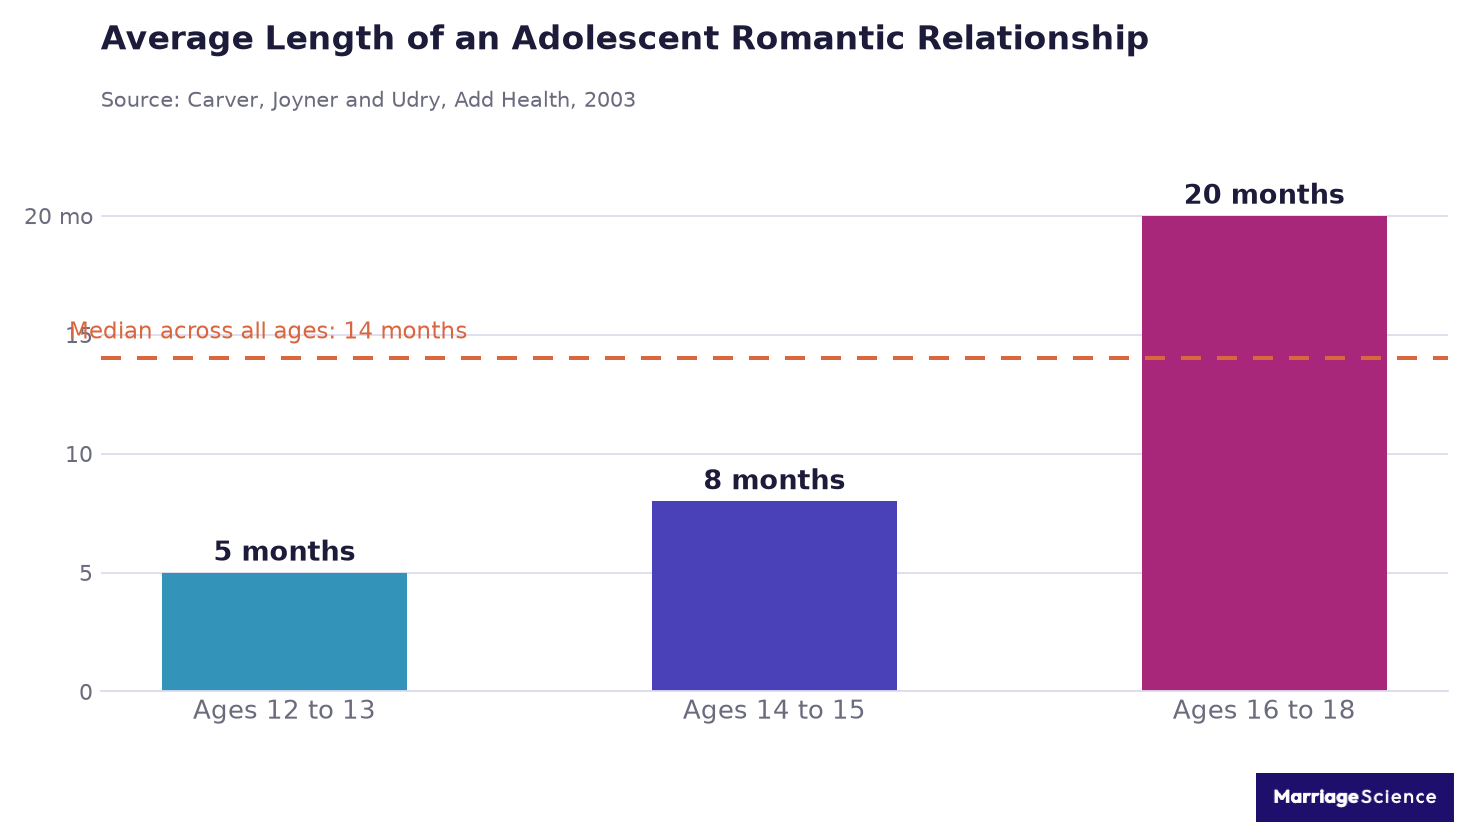
A 17 year old’s relationship lasts four times as long on average as a 12 year old’s. Age is the strongest single predictor of duration in every dataset that measures it.
| Metric | Value | Source |
| Median duration, adolescent romantic relationships | 14 months | Carver, Joyner and Udry, Add Health 2003 |
| Average duration, ages 12 to 13 | 5 months | Carver, Joyner and Udry, 2003 |
| Average duration, ages 14 to 15 | 8 months | Carver, Joyner and Udry, 2003 |
| Average duration, ages 16 to 18 | 20 months | Carver, Joyner and Udry, 2003 |
| Mean duration, women aged 14 to 17 (clinic-based sample) | 5.87 months (SD 11.76) | Hensel and O’Sullivan, Journal of Social and Personal Relationships 2022 |
| Sample size, Hensel and O’Sullivan duration study | 387 adolescent women | Hensel and O’Sullivan, 2022 |
| Reported duration, girls compared with boys | girls report longer relationships at every age | Carver, Joyner and Udry, 2003 |
The two duration figures in that table are not in conflict, though they look like it. Add Health asked a nationally representative sample about relationships they considered special, so it captured the serious end. Hensel and O’Sullivan followed 387 young women through every relationship they entered, including the brief ones, and the mean fell to under six months as a result (Hensel and O’Sullivan, 2022).
One study measured this properly on a national sample. Meier and Allen took 8,949 adolescents interviewed in 1995 and again in 1996, sorted them into four relationship states, and counted who was where a year later.
Of teenagers in a steady relationship at the first interview, close to 60% were in a steady relationship at the second. That is the number to quote when someone asks what percentage of high school relationships last, with one caveat attached: the survey cannot see whether it was the same partner.
| Metric | Value | Source |
| In a steady relationship at both interviews, one year apart | nearly 60% | Meier and Allen, The Sociological Quarterly 2009 |
| Reported no relationship at both interviews | about 70% | Meier and Allen, 2009 |
| One casual relationship who progressed to multiple or steady within a year | almost 60% | Meier and Allen, 2009 |
| Among those who changed state, share who progressed | 71% | Meier and Allen, 2009 |
| Among those who changed state, share who regressed | 29% | Meier and Allen, 2009 |
| Of teenagers who regressed, share not dating anyone at the second interview | about half | Meier and Allen, 2009 |
| Sample size, waves 1 and 2 | 8,949 adolescents | Meier and Allen, 2009 |
The one-year interval is the limitation everyone glosses over. A relationship that started and ended between the two interviews is invisible to the design, so the survival figure describes a status, and a teenager who broke up in March and started dating someone new in August counts as continuously steady (Meier and Allen, The Sociological Quarterly 50(2), 2009). Anyone quoting a couple-level survival rate for high school relationships is quoting something no one has measured.
Two other cells in the same table are worth pulling out. Among teenagers juggling multiple partners at the first interview, 53% had settled into one steady relationship a year later, and among the subset of them who changed at all, 77% moved toward more commitment.
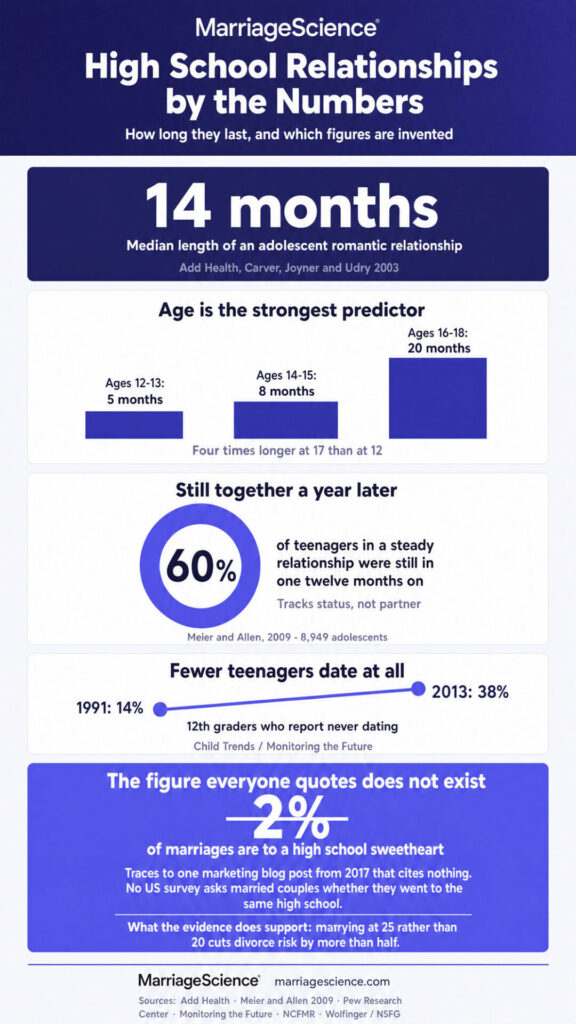
The backward movers are a smaller and more mixed group than the label suggests. About half of them were not dating anyone at the second interview, and a quarter of everyone who moved backward had been in a steady relationship the year before, which is what a breakup looks like in this data.
So the honest answer to the question in the title has two halves. Over a single year, most steady teenage relationships persist as steady relationships. Over the four years of high school, nobody has counted.

3. How Many Teenagers Are Dating at All
Every duration figure above describes the teenagers who are dating, and that group has been shrinking for thirty years. The decline began in the early 1990s, well before smartphones, and it accelerated after 2005.
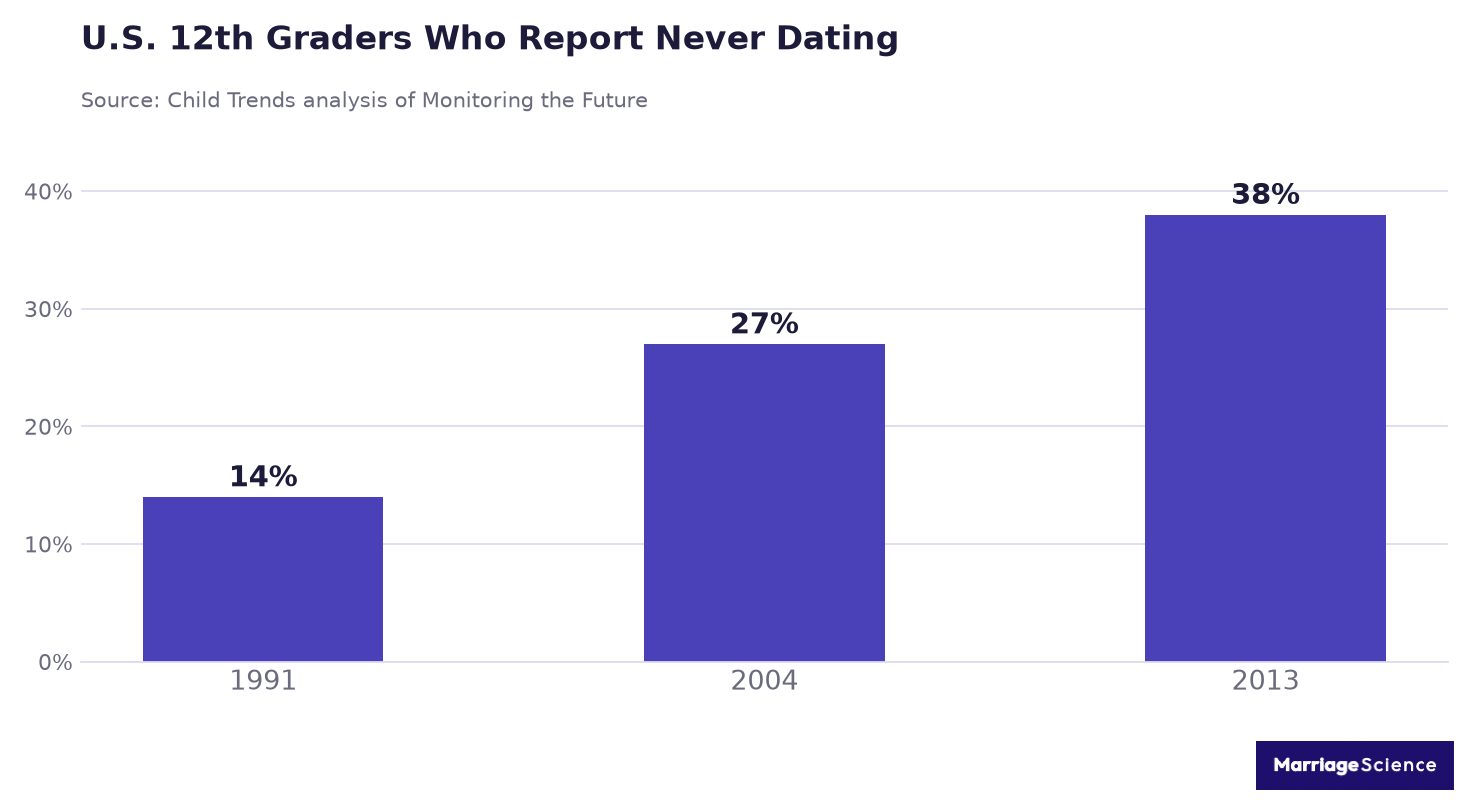
The share of high school seniors who have never dated nearly tripled between 1991 and 2013. Pew found the same thing from the other direction: two thirds of teenagers had no romantic relationship experience of any kind.
| Metric | Value | Source |
| Teenagers aged 13 to 17 with any romantic relationship experience | 35% | Pew Research Center, 2015 |
| Teenagers who had never been in a romantic relationship | 64% | Pew Research Center, 2015 |
| Currently in a relationship they call serious | 14% | Pew Research Center, 2015 |
| Any romantic experience, ages 15 to 17 | 44% | Pew Research Center, 2015 |
| Any romantic experience, ages 13 to 14 | 20% | Pew Research Center, 2015 |
| 12th graders who report never dating, 1991 and 2013 | 14% and 38% | Child Trends analysis of Monitoring the Future |
| 8th graders who report never dating, 2004 | 51% | Child Trends analysis of Monitoring the Future |
| Gen Z adults who had a teenage romantic relationship | 56%, against 78% of Baby Boomers | Survey Center on American Life, 2024 |
| Gen Z men who had no teenage relationship | 44% | Survey Center on American Life, 2024 |
Treat the generational row with care. It asks adults in their twenties and adults in their seventies to recall their own teenage years, and recall improves the story people tell about themselves (Survey Center on American Life, 2024). The Monitoring the Future series avoids that problem by asking teenagers while they are still teenagers, and it points the same direction. Our Gen Z dating statistics page follows this cohort into adulthood.
4. Do High School Relationships Turn Into Marriages
Teenage marriage has almost disappeared in the United States, which removes the most direct route from a high school relationship to a wedding. What used to be a common life sequence is now a rounding error in the marriage certificates.
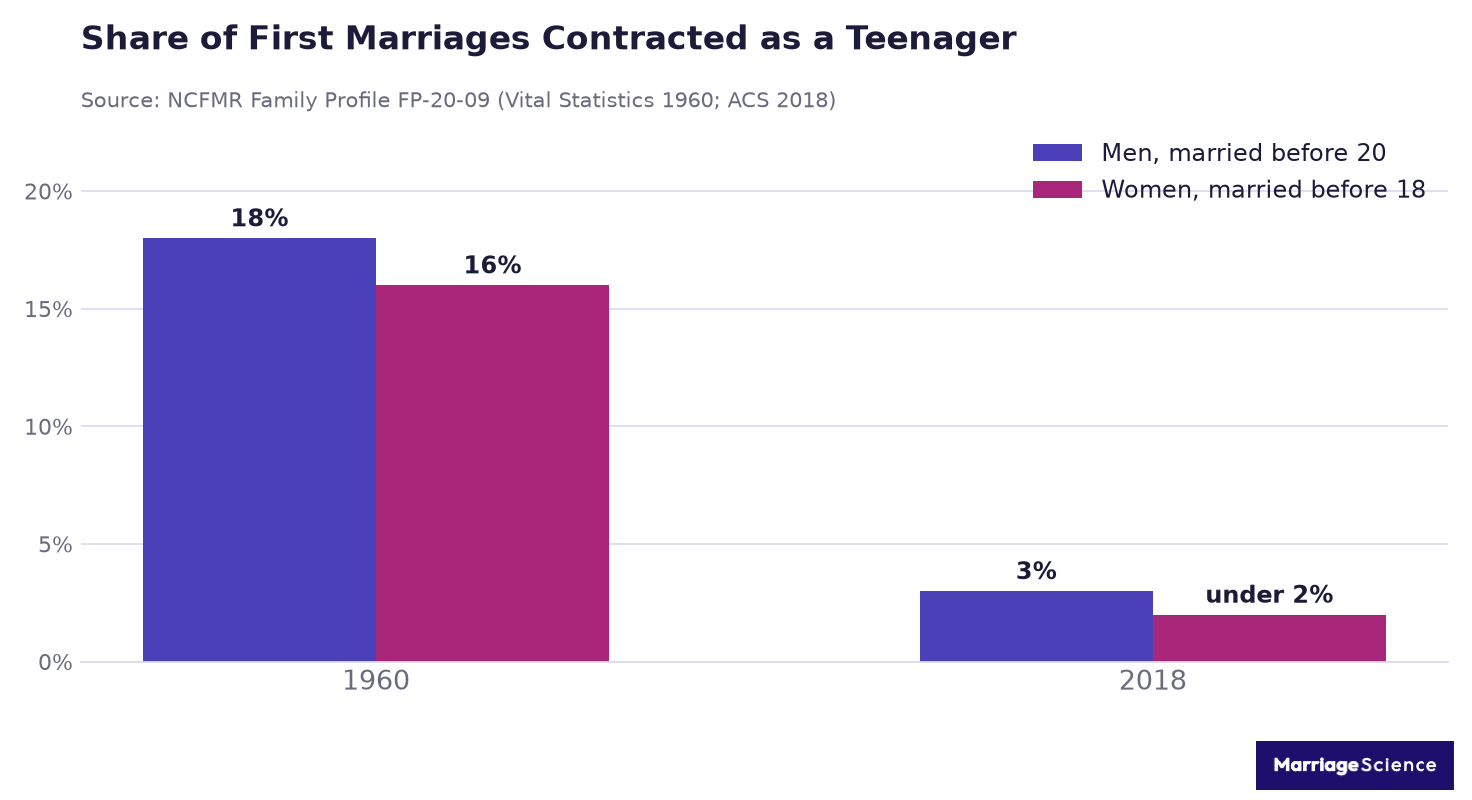
In 1960, 18% of newly married men had married before turning 20. By 2018 that was 3%. Among women, first marriages before 18 fell from 16% to under 2% over the same period.
| Metric | Value | Source |
| Newly married men who married before age 20, 1960 | 18% | NCFMR Family Profile FP-20-09, 2020 |
| Newly married men who married before age 20, 2018 | 3% | NCFMR FP-20-09, 2020 |
| Women in first marriages who married before 18, 1960 and 2018 | 16% and under 2% | NCFMR FP-20-09, 2020 |
| Men marrying for the first time at 30 or older, 1960 and 2018 | 11% and 49% | NCFMR FP-20-09, 2020 |
| Lowest state median age at first marriage, 2023 (Utah) | 26.8 for men, 25.2 for women | NCFMR Family Profile FP-25-09, 2025 |
| Odds of being married by ages 18 to 25 for teenagers in a stable steady relationship | 1.9x | Meier and Allen, 2009 |
| Odds of ever cohabiting for teenagers who had no adolescent relationships | 0.58x | Meier and Allen, 2009 |
| Couples who met through friends, 2009 and 2017 | 36.4% and 28.6% | Rosenfeld, Thomas and Hausen, PNAS 2019 |
The last row is there because people keep asking for a “met in high school” percentage, and How Couples Meet and Stay Together does not publish one as a standalone series. What it does show is that the settings which used to produce teenage couples have lost ground to online meeting, which overtook meeting through friends around 2013 (Rosenfeld, Thomas and Hausen, PNAS 2019). Our marriage statistics roundup tracks age at first marriage in more detail.
5. The Numbers Everyone Quotes That Nobody Can Source
Search this topic and the same four figures come back on page after page, usually without a link. We traced each one. All four lead to a single blog post published in May 2017 by a marketing site, which cites nothing.
| Claim | Where It Actually Comes From | Status |
| “Less than 2% of marriages are to a high school sweetheart” | BrandonGaille.com, May 2017 | No primary source. Not found in Census, ACS, NSFG or HCMST. |
| “High school sweethearts who marry as teenagers have a 54% chance of lasting 10 years” | Same 2017 post | No study cited. No dataset identified that could produce it. |
| “Those who wait until 25 have a 78% ten-year success rate” | Same 2017 post | No study cited. Directionally consistent with Wolfinger, but the figure itself is unsupported. |
| “82% of high school sweethearts report high marital satisfaction, against 65% of couples who meet later” | Circulates as “a 2022 study” | No such study located in PubMed, PsycINFO or the family-science journals. |
| “48% of high school sweethearts divorce within 20 years” | Circulates unattributed across aggregator sites | Resembles general 20-year divorce estimates, not a sweetheart-specific finding. |
What the real literature supports is narrower and duller. Age at marriage predicts divorce risk: each additional year before roughly 32 cuts the odds of divorce by 11%, and someone marrying at 25 is over 50% less likely to divorce than someone marrying at 20 (Wolfinger, Institute for Family Studies, 2015, using the National Survey of Family Growth).
That is a statement about age, not about where a couple met. A pair who met at 16 and married at 27 carry the risk profile of 27 year olds. Our divorce statistics page covers the national rates those percentages sit against.
There is a structural reason the 2% figure cannot be checked. Federal marriage data records the ages of the two people and the date, and no American survey asks married couples whether they attended the same high school. How Couples Meet and Stay Together comes closest by asking where partners first met, and its published categories do not isolate secondary school.
A quick test for any statistic on this topic: ask which survey could have produced it. If the answer is none of Add Health, the ACS, the National Survey of Family Growth, Monitoring the Future or HCMST, the number was invented somewhere along the chain.
6. What Predicts Whether a High School Relationship Lasts
The predictor literature for adolescent relationships is thin compared with what exists for marriage. One survival analysis carries most of the weight, and it followed young women only.
Prior relationship experience predicted longer relationships, which is the opposite of what the “playing the field” framing assumes. Teenagers with more previous partners and more accumulated time in relationships stayed in their current one longer.
| Metric | Value | Source |
| More prior relationships and time in them | longer current relationship | Hensel and O’Sullivan, 2022 |
| Older age at the start of the relationship | longer time to breakup | Hensel and O’Sullivan, 2022 |
| Higher reported relationship quality | longer time to breakup | Hensel and O’Sullivan, 2022 |
| Sexual communication and sexual autonomy | longer time to breakup | Hensel and O’Sullivan, 2022 |
| Status changes during the relationship (promotions and demotions) | longer time to breakup | Hensel and O’Sullivan, 2022 |
| Relationship progression to steady during adolescence | 6x odds of emotional intimacy in the most recent relationship | Meier and Allen, 2009 |
| Black, Asian and lower-income adolescents | less likely to report any relationship, more likely to go straight to steady if involved | Meier and Allen, 2009 |
The status-change finding is the strange one. Relationships that were repeatedly redefined, upgraded and downgraded lasted longer than relationships that held a fixed label, which the authors read as evidence of active negotiation between the partners. It has not been replicated in a mixed-sex sample.
7. Dating Violence and Relationship Quality in High School
The CDC asks about dating violence only of students who dated or went out with someone during the 12 months before the survey, so the percentages below describe teenagers who were in relationships, not all high school students.
10.4% of high school students who dated in the past year reported being physically hurt on purpose by someone they were dating. Sexual dating violence was reported by 5.9%.
| Metric | Value | Source |
| Physical dating violence, past 12 months, among students who dated | 10.4% | CDC Youth Risk Behavior Survey, 2023 |
| Sexual dating violence, past 12 months, among students who dated | 5.9% | CDC YRBS, 2023 |
| Physical dating violence, female and male students | 11.4% and 9.3% | CDC YRBS, 2023 |
| Physical dating violence, LGB and heterosexual students | 16.2% and 7.8% | CDC YRBS, 2023 |
| Sexual dating violence, LGB and heterosexual students | 11.6% and 4.3% | CDC YRBS, 2023 |
| Trend, 2013 to 2023 | sexual dating violence down; physical dating violence unchanged | CDC YRBS Data Summary and Trends Report, 2013 to 2023 |
| High school students who have ever had sexual intercourse, 2013 and 2023 | 47% and 32% | CDC YRBS, 2023 |
| Teen daters aged 15 to 17 who reported having had sex, 2015 | 36% | Pew Research Center, 2015 |
Both dating-violence measures rest on a self-report question answered in a classroom, and the YRBS response rate has been falling, which researchers have flagged as a source of bias in trend estimates (CDC, YRBS Data Summary and Trends Report 2013 to 2023). The direction of the sexual-violence decline has held across several cycles.
Readers looking for the behavioral markers behind these numbers can start with our guide to relationship red flags. If you are a teenager in an unsafe relationship, the National Domestic Violence Hotline runs a service for young people at loveisrespect.org.
Summary: High School Relationships by the Numbers
| Metric | Value | Source |
| Median duration, adolescent romantic relationships | 14 months | Carver, Joyner and Udry, Add Health 2003 |
| Average duration, ages 16 to 18 | 20 months | Carver, Joyner and Udry, 2003 |
| Average duration, ages 14 to 15 | 8 months | Carver, Joyner and Udry, 2003 |
| Average duration, ages 12 to 13 | 5 months | Carver, Joyner and Udry, 2003 |
| Mean duration, adolescent women tracked relationship by relationship | 5.87 months | Hensel and O’Sullivan, JSPR 2022 |
| Still in a steady relationship one year later | nearly 60% | Meier and Allen, Sociological Quarterly 2009 |
| Still single one year later, among those with no relationship | about 70% | Meier and Allen, 2009 |
| Progressed rather than regressed, among those who changed state | 71% vs 29% | Meier and Allen, 2009 |
| Teenagers with any romantic relationship experience | 35% | Pew Research Center, 2015 |
| Teenagers with no romantic relationship experience | 64% | Pew Research Center, 2015 |
| Any romantic experience, ages 15 to 17 | 44% | Pew Research Center, 2015 |
| 12th graders who report never dating, 1991 and 2013 | 14% and 38% | Child Trends analysis of Monitoring the Future |
| Gen Z adults who dated as teenagers, against Baby Boomers | 56% and 78% | Survey Center on American Life, 2024 |
| Newly married men who married before 20, 1960 and 2018 | 18% and 3% | NCFMR FP-20-09, 2020 |
| Women in first marriages who married before 18, 1960 and 2018 | 16% and under 2% | NCFMR FP-20-09, 2020 |
| Reduction in divorce odds per year of age at marriage, up to about 32 | 11% per year | Wolfinger, NSFG analysis, 2015 |
| Odds of marrying by 18 to 25 after a stable steady adolescent relationship | 1.9x | Meier and Allen, 2009 |
| Physical dating violence, past 12 months, among students who dated | 10.4% | CDC YRBS, 2023 |
| Sexual dating violence, past 12 months, among students who dated | 5.9% | CDC YRBS, 2023 |
| High school students who have ever had sex, 2013 and 2023 | 47% and 32% | CDC YRBS, 2023 |
Methodology and Sources
Every figure here traces to a federal survey, a longitudinal research programme or a peer-reviewed paper. We excluded aggregator “statistics” pages, and section 5 documents what happened when we tried to trace the four claims that dominate search results for this topic.
- K. Carver, K. Joyner and J. R. Udry, National Estimates of Adolescent Romantic Relationships, in P. Florsheim (ed.), Adolescent Romantic Relations and Sexual Behavior, 2003, using Add Health.
- A. Meier and G. Allen, Romantic Relationships from Adolescence to Young Adulthood, The Sociological Quarterly 50(2), 2009.
- D. J. Hensel and L. F. O’Sullivan, What Makes Them Last?, Journal of Social and Personal Relationships, 2022.
- Pew Research Center, Teens, Technology and Romantic Relationships, 2015. Survey of 1,060 teenagers aged 13 to 17, margin of error 3.7 points.
- Child Trends, analysis of Monitoring the Future on the rise in non-daters.
- Survey Center on American Life, Gen Z’s Romance Gap, 2024.
- NCFMR, Bowling Green State University, Distributions of Age at First Marriage, 1960 to 2018 (FP-20-09) and Median Age at First Marriage: Geographic Variation (FP-25-09).
- N. Wolfinger, age at marriage and divorce risk, Institute for Family Studies, analysis of the National Survey of Family Growth.
- M. Rosenfeld, R. Thomas and S. Hausen, Disintermediating Your Friends, PNAS 116, 2019.
- CDC, Youth Risk Behavior Survey Data Summary and Trends Report, 2013 to 2023.
What these figures do not measure: whether a specific couple stayed together after graduation. The two datasets that could answer it, Add Health and Monitoring the Future, either stopped following relationships at the individual level or never asked about partners at all.
The Add Health duration figures come from fieldwork carried out in 1995 and 1996. We flag that openly, because no nationally representative American survey has measured adolescent relationship duration since. The most likely sources of newer numbers are the next YRBS cycle and further waves of the Toledo Adolescent Relationships Study. We update this page annually. The rest of our research sits on the Marriage Science statistics hub.



