


Search for what a divorce costs and almost every answer descends from one place, a survey Martindale-Nolo Research ran in 2019.
The survey’s own methodology note says the respondents were “readers who had recently gone through a divorce and had voluntarily provided their email when they researched hiring a lawyer”. No sample size is published anywhere on the page.
The figure everyone quotes from it is the mean, $11,300 in attorneys’ fees. The median in the same survey is $7,000. The survey is seven years old, and the BLS legal services price index rose 25.4% between December 2019 and September 2024.
Of the 15 top-ranking pages we downloaded and tested, none cite federal wage data, none cite the legal services price index, none cite the Census, and only four name the survey their number comes from.
This page traces the quoted numbers to their source, then uses federal data for the parts the survey does not measure. It uses the Bureau of Labor Statistics wage survey for what a lawyer earns in each state, and Census microdata for what the people actually divorcing earn.
There is no single national answer to what a divorce costs. Legal prices, local lawyer pay and the finances of the households involved all move independently of each other.
How many marriages end, and when, is a separate question. Our roundup of divorce statistics covers how many marriages end and when.
Divorce Cost Facts and Statistics
Divorce cost numbers come from lawyer bills, court fee schedules, price indexes, wage data, and household surveys. The most useful figures separate the price of representation from filing fees and show how much trial activity changes the bill.
- The most quoted figure, average attorneys’ fees of $11,300 for full-scope representation, comes from Martindale-Nolo Research’s 2019 divorce survey.
- In the same survey the median was $7,000, and 42% of people who hired a lawyer paid $5,000 or less.
- The respondents were Nolo readers who had volunteered an email while researching how to hire a lawyer. No sample size is published.
- Average total cost rose with how far the case went: $4,100 uncontested, $10,600 disputed then settled, $20,400 for a trial on one issue, and $23,300 for a trial on two or more.
- People who used no lawyer at all reported a mean total of $925 and a median of $300.
- The lawyers in that survey reported an average rate of $270 an hour. 69% of clients paid $200 to $300, and 20% paid $400 or more.
- The BLS legal services price index rose 25.4% between December 2019 and September 2024, so the 2019 median of $7,000 is about $8,780 in September 2024 prices.
- From December 1997 to September 2024, BLS price data show legal services rose 172.9% against 95.5% for all consumer prices.
- September 2024 is the last published value of the BLS legal services price index. The next entry, October 2025, is marked unavailable because of the 2025 lapse in appropriations.
- BLS counted 754,500 lawyers in May 2025, with an annual median wage of $159,670 and an hourly median of $76.76.
- Our own analysis of the BLS May 2025 wage files puts lawyer median pay from $207,860 in New York to $91,690 in Mississippi, a 2.27 times spread.
- Measured against each state’s own median hourly wage, a lawyer’s hour runs from 3.48 times in New York to 1.99 times in Wyoming. Nationally it is 3.13 times.
- California charges $435 to file a dissolution petition and $435 to respond, so a couple pays $870 before anything else under the Judicial Council statewide fee schedule effective 1 January 2026.
- Illinois sets court fees by circuit: $388 plus a $250 appearance in Cook County against $314 plus $194 for an answer in Madison County.
- The 2024 American Community Survey counted 1,868,585 Americans who divorced in the 12 months before the survey.
- Our own analysis of the 2024 American Community Survey microdata finds 33.7% of them lived below 200% of the federal poverty line, the income test California and Florida use to waive court fees.
Where the $11,300 Average Comes From
The $11,300 figure that appears across divorce cost articles comes from Nolo. More exactly, it comes from Martindale-Nolo Research‘s 2019 divorce survey. The number is a mean for attorneys’ fees, and it is often repeated without the survey year or the sampling limits that sit behind it.
Nolo gives this methodology note at the bottom of its own page:
“The survey results mentioned in this article came from Martindale-Nolo Research’s 2019 divorce survey, which analyzed responses from readers who had recently gone through a divorce and had voluntarily provided their email when they researched hiring a lawyer.”
Nolo, methodology note at bottom of page
That sentence matters because it tells readers what kind of sample produced the number. First, the sample is self selected. The respondents were readers who chose to give an email address and then answered a survey after a divorce.
Second, the population is people already shopping for an attorney. The sentence says respondents had provided their email when they researched hiring a lawyer. That is a narrower group than all people who divorce, including people who file on their own, settle without court fights, or use limited legal help.
Third, the page publishes no sample size. A reader can see the results, including the mean and median attorneys’ fees, but the public page does not say how many survey responses were analyzed. Without that count, the reader cannot judge how much weight to put on the survey as a description of divorce costs outside that reader group.
The lawyer rate data has a separate source note on the same page. Nolo says it comes from “a database of attorneys who claimed their profiles on Avvo.com and provided information about their practice”. In plain terms, that is lawyers typing their own rates into a directory listing.
That does not make the rates useless. It does mean the rates are not a court record, a billing audit, or a random sample of every family lawyer. They are self reported rates from lawyers who claimed online profiles and filled in practice information.
There is also a business context. Martindale-Nolo is a legal marketing business whose customers are law firms buying leads. A marketing company can still publish real survey results, but readers should know that the publisher is part of the lawyer referral market whose prices it is describing.
The cleanest reading is limited and practical. The numbers are not invented. They describe the bills of people who hired a lawyer after shopping for one online, and they cannot describe what a divorce costs in general.
This distinction gets lost when the figure travels. Of the 15 top-ranking pages we tested, 4 name Martindale-Nolo at all. Two of those date the survey to 2019, one dates it to 2021, and one gives no year. That makes the $11,300 number look more like a current national price tag than the mean from one legal marketing survey with a narrow intake path.
The same source also gives a median attorneys’ fee figure and a share who paid $5,000 or less. Those numbers are useful because they show the mean is pulled by higher bills. A mean of $11,300 sits beside a median of $7,000, so the typical survey respondent paid less than the average.
On this page the $11,300 number is treated as one published survey result rather than as the price of a divorce. The table below keeps the attribution attached to each figure.
| Metric | Value | Source |
| Attorneys’ fees, mean | $11,300 | Martindale-Nolo, 2019 |
| Attorneys’ fees, median | $7,000 | Martindale-Nolo, 2019 |
| Paid $5,000 or less | 42% | Martindale-Nolo, 2019 |
| Average hourly rate reported by lawyers | $270 | Martindale-Nolo, 2019 |
| Published sample size | None | Martindale-Nolo, 2019 |
The Median Is $7,000, and Almost Nobody Prints It
The headline number from the Martindale-Nolo survey is the mean attorneys’ fees figure, $11,300. On the same page, from the same survey, Nolo also gives the median, $7,000. That second number is the one a reader needs first, because divorce costs do not cluster neatly around the average.
Nolo explains the gap in plain terms on that page. A few people with very high costs can skew the average, so Nolo gives the median for that reason. The median is the middle of the group. It is less moved by a small set of expensive cases, and it is a better starting point when the bill can swing from a simple filing to a trial.
The survey gives another clue about the shape of the data. Among people who hired a lawyer, 42% paid $5,000 or less in attorneys’ fees. That finding sits awkwardly beside a mean of $11,300, unless the expensive end is pulling the average upward. The distribution is wide and skewed, so a single average is close to useless by itself.
The same pattern appears when the lawyer role changes. Only 1 in 10 people hired a consulting lawyer instead of a lawyer for full representation. Those who used a consulting lawyer paid a mean of $4,600 and a median of $3,000. On costs other than the lawyer, people who had one reported a mean of $1,480 and a median of $500.
The no-lawyer group shows the same split in smaller dollars. People who used no lawyer at all had a mean total cost of $925 and a median of $300. That does not mean every no-lawyer divorce is cheap. It means the middle case in that group was far below its own average.
The case path changes the total more sharply. Nolo reports average total cost of $4,100 for uncontested cases, $10,600 for cases that were disputed and then settled, $20,400 for a trial on one issue, and $23,300 for a trial on two or more issues. Nolo’s own reading is that the exact nature of the disagreements made very little difference. What moved the total was the number of contested issues and whether the case went to trial.
That is why median disclosure matters. Of the 15 top-ranking pages we tested, 3 give a median at all. Without it, the reader sees a large average and misses the shape of the bill.
The table below keeps those routes separate. Its source is Martindale-Nolo Research, 2019.
| Route through the case | Average total cost | Median where published |
| No lawyer | $925 | $300 |
| Consulting lawyer only | $4,600 | $3,000 |
| Lawyer, uncontested | $4,100 | not published |
| Lawyer, disputed then settled | $10,600 | not published |
| Trial on one issue | $20,400 | not published |
| Trial on two or more issues | $23,300 | not published |
Those Prices Are Seven Years Old
Those divorce cost numbers need a calendar attached to them. The survey was run in 2019, yet pages published in 2026 still quote its output without a date. A reader can come away thinking the dollar amounts describe the price of a divorce now.
The clean correction is to use the legal services line in the BLS Consumer Price Index. The series is CUUR0000SEGD01. Its December 2019 reading was 364.384, and its September 2024 reading was 457.042. That is a rise of 25.4%.
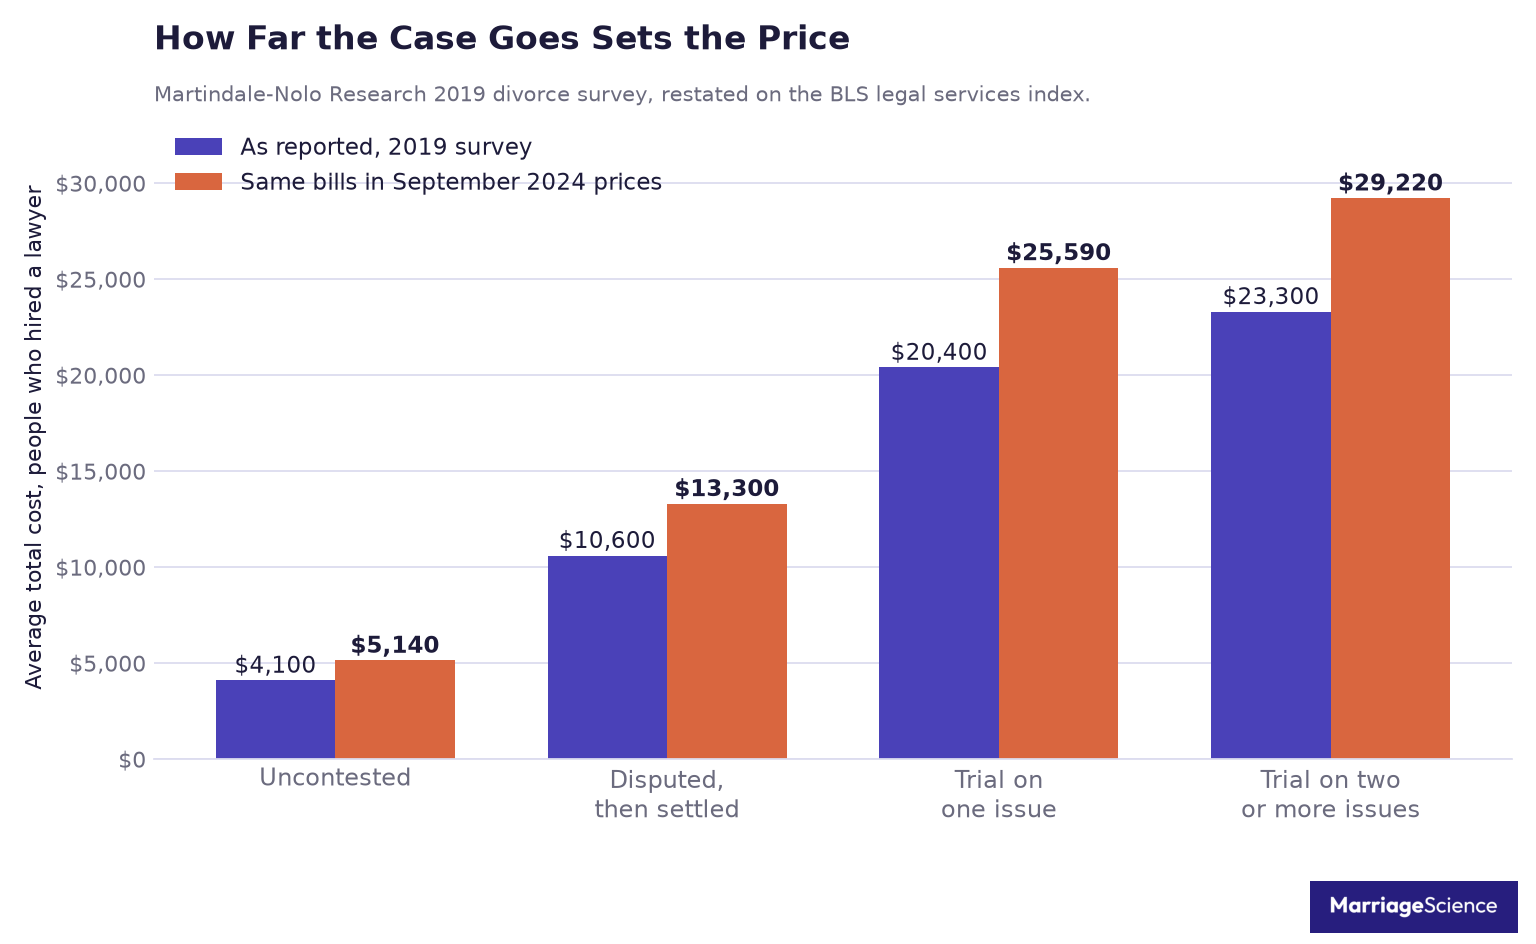
For this section, we restate the survey as if the reported prices were December 2019 prices. That is conservative, because the survey asked people who had “recently gone through a divorce”, which means some of the bills were older still. The adjustment does not make the survey better. It only puts the old dollar amounts into September 2024 prices.
Here is the same Martindale-Nolo cost set, first as reported, then restated with that legal services CPI adjustment. These restated figures are ours, an inflation adjustment and nothing more.
| Martindale-Nolo 2019 | As reported | In September 2024 prices |
| Attorneys’ fees, mean | $11,300 | $14,170 |
| Attorneys’ fees, median | $7,000 | $8,780 |
| Uncontested, total | $4,100 | $5,140 |
| Settled after a dispute | $10,600 | $13,300 |
| Trial on one issue | $20,400 | $25,590 |
| Trial on two or more issues | $23,300 | $29,220 |
| No lawyer, median | $300 | $380 |
The table changes the scale of the headline numbers. The reported mean attorneys’ fees of $11,300 become about $14,170. The reported median fees of $7,000 become about $8,780. A trial on two or more issues moves from $23,300 to about $29,220.
These figures do not fix the sampling problem. They do not verify the underlying bills, and they do not turn a reader survey into a billing database. They only correct the calendar, which is still necessary when a 2019 survey is being quoted in 2026 as though the old dollars are current.
The Nolo page partly concedes the point. It tells readers that average hourly rates “are likely to be higher now” and points them to Clio, described on the page as a legal technology company, for a family law rate of $312 an hour in 2023. Clio sells practice management software to law firms. That source context matters when the page is used to price a divorce.
Legal Prices Have Outrun Everything Else Since 1997
Divorce costs are paid in local courthouses and private offices, but the long price record comes from a national index. The Bureau of Labor Statistics tracks legal services as series CUUR0000SEGD01 and all items as series CUUR0000SA0 in the Consumer Price Index for All Urban Consumers.
An index level is a price measure. It is no substitute for a legal invoice or a retainer figure, and it is useful for one reason only, which is that it compares legal prices with the broader consumer basket over the same period using the same federal price program.
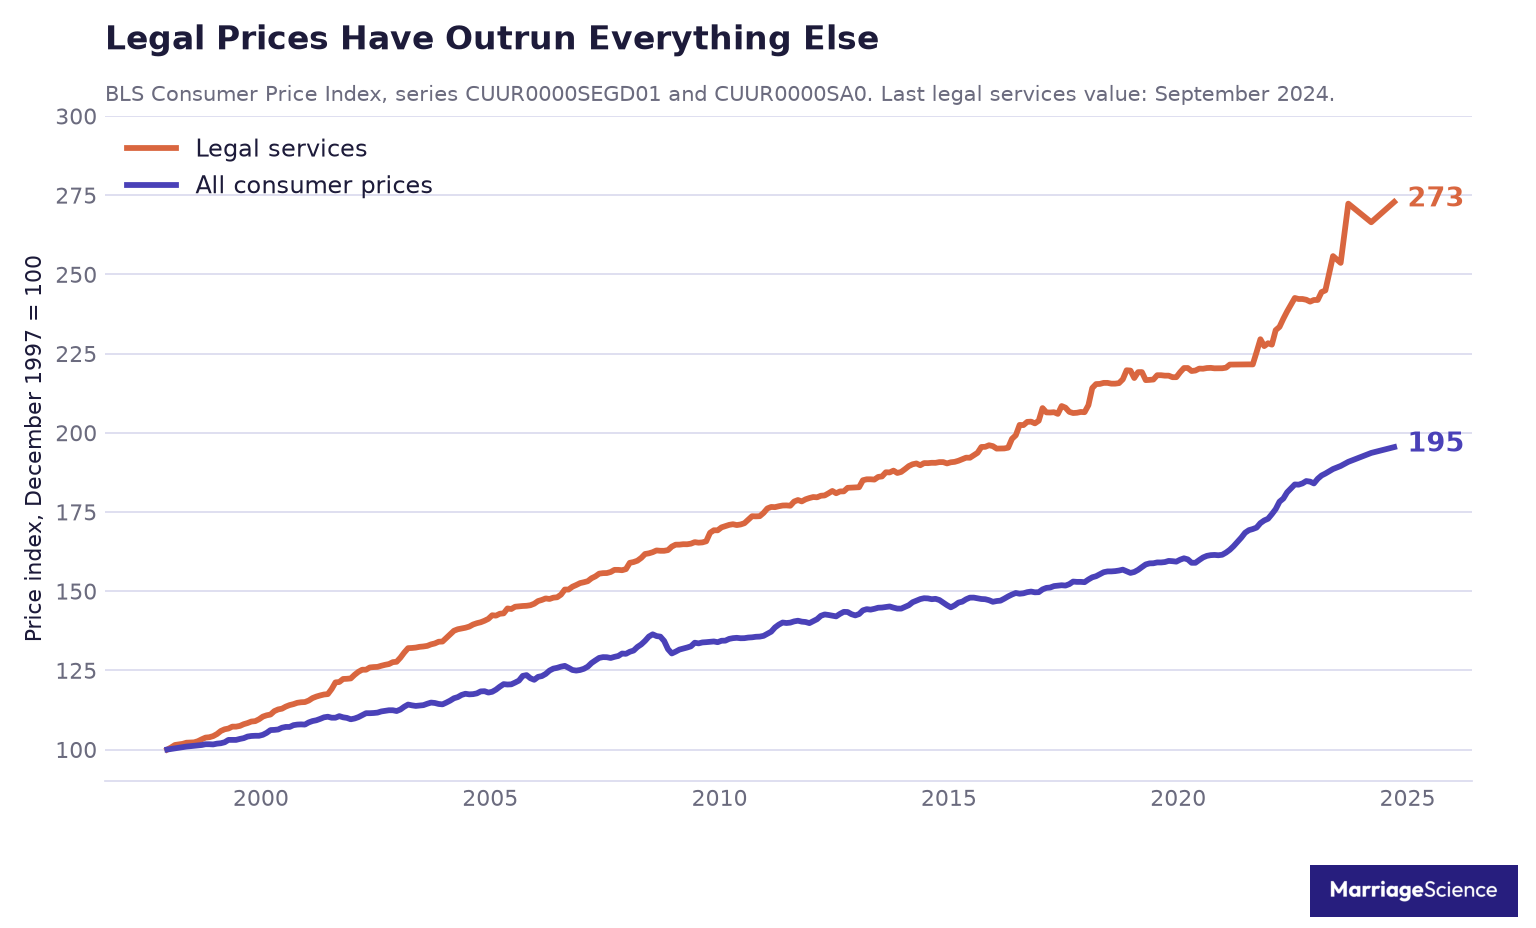
In December 1997, the legal services index was 167.5. The all items index was 161.3. By September 2024, legal services had reached 457.042, while all items had reached 315.301.
Over that window, legal services rose 172.9% and all consumer prices rose 95.5%. Using those index levels, our calculation puts legal services 39.6% ahead of everything else in the basket.
That comparison helps explain why divorce legal bills can feel detached from ordinary household inflation. Part of the pressure is coming from the legal services category itself, over and above the price increases that affect groceries, rent, transport and other daily costs.
The series also has a data problem at the end. The collection thinned before it stopped producing published values. In 2023, the index carries readings for January, February, March, May, July and September. In 2024, it carries March and September only.
September 2024 is the last published value. The next entry in the file is October 2025, where the value is a dash and the footnote reads, “Data unavailable due to the 2025 lapse in appropriations”.
The file, taken on its own terms, says that the only official price index for legal services in the United States has not produced a number in almost two years, and by the end it was being collected twice a year. That does not change the long term comparison through September 2024. It does mean the public price record for legal services is no longer giving the same regular signal it once gave.
What a Divorce Lawyer Earns in Every State
This section is built from the Bureau of Labor Statistics Occupational Employment and Wage Statistics files for May 2025, occupation 23-1011 Lawyers. The national file reports 754,500 lawyers employed, with an annual median wage of $159,670 and an annual mean of $185,840. The source is the BLS lawyers page.
The hourly numbers give another view of the same labor market. The national hourly median is $76.76. The tenth percentile is $37.67 an hour, and the ninetieth percentile is $169.04. Those figures describe wages paid to lawyers across the occupation, before any client billing markup.
All 50 states and the District of Columbia publish both an employment estimate and a median wage for this occupation. There is no missing state in this dataset, because lawyers are licensed under one occupational title everywhere. That makes the wage file unusually clean for a state comparison.
| State | Lawyers Employed | Annual Median Wage | Hourly Median | Source |
| New York | 91,870 | $207,860 | $99.93 | BLS OEWS, May 2025 |
| District of Columbia | 33,070 | $195,190 | $93.84 | BLS OEWS, May 2025 |
| California | 95,770 | $195,080 | $93.79 | BLS OEWS, May 2025 |
| Massachusetts | 23,560 | $176,680 | $84.94 | BLS OEWS, May 2025 |
| Texas | 56,580 | $154,200 | $74.13 | BLS OEWS, May 2025 |
| Florida | 55,210 | $133,180 | $64.03 | BLS OEWS, May 2025 |
| North Carolina | 17,000 | $127,710 | $61.40 | BLS OEWS, May 2025 |
| Kentucky | 5,770 | $101,550 | $48.82 | BLS OEWS, May 2025 |
| Arkansas | 3,430 | $98,880 | $47.54 | BLS OEWS, May 2025 |
| Mississippi | 3,100 | $91,690 | $44.08 | BLS OEWS, May 2025 |
The wage spread is large. New York has the highest state median at $207,860, while Mississippi has the lowest at $91,690, a spread of 2.27 times. California employs the most lawyers, 95,770, and Wyoming employs the fewest, 900.
First caveat. The occupation covers every lawyer in the country, family practice included, and BLS does not break out practice areas by state. A state wage estimate can combine lawyers with very different work, seniority, employer types, and pay structures inside one occupational line.
Second, and more important, the survey measures wages paid to employed lawyers. It does not measure the rate a client is billed. A billing rate also has to cover rent, staff, insurance, malpractice cover and profit, so the wage is a floor under the price.
That distinction matters when reading divorce cost numbers. The employee wage tells what the labor market pays a lawyer. It does not tell what a client will see on an invoice, what a firm requires as a retainer, or how much time a contested case will consume.
The table uses annual median wage as the sorting column because the median is less pulled by top earners than the mean. The national annual mean, $185,840, is higher than the annual median, $159,670, which is consistent with a profession that has a high paid upper tail.
State wage data should be read beside legal process and family structure data. A high wage state can still have a different mix of filings, settlement patterns and household finances.
Wages differ by job as well as by state. Our study of the divorce rate by occupation uses Census microdata to compare marriages across the same occupational codes BLS uses here.
Against Local Pay, the Gap Between States Narrows
Sticker hourly rates make New York and California look far away from the rest of the country. A local-pay view narrows that gap. It asks how expensive a lawyer is against the paychecks in the same state, which is the comparison a client actually feels.
This is our second original measure. We divide each state’s median hourly wage for lawyers by the same state’s median hourly wage across all occupations. The result answers how many hours a median local worker works to cover one hour of a median local lawyer’s pay.
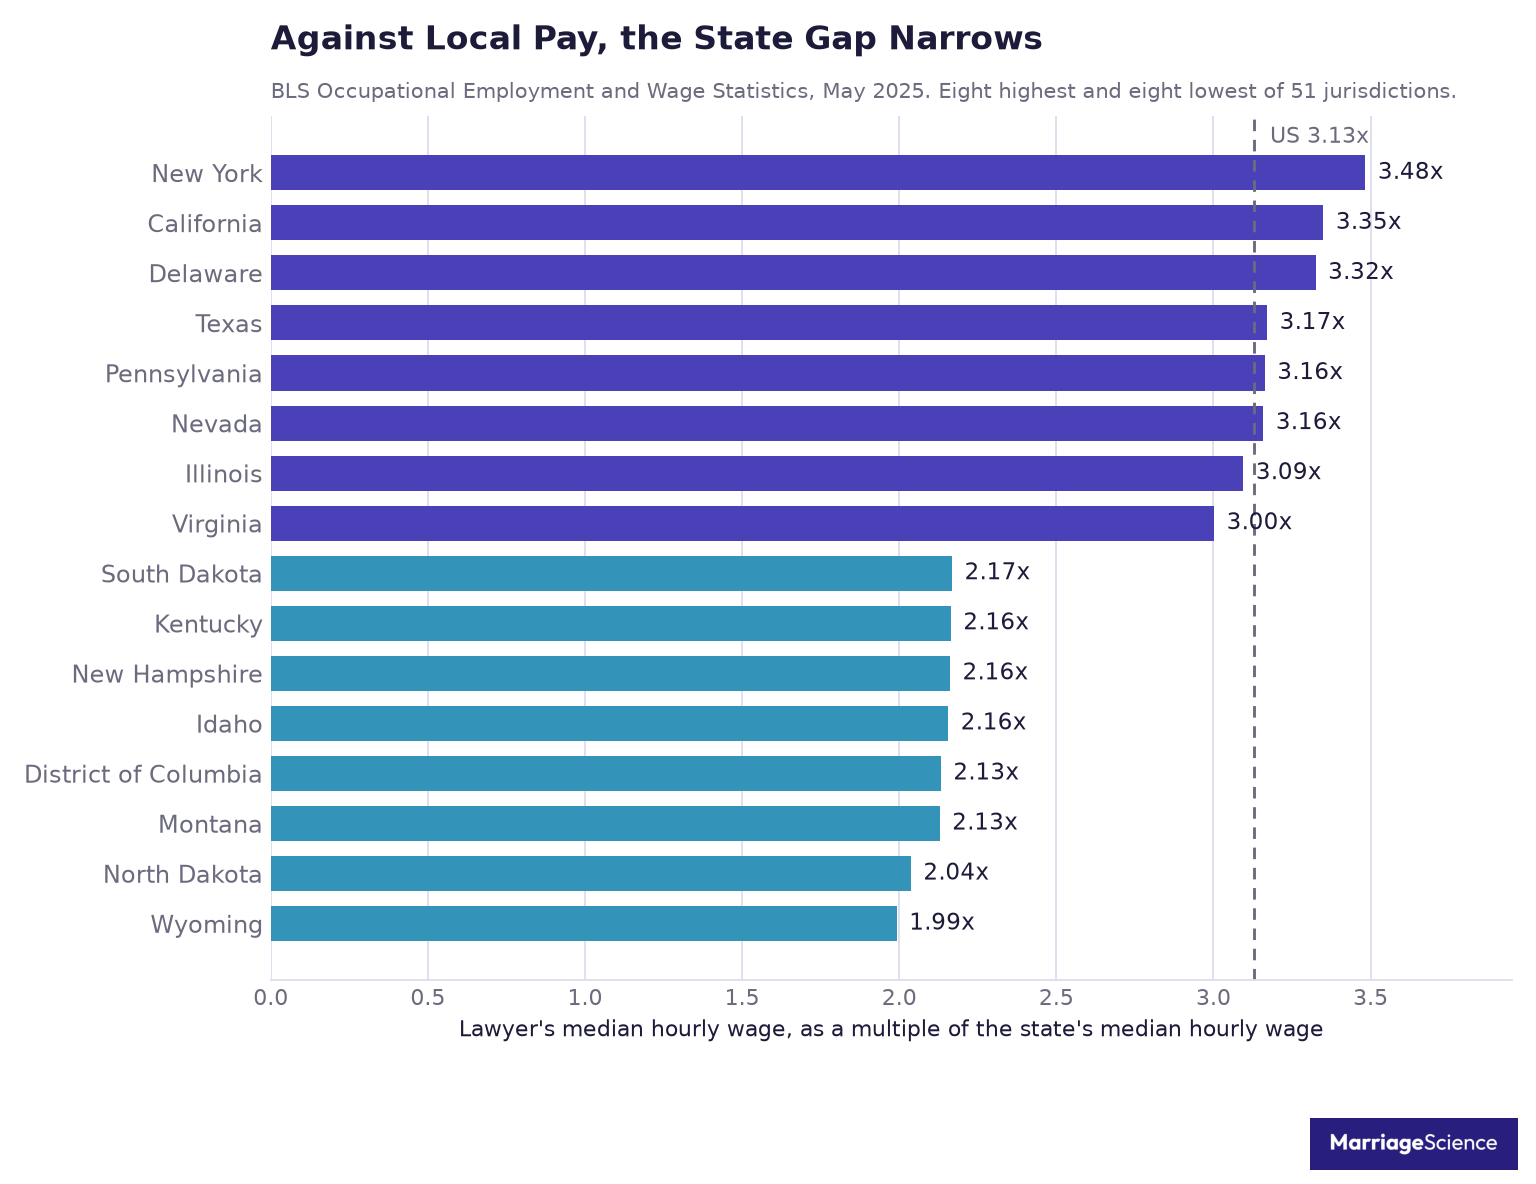
BLS publishes both numbers and never divides one by the other. Nationally, the lawyer median hourly wage is $76.76 against $24.51 across all occupations, which is 3.13 times.
The table below shows how that reading changes the map. It includes large legal markets, lower-cost states, and the District of Columbia, which looks very different once local wages are in the denominator.
| State | Lawyer Median Hourly | State Median Hourly, All Jobs | Multiple |
| New York | $99.93 | $28.69 | 3.48 |
| California | $93.79 | $28.00 | 3.35 |
| Texas | $74.13 | $23.38 | 3.17 |
| Illinois | $77.31 | $24.98 | 3.09 |
| Florida | $64.03 | $23.02 | 2.78 |
| Mississippi | $44.08 | $19.29 | 2.29 |
| District of Columbia | $93.84 | $44.01 | 2.13 |
| Wyoming | $48.14 | $24.17 | 1.99 |
Every row uses BLS OEWS, May 2025, and our calculation. The source is wage data. This is a labor market comparison and it is not a quote for a retained divorce lawyer.
New York is still the highest state by this measure, at 3.48. California follows at 3.35, then Delaware at 3.32, Texas at 3.17, Pennsylvania at 3.16, and Nevada at 3.16. These states still look expensive after adjusting for local pay, but the distance is less dramatic than the dollar wages alone imply.
Wyoming is the lowest state, at 1.99. North Dakota follows at 2.04, then Montana at 2.13, the District of Columbia at 2.13, Idaho at 2.16, New Hampshire at 2.16, and Kentucky at 2.16.
The District of Columbia row can look wrong at first glance, because its lawyer median hourly wage is high. The reason it sits near the bottom is that its all-occupations median hourly wage is $44.01, the highest in the country.
This is the counterintuitive part. The dollar spread across states is 2.27 times. The spread in local terms is 1.75 times. Lawyers cost more in expensive states, but the local burden rises by less than the sticker price suggests, because clients in those states earn more too.
The ratio does not say what any household will pay. It gives a cleaner way to compare lawyer pay against local earning power.
State differences run through this whole subject. Our analysis of the divorce rate by state measures how often marriages end in each one, from the same Census survey used above.
No Official Statistic Measures What a Lawyer Charges
Divorce cost articles often reach for lawyer pay data because it is official and easy to cite. The Bureau of Labor Statistics measures wages paid to employed lawyers. It does not measure billing rates, which are the prices clients see on invoices.
That distinction matters because a divorce bill is built from prices charged to a client. A wage number answers a labor market question. It says what employed lawyers are paid for their work, and it leaves out the charge set by a firm or solo practice.
No federal agency publishes what a lawyer charges a client. That leaves a gap between an official wage statistic and the price a reader actually wants. Private sources fill it. No public price series does.
The two national numbers in circulation both come from companies that sell to law firms. Martindale-Nolo reported a $270 average hourly rate. That number came from attorneys who claimed their own profiles on a directory and typed in their fees.
Clio, a practice management software company, reported a family law figure of $312 an hour in 2023. Nolo’s own page sends readers to Clio when it admits its own rates are stale.
The wage comparison shows how different the two measures are. The national median hourly wage for a lawyer in May 2025 was $76.76. The arithmetic is simple: $312 divided by $76.76 is about 4.1.
So the published family law billing figure is about 4.1 times the national median hourly wage. The honest reading is that the multiple is mostly overhead and firm economics rather than take-home pay. Public data do not let us separate those pieces.
This does not mean either company inflated anything. It means a market this large has no independent price statistic, so the only national price numbers available are published by parties with an interest in them. The BLS number is official, but it is a wage.
For divorce cost reporting, that is the central limitation. A fee estimate built from wages answers a different question from one built from billing rates. One asks what lawyers are paid as workers, while the other asks what clients are charged by firms.
Court Filing Fees, and Why There Is No National Number
There is no national dataset of divorce filing fees. A divorce case starts in a local court, and the price of opening that case is set in different ways across the country. Some states put the fee in a statewide schedule or statute. Others leave the amount to the circuit or county.
That is why a single national number would be false precision. The fee a couple pays depends on the courthouse, the paper being filed, and whether the source counts only the petition or also counts the response. Court filing fees are a local charge. Any national figure is an average of things that were never set together.
| Jurisdiction | To file | To respond | Couple pays | Source |
| California, statewide | $435 | $435 | $870 | Judicial Council fee schedule, effective 1 Jan 2026 |
| Cook County, Illinois | $388 | $250 | $638 | Clerk of the Circuit Court, Domestic Relations schedule |
| Madison County, Illinois | $314 | $194 | $508 | Madison County Circuit Clerk |
| Florida, statutory ceiling | up to $295 | not set in statute | not published | Fla. Stat. s. 28.241(1)(a)2 |
California is the clean example. The Judicial Council statewide civil fee schedule, effective 1 January 2026, lists a petition for dissolution of marriage at $435. A response to that petition also costs $435. A joint petition costs $870 and covers both petitioners.
Illinois shows the problem with using one state label. Illinois sets fees by circuit, so there is no Illinois figure at all. Cook County charges $388 for a petition for dissolution of marriage plus a $250 appearance fee, which is $638 for the couple. Madison County’s own circuit clerk page states $314 to file the case and $194 for an answer, which is $508. Two counties in one state are $130 apart.
Florida shows a different problem. The statute sets a ceiling instead of a final courthouse price. Section 28.241(1)(a)2 of the Florida Statutes says a party filing under chapter 61, which is dissolution of marriage, “shall pay to the clerk of that court a filing fee of up to $295.” The same line is followed by separately itemized statutory additions. The response fee is not set in that statutory line, so the couple’s total is not published there.
The point most filing-fee roundups miss is that the responding spouse pays a fee too. Lists that publish only the petitioner’s fee make the court cost of ending a marriage look lower than it is. Of the 15 pages we tested, 4 mention the responding spouse’s fee at all. The rest publish the petitioner’s fee and stop there.
The source problem is also commercial. The only national filing-fee lists that rank are run by two companies that sell divorce paperwork. Those pages may be useful as a starting point, but they are not a court dataset, and they do not solve the response-fee problem.
There is a practical reason the better dataset does not exist in public view. Most state court websites refuse automated collection. Of ten state court fee pages we requested, eight returned an error and two timed out. That is why nobody has built this dataset, and why we are not claiming to have built it either. The safest statement is narrower and more honest: filing fees are local, response fees matter, and the couple’s court bill can differ sharply by courthouse.
Agreeing terms in advance changes what the process costs. Our prenup statistics set out how many couples sign one and what they cover.
What the People Getting Divorced Can Actually Afford
Our third original analysis uses the Census Bureau ACS Public Use Microdata Sample, 2024 one-year file. The universe is everyone aged 15 and over recorded as having divorced in the previous 12 months. In the microdata, 17,753 unweighted records represented 1,881,028 people.
The question here is ability to pay. Median personal income in this divorce group was $45,000. Men had median personal income of $50,000, women had median personal income of $40,000, and median household income was $75,000.
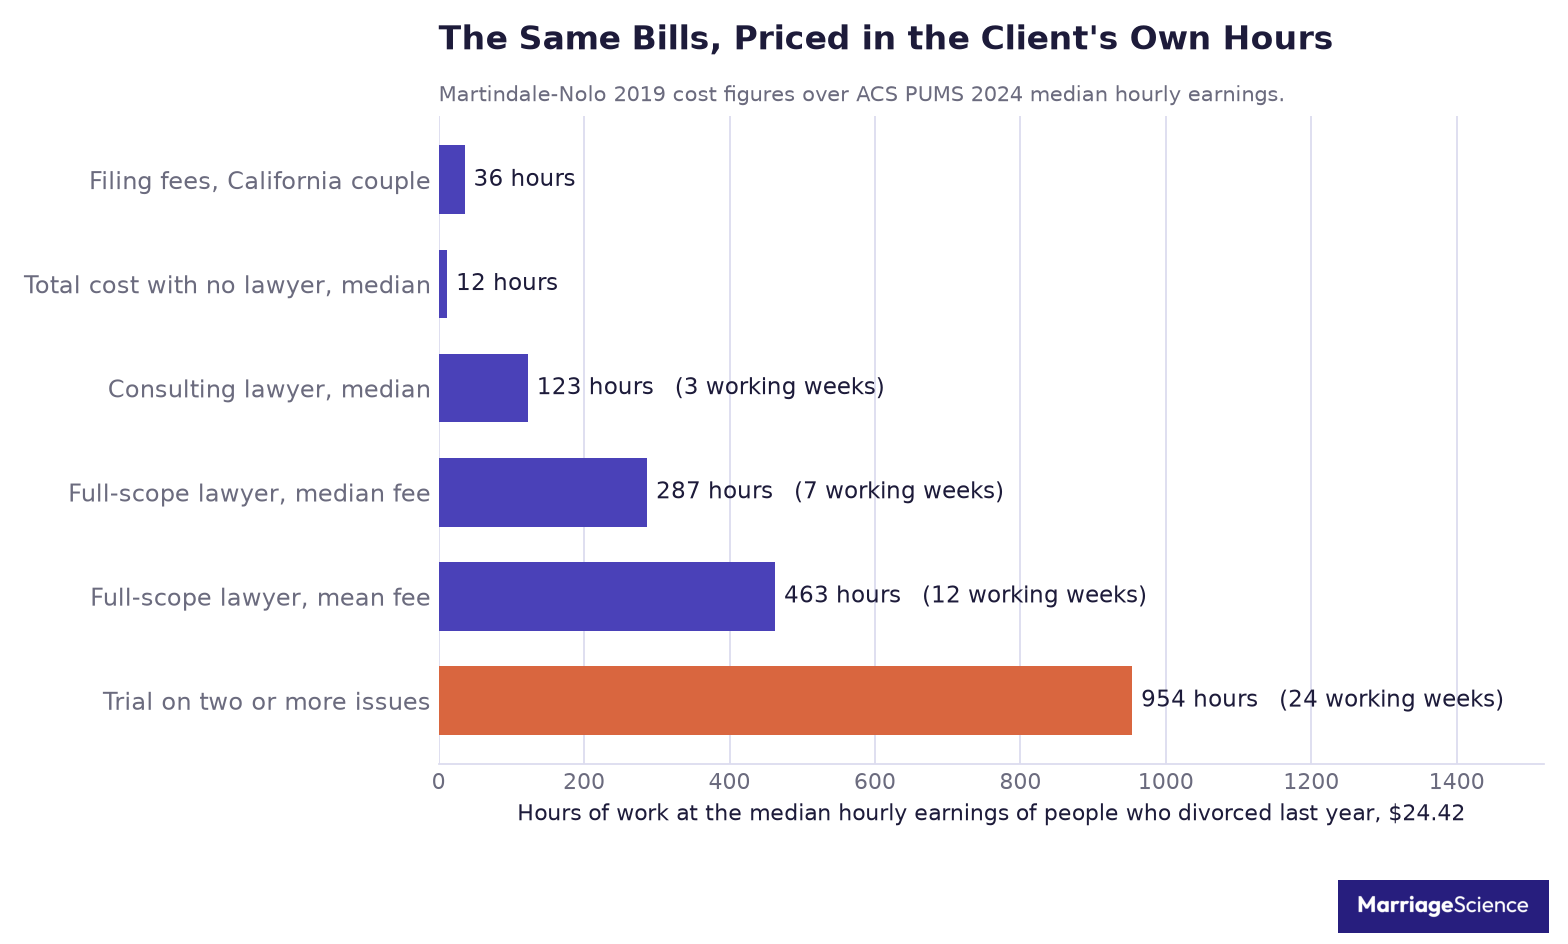
Hourly earnings put those incomes in a more practical frame. Across 12,632 wage earners in the same universe, median hourly earnings were $24.42, computed from annual wages divided by usual weekly hours times weeks worked. That is almost exactly the national all-occupations median hourly wage of $24.51.
By that measure, the people divorcing are ordinary earners. Priced in their own hours at $24.42, the $7,000 median attorney fee is 287 hours of work. The $11,300 mean is 463 hours, a trial on two or more issues at $23,300 is 954 hours, and California’s $870 of filing fees for a couple is 36 hours.
Those hours are a plain way to read divorce prices. A fee that looks like a single invoice is also a large block of work time. For a median earner in this group, even filing fees can compete with the pay from a full workweek.
The poverty measures show why court fee waivers matter. In the 2024 PUMS file, 17.1% of people who divorced in the previous 12 months were below the federal poverty line. 20.9% were below 125% of it and 33.7% were below 200%. Each of those shares is cumulative, so the wider bands include the narrower ones.
The 200% line matters because California and Florida use it as an income test for waiving court fees. California Government Code section 68632(b)(1) waives fees for an applicant “whose monthly income is 200 percent or less of the current poverty guidelines”. Florida Statutes section 57.082(2)(a)1 says an applicant “is indigent if the applicant’s income is equal to or below 200 percent of the then-current federal poverty guidelines”.
On income alone, 33.7% of people getting divorced would qualify under that kind of test, before counting anyone who qualifies through a benefit program. That is court access alone and it does nothing about attorney bills. It does explain why the first cost barrier is often the courthouse itself.
The finding also holds in the longer file. In the 2020 to 2024 five-year ACS PUMS file, with 83,955 records, 16.8% were below the poverty line, 21.0% were below 125%, and 34.4% were below 200%. The same pattern appears when more years are pooled.
Money is not the only asymmetry after a marriage ends. Our analysis of who files for divorce uses the same Census microdata to compare men and women in the year after a divorce.
The table pairs the published ACS count with our own income and poverty measures from the microdata.
| Measure | Value | Source |
| People who divorced in the previous 12 months | 1,868,585 | ACS 2024 1-year, table B12503 |
| Median personal income | $45,000 | ACS PUMS 2024, our calculation |
| Median hourly earnings | $24.42 | ACS PUMS 2024, our calculation |
| Below the federal poverty line | 17.1% | ACS PUMS 2024, our calculation |
| Below 200% of the poverty line | 33.7% | ACS PUMS 2024, our calculation |
| Hours of work for the $7,000 median attorney fee | 287 | Our calculation |
Going Without a Lawyer
The cheapest route in the Martindale-Nolo survey was going without a lawyer at all. People in that group reported a mean total cost of $925 and a median of $300. The survey does not say what share of respondents took it. Priced in the hours of the people actually divorcing, that median is about 12 hours of work.
That number is a cash cost and it is not the full price of the experience. A no-lawyer divorce can still mean forms, filing rules, service requirements, waiting time, and the risk of fixing a mistake later. The survey figure is useful because it gives a concrete floor for reported spending, while leaving out much of the unpaid labor behind it.
The middle option was a consulting lawyer, where a person handles much of the case alone but pays for limited legal advice. Only 1 in 10 of the people in that survey used a consulting lawyer, at a median of $3,000. That puts limited help far above the no-lawyer median and well below the full representation figures above.
The national data gap is sharp here. The United States publishes no national count of how many divorces are filed without a lawyer. A state court can report self-represented filings in its own courts, which is a state measure and cannot stand in for a national one.
The closest national evidence comes from access-to-justice research, and it has to be read with care. The Legal Services Corporation‘s Justice Gap study, published in 2022 from a survey of more than 5,000 households, found that 92% of the civil legal problems of low-income Americans “did not receive any or enough legal help”. The 2017 edition of the same study put it at 86%.
That study covers all civil legal problems and divorce is only one of them. Still, it explains why the no-lawyer option cannot be treated as a simple preference for low spending. For some households, it may be the only affordable route through a legal process that still carries real work, delay, and risk.
What We Could Not Find
Several useful national measures were missing from the record we could verify. Those absences matter because divorce-cost articles often quote a single national number, while the public record is patchy and local.
We could not find a national filing-fee dataset from an official source. Fees are county-set in much of the country, and most court websites block automated collection. The national lists that rank in search results are maintained by companies that sell divorce paperwork, so they are not the same as a court-published dataset.
We could not find an official statistic for what a divorce lawyer charges. Federal data covers wages only. It can describe lawyer pay as labor-market information, but it does not say what a client is billed for a divorce case.
We could not find a national count of divorces filed without a lawyer. We also could not find a national count of how many divorces are filed at all in a comparable way. That is why this page uses the Census survey count of people who divorced, which is the closest comparable national measure.
We could not find a defensible national total for the cost of divorce. Multiplying a self-selected survey average by a divorce count would produce a large, quotable and meaningless number. For that reason, we have not published one.
The search results themselves help explain why the same numbers repeat. One article promising the cost of divorce in every state was syndicated by Stacker to local television websites and published in July 2026. The article opens by saying it was written with a named Texas family law firm.
That article quotes the Martindale-Nolo mean and median without a year. It then gives per-state attorney figures with no source at all. We are recording that chain neutrally because a syndicated article can make unsupported figures look more settled than they are when the same text appears on many local sites.
Most of what a divorce costs is argued over property and support, and a couple can settle part of that before they marry. Whether a court will hold them to it is state law, and our prenup guides cover the rules in New York, Pennsylvania, Illinois, North Carolina, Nevada, Kentucky, Arkansas and North Dakota.
Methodology and Sources
This page is built from public datasets, fee schedules, statutes, and one named consumer survey. We used primary sources where the underlying number could be checked back to an agency, court, statute, or publisher page.
Attorney wage data comes from the BLS Occupational Employment and Wage Statistics program, May 2025, occupation 23-1011. We pulled the figures from the BLS time series files so the dataset included all 51 jurisdictions. The web tables were used as a reference point only.
Price changes for legal services come from BLS Consumer Price Index series CUUR0000SEGD01 and CUUR0000SA0. Those series were cross-checked against the BLS public API. The last legal services observation used on this page is September 2024.
- Population and income figures come from American Community Survey 2024 one-year estimates, table B12503, and the 2024 Public Use Microdata Sample filtered to MARHD = 1. The same logic was replicated on the 2020 to 2024 five-year file.
- Court fee figures were read from the Judicial Council of California statewide fee schedule effective 1 January 2026, the Cook County Clerk of the Circuit Court domestic relations schedule, the Madison County Circuit Clerk, and Florida Statutes sections 28.241 and 57.082.
- Survey figures come from Martindale-Nolo Research’s 2019 divorce survey, read from Nolo’s own page.
Several measures on this page are our calculations from those inputs. That includes the lawyer-to-local-wage multiple, the inflation restatements, the poverty shares in the divorcing population and the hours-of-work conversions. When a ratio is described as ours, the source provided the underlying values and we did the arithmetic.
We excluded aggregator statistics roundups, law firm marketing pages, and any figure that could not be traced to a primary source. The widely repeated claim that the average divorce costs $15,000 to $20,000 is not used anywhere on this page. The pages that print it give no source for it, and we could not trace it to a survey, an agency or a dataset.
The page will be updated when BLS publishes the next legal services reading and when the 2025 ACS microdata is released. Future revisions will keep the same source hierarchy, with agencies, court records, statutes, and named survey publishers ahead of summaries that do not disclose their source trail.



