


Almost every page answering this question gives the same number, a 70% to 75% success rate. The number travels well because it sounds clean and reassuring, but its source is narrower than the way it is usually presented.
The 70% to 75% claim comes from a 1999 meta-analysis of four trials. Three of those trials were run by the founders of the therapy being tested. That finding still counts. It should be read as evidence from a small and early body of work, which is a thin basis for a number now quoted about every counseling office in the country.
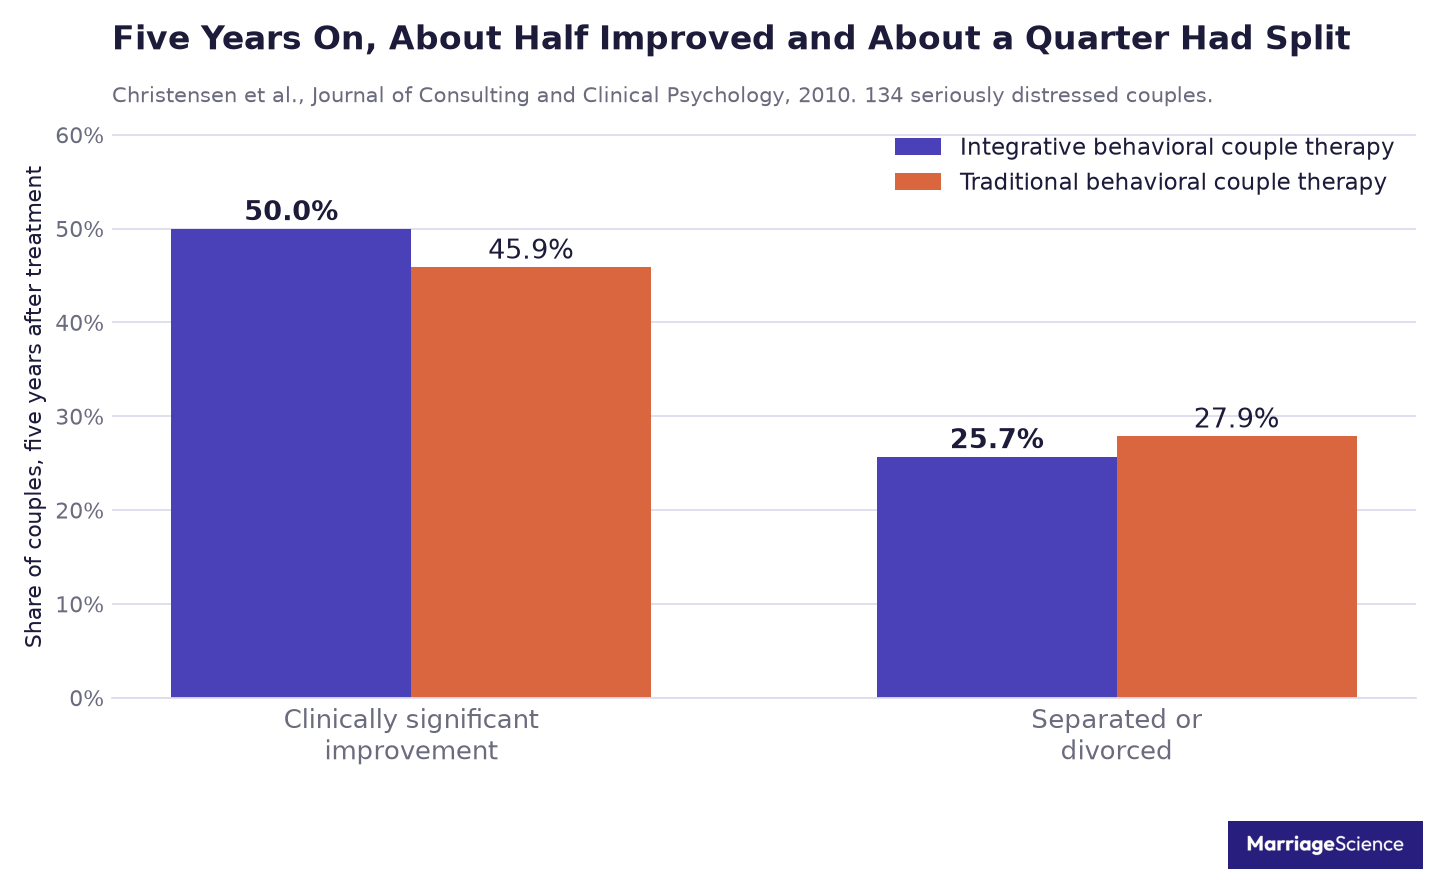
The longest follow-up study of couple therapy tracked 134 seriously distressed couples for five years after treatment. Half showed clinically significant improvement. About a quarter had separated or divorced. Those outcomes are more useful for couples trying to set expectations because they measure what happened well after the last session, when the marriage had time to face ordinary pressure again.
The search results often stop at the headline claim. This page traces each circulating number to its source. It also reports our own count of how many marriage and family therapists actually exist and where they work, using the same standard for each place counted. That matters because a success rate tells only part of the story if the workforce is unevenly spread or hard to access.
Couple therapy does work. The best meta-analysis finds a large effect on relationship satisfaction. The problem is the specific percentage, not the treatment.
Key Statistics on Marriage Counseling Success Rates
The headline success rate depends on which outcome and follow-up window is being measured. The clearest reading separates recovery, relationship satisfaction, separation, client satisfaction, and access to therapists.
- Half of couples, 50.0%, showed clinically significant improvement five years after integrative behavioral couple therapy, and 45.9% after traditional behavioral couple therapy (Christensen et al., 2010).
- Five years after treatment, 25.7% and 27.9% of those couples had separated or divorced (Christensen et al., 2010).
- That study followed 134 chronically and seriously distressed married couples for five years (Christensen et al., 2010).
- The most complete meta-analysis of couple therapy finds a large effect on relationship satisfaction, Hedges g of 1.12 across 2,092 couples (Roddy et al., 2020).
- Couples on a waitlist over the same period did not significantly improve, Hedges g of 0.12 (Roddy et al., 2020).
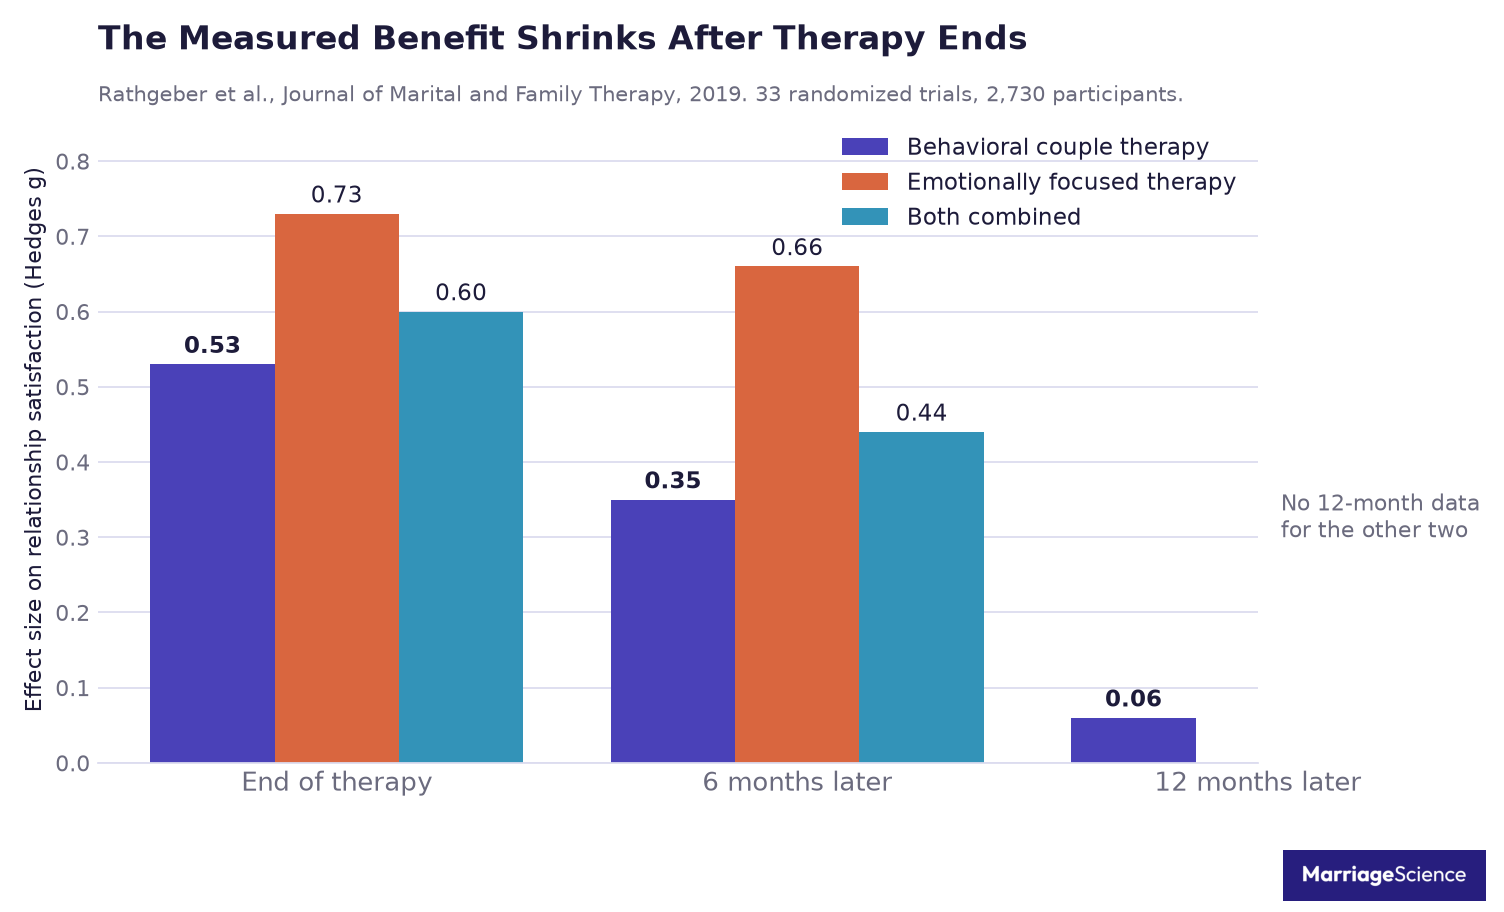
- A meta-analysis restricted to randomized trials found a medium effect at post-test, g of 0.60 across 33 studies and 2,730 participants (Rathgeber et al., 2019).
- In that analysis the effect fell to 0.44 at six months and to 0.06 at twelve months for behavioral couple therapy (Rathgeber et al., 2019).
- The widely quoted 70% to 73% recovery figure comes from a meta-analysis of four randomized trials (Johnson et al., 1999).
- Three of those four trials were conducted by at least one of the two founders of the therapy being evaluated (Beasley and Ager, 2019).
- Emotionally focused therapy trials published since 1999 average about 14 participants in the treatment condition (Beasley and Ager, 2019).
- The claim that over three-fourths of couples report an improved relationship comes from a page on the American Association for Marriage and Family Therapy website that names no study (AAMFT, read 2026).
- The same page states that over 98 percent of clients rate the service good or excellent (AAMFT, read 2026).
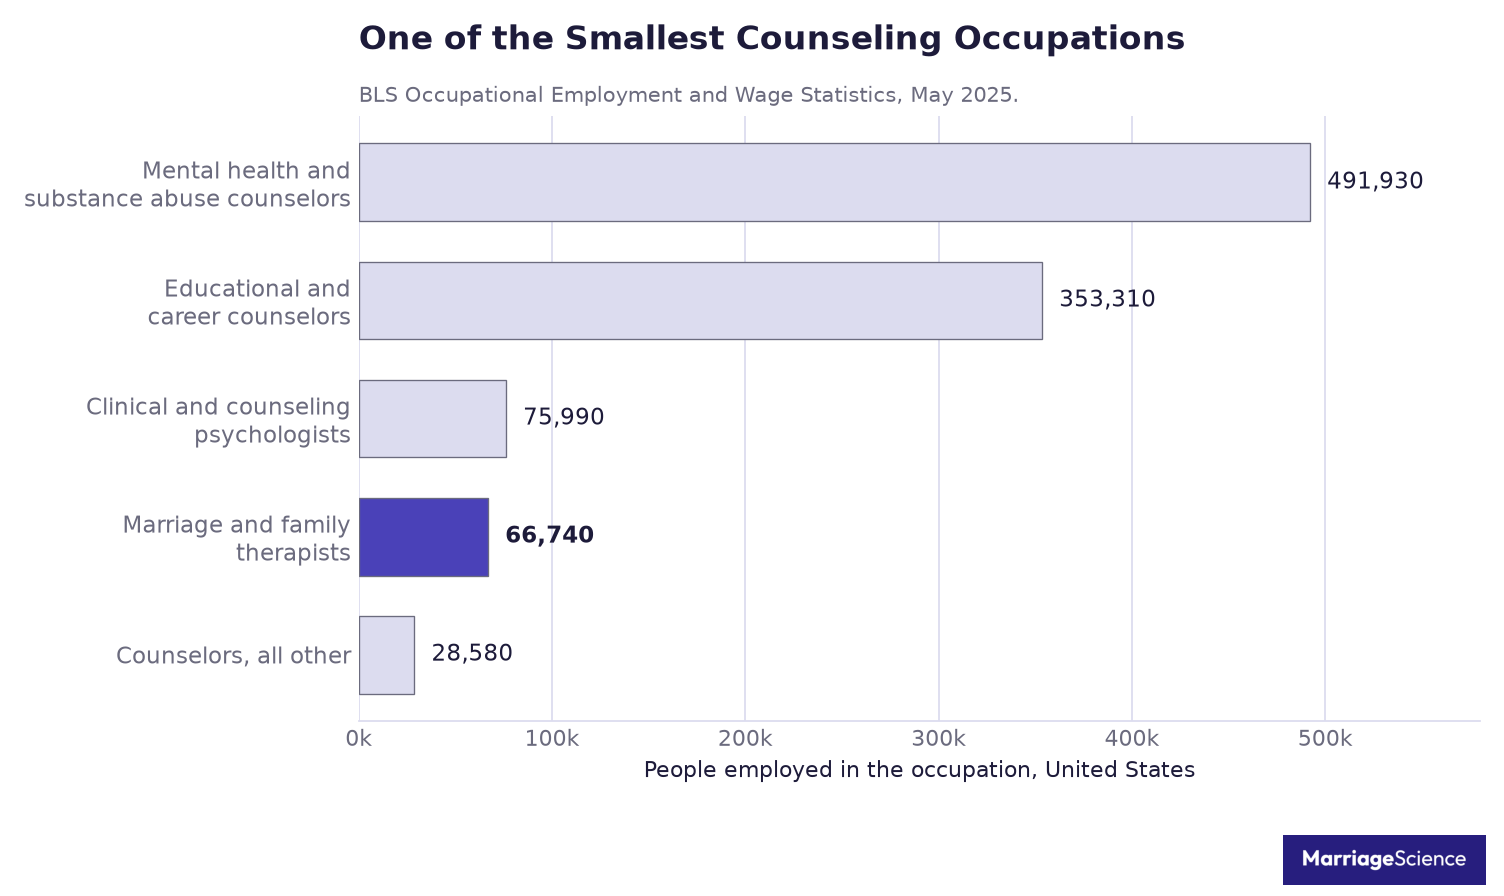
- There were 66,740 marriage and family therapists employed in the United States, with an annual median wage of $66,940 (BLS OEWS, May 2025).
- That is one marriage and family therapist for every 2,094 married adults (our analysis, BLS OEWS May 2025 and ACS 2024).
- California employs 34,970 of them, 52.4% of the national total (our analysis, BLS OEWS May 2025).
The Short Answer, and Why It Is Not One Percentage
Marriage counseling does not have one honest success rate because success is defined in different ways. One report may count a couple as successful if they stay together. Another may count success when a satisfaction score improves by a clinically meaningful amount. A third may treat a lower damage separation as a good outcome. A single percentage has to choose one definition, and most quoted figures do not say which one they chose.
In research, the usual outcome is narrower than the public meaning of success. Almost all of this work measures a score on a relationship satisfaction questionnaire, most often the Dyadic Adjustment Scale, before and after treatment. When a paper says a couple recovered, it means the couple crossed a cutoff on that scale. It does not mean the marriage was saved.
That is why effect sizes matter. An effect size is a measure of how far the average couple moved, expressed in standard deviations, so that studies using different questionnaires can be compared. Roddy et al., 2020 found a Hedges g of 1.12 for relationship satisfaction in couple therapy. Waitlist couples had a Hedges g of 0.12.
The best short answer is this: couple therapy produces a real and substantial improvement in relationship satisfaction. The stronger caution comes later. Christensen et al., 2010 followed seriously distressed couples for five years and found that 50.0% and 45.9% were clinically significantly improved at that point, depending on treatment condition. The same follow-up found that 25.7% and 27.9% had separated or divorced.
Therapy is one thing couples try when a marriage is in trouble. For how often marriages end in the first place, our divorce statistics for 2026 set out the national counts.
| Question | Best available answer | Source |
| Does satisfaction improve during therapy | Yes, a large effect, Hedges g 1.12 | Roddy et al., 2020 |
| Do untreated couples improve on their own | No, Hedges g 0.12, not significant | Roddy et al., 2020 |
| Are couples still better off after five years | About half of seriously distressed couples | Christensen et al., 2010 |
| How many split anyway | About a quarter within five years | Christensen et al., 2010 |
| Is there a single success rate | No, the published figures measure different things | This analysis |
Those numbers do not support a clean claim that counseling saves a fixed share of marriages. They support a more careful claim. On average, satisfaction improves during therapy by a large amount, while untreated couples in the comparison condition did not show a meaningful change. Years later, about half of seriously distressed couples remained clearly better off, and about a quarter had split.
This distinction matters because a saved marriage and a recovered score are related, but they are not the same outcome. A couple can remain married and still report distress. A couple can separate and still reduce hostility, clarify parenting, or leave therapy with less damage. Those endings belong in the discussion, but they should not be blended into one unnamed percentage.
So the answer for readers is simple enough to use and careful enough to be fair. If success means better relationship satisfaction, the evidence points to a strong treatment effect. If success means still being together, the five-year data are less tidy. If success means a lower-damage ending, the published satisfaction figures do not fully capture it.
Five Years After Therapy: Half Improved, a Quarter Separated
The cleanest long follow-up in the couple therapy literature is Christensen, Atkins, Baucom and Yi, 2010, in the Journal of Consulting and Clinical Psychology, volume 78, issue 2, pages 225 to 235. It is the most useful single answer because it follows couples well past the end of treatment.
The trial enrolled 134 chronically and seriously distressed married couples. They were randomly assigned to about 8 months of traditional behavioral couple therapy, or TBCT, or integrative behavioral couple therapy, or IBCT. Marital status and satisfaction were assessed roughly every 3 months during treatment and every 6 months for 5 years afterward.
That design makes the study a stern test. The couples were selected because their marriages were chronically and seriously distressed, so this was no sample of mildly unhappy spouses trying a brief tuneup. The five-year results are therefore a better stress test than a short post-treatment satisfaction check.
| Outcome at five years | IBCT | TBCT | Source |
| Clinically significant improvement | 50.0% | 45.9% | Christensen, Atkins, Baucom and Yi, 2010 |
| Separated or divorced | 25.7% | 27.9% | Christensen, Atkins, Baucom and Yi, 2010 |
| Effect size vs pretreatment | d = 1.03 | d = 0.92 | Christensen, Atkins, Baucom and Yi, 2010 |
| Couples randomized | 134 total across both arms | 134 total across both arms | Christensen, Atkins, Baucom and Yi, 2010 |
Read the table in either direction and it is more sober than 70%. A finding that 50.0% of IBCT couples and 45.9% of TBCT couples reached clinically significant improvement is a real result for marriages in that much trouble. It is not three quarters.
The split figures are just as important. At five years, 25.7% of IBCT couples and 27.9% of TBCT couples were separated or divorced. Relationship status was obtained on all 134 couples, so those separation and divorce figures were not produced by a smaller group of respondents.
The treatment effects also did not disappear at follow-up. At five years, the effect sizes relative to pretreatment were d = 1.03 for IBCT and d = 0.92 for TBCT. Earlier, the pre to post effect sizes were d = 0.90 for IBCT and d = 0.71 for TBCT, and those pre to post differences were not significantly different.
The pattern between the two therapies changed over time. IBCT was significantly better than TBCT through two years of follow-up. After that, the two treatments converged, and the difference stopped being significant.
The authors’ own verdict matters because they knew the prior record. They wrote, "These follow-up data compared favorably to other, long-term results of couple therapy." That sentence is restrained, but it says something direct about the rest of the literature: these five-year numbers look good by comparison.
The limits are also plain. This was a single trial at two sites, so it cannot settle the question for every clinic, therapist, or couple. No study of this length has been repeated, which is why these numbers carry weight and why they should be read carefully.
Where the 70% Figure Comes From
The familiar 70% to 73% claim comes from a narrow research line. It was never a census of marriage counseling outcomes. The citation is Johnson, Hunsley, Greenberg and Schindler, 1999, Emotionally Focused Couples Therapy: Status and Challenges, published in Clinical Psychology: Science and Practice, volume 6, pages 67 to 79.
That paper is a meta-analysis of four randomized controlled trials. All four used the Dyadic Adjustment Scale as the common measure, which matters because the recovery figure is tied to that scale. The result that entered public and marketing circulation is that 70% to 73% of couples recovered from relationship distress on the Dyadic Adjustment Scale.
The same paper also reported a weighted mean effect size d+ = 1.31, and the effect was statistically significant. In plain terms, d+ = 1.31 is a large effect size. This is not a claim that the emotionally focused therapy research was worthless.
The limit is the base underneath the claim. Four trials is a small base for a number quoted this often, especially when the number is later repeated as a broad marriage counseling success rate. The original claim describes emotionally focused therapy with couples, a branded treatment model.
The paper also gives only a spare account of its search method. The only method detail the authors reported was that inclusion was restricted to randomized controlled trials of emotionally focused therapy with couples. That helps explain why the finding should be read as a focused estimate. It is not a field-wide answer.
Recovery also has a precise meaning here. It means recovered from relationship distress on the Dyadic Adjustment Scale, the common measure used across the trials. That is different from proving that every couple stayed married, stopped fighting, avoided separation, or remained satisfied after a long follow-up.
The number then gained a wider life outside the journal article. ICEEFT, the International Centre for Excellence in Emotionally Focused Therapy, publishes and promotes the recovery figure. Its site sells emotionally focused therapy courses, externships, core skills training, certification and products, checked 7 September 2026.
That commercial context does not make the figure false. It does mean readers should keep the subject of the claim in view. A statistic promoted by the organization behind emotionally focused therapy is evidence about emotionally focused therapy, under the trial conditions in the meta-analysis.
When the figure travels as a general claim about marriage counseling, it changes shape. Couples counseling includes different methods, different therapist training, different client problems and different outcome measures. The 70% to 73% number cannot carry all of that.
The best reading is simple: the 70% to 73% figure is a cited recovery result for emotionally focused therapy, drawn from a meta-analysis of four randomized controlled trials. It is too specific to use as a blanket success rate for marriage counseling as a whole.
Three of the Four Trials Were Run by the Therapy’s Founders
The most important footnote under the familiar EFT success figure is about who ran the trials behind it. Beasley and Ager’s 2019 systematic review in the Journal of Evidence-Informed Social Work returned to the four trials behind the earlier claim. Writing about that 1999 meta-analysis, they note:
Three of the four studies used in this analysis were conducted by at least one of the two founders of EFT. However, there was no therapist overlap across these studies.
Beasley and Ager, Journal of Evidence-Informed Social Work, 2019
That sentence does two jobs. It identifies a connection between the treatment developers and the trials, and it also limits the criticism. The reviewers say there was no therapist overlap across the studies, and they do not accuse the founders or trial teams of misconduct.
Researchers often test the therapy model they built. That is normal, and disclosure is the guardrail. The problem begins when a number from an evidence base led mostly by founders is repeated as if it has the same weight as a finding replicated by independent teams with larger samples.
The distinction matters because public summaries often turn a cautious research finding into a slogan. A range like “70% to 75%” sounds exact. When the underlying set includes four trials and three involved at least one founder, the number needs a visible warning label.
| Measure | Value | Source |
| Trials in the 1999 meta-analysis | 4 | Beasley and Ager, 2019 |
| Trials run by a founder of the therapy | 3 | Beasley and Ager, 2019 |
| Randomized trials found since 1999 | 9 | Beasley and Ager, 2019 |
| Trials with follow-up data | 4 | Beasley and Ager, 2019 |
| Mean sample, treatment condition | about 14 | Beasley and Ager, 2019 |
| Mean sample at follow-up | about 10 | Beasley and Ager, 2019 |
Beasley and Ager then looked at what had accumulated since 1999. Nine randomized trials qualified for their pre-post analysis, and four qualified for their follow-up analysis. That is enough to keep EFT in the evidence discussion, but it is a thin base for a claim repeated with point estimate confidence.
The later review did not erase the earlier work. It put it in proportion. The best reading is that EFT has evidence in its favor, while the exact success range remains less settled than the common wording suggests.
The size issue matters as much as the authorship issue. The mean sample was about 14 participants in the experimental condition and about 13 in the control condition. At follow-up, the mean was about 10 per condition, which leaves any single result sensitive to the experience of a small group.
Their conclusion was careful. They described the evidence as “preliminary support” that EFT is effective and that gains are maintained. That wording does not say the therapy fails. It says the evidence does not carry the precision implied when the public claim is stated as “70% to 75%” without the founder qualification and small trial context.
A finding needs replication by researchers with nothing riding on the outcome. For this number, Beasley and Ager’s review shows that most of that replication has not happened, and the follow-up record remains especially small.
The 75% and 90% Claims Come From a Trade Association Page
The second source trace points to the American Association for Marriage and Family Therapy, the professional membership body for marriage and family therapists in the United States.
The numbers circulate from a page titled About Marriage and Family Therapists, under a section headed “Why use a Marriage and Family Therapist?” This is where the “almost 90%” and “over three-fourths” language enters the public conversation.
Over 98 percent of clients of marriage and family therapists report therapy services as good or excellent. After receiving treatment, almost 90% of clients report an improvement in their emotional health, and nearly two-thirds report an improvement in their overall physical health. A majority of clients report an improvement in their functioning at work, and over three-fourths of those receiving marital/couples or family therapy report an improvement in the couple relationship.
American Association for Marriage and Family Therapy, About Marriage and Family Therapists
We read the page from an archived capture dated 13 April 2026, because the live site blocks automated access. That matters because the claim is often repeated without the surrounding context of the page.
The page also states that since 1970 there has been a fifty-fold increase in the number of marriage and family therapists, and that at any given time they are treating over 1.8 million people. Those statements sit inside a page written to explain the field and encourage the use of marriage and family therapists.
The page names no study. It says only “In a recent study” and “Research studies repeatedly demonstrate.” There is no year, no sample size, no citation and no link.
The tell is the “Over 98 percent” line about services being good or excellent. Almost nothing measured against a control group comes back at that level. Satisfaction surveys of current clients can, because they ask people who are already using the service to rate the service.
That is a real answer, but it answers a different question. Asking people who chose a service whether they liked it is separate from asking whether the service worked when measured against a control group.
These are client satisfaction responses collected after treatment. They are separate from measured outcomes against a control group, and they do not show what would have happened to similar couples without that treatment comparison.
The page exists to argue for hiring a marriage and family therapist. That is a legitimate thing for a membership association to publish. A promotional client-satisfaction page is not the same thing as a research finding, although it is often quoted as one.
Google’s AI Summary Repeats Both Numbers
On 7 September 2026, Google’s AI Overview gave searchers a clean success claim for the query “marriage counseling success rate.” It said: “Marriage counseling has an overall success rate of about 70% to 75% for couples who complete the treatment process.” It also said that data from the American Association for Marriage and Family Therapy indicates that over 75% of couples report an improved relationship.
The same answer layer gave a wider range for a nearby question. On “does marriage counseling work,” it stated: “Marriage counseling works for a large majority of couples, with research showing a success rate of about 70% to 80%.” On “couples therapy success rate,” it stated that nearly 90% of individuals report better emotional well-being after finishing therapy.
Those answers sound like settled measurements. The source mix behind them is thinner. Across those three queries, the cited sources were, with one exception, counseling practices and therapy directories: therapistsincharlotte.com, thewellnesscounselingcenter.com, sentiocc.org, meadowbrookcounseling.com, nymentalhealthcenter.com, greenwichpsychology.com, wellmarriagecenter.com, betterhelp.com and Reddit.
That pattern does not require a conspiracy. It reflects who publishes readable pages on the subject. The pages telling readers that couples therapy works are, in the main, businesses selling couples therapy, plus directory and advice sites that depend on the same search demand.
We downloaded 26 of the top-ranking pages for these queries. 18 of them quote the 70% to 75% figure. None of them reports the five-year outcomes from the Christensen trial, the long follow-up evidence that separates short-term improvement from durable couple outcomes.
Google did surface a primary source. A paper on pmc.ncbi.nlm.nih.gov ranked in sixth or seventh place for two of the three queries. That result is a study protocol for an evaluation of couple counselling at Relationships Australia Victoria. It describes a research design and reports no outcomes.
The consequence is straightforward. A reader following the top results will see the same precise-sounding number repeated across therapy pages, directories, and an AI answer. The number arrives with the tone of research, while the visible evidence trail does not show a study that produced that specific public claim.
Two Meta-Analyses, Two Different Answers
The research literature can look less confusing once the measurements are separated. Roddy, Walsh, Rothman, Hatch and Doss, 2020, give one answer about change during therapy. Rathgeber, Bürkner, Schiller and Holling, 2019, give a more cautious answer about how treated couples compare with couples in randomized controlled trials.
The first split is methodological. A pre to post within group measure asks how much couples changed from before treatment to after treatment. Everything that would have happened anyway is inside that number. A randomized comparison asks how much better the treated couples did than comparable couples who were not treated.
Roddy and colleagues analyzed 58 studies, 40 unique samples, and 2,092 couples in the Journal of Consulting and Clinical Psychology. For relationship satisfaction from pre to post within group, they reported a Hedges g of 1.12, with a confidence interval of 0.92 to 1.31. Their conclusion was direct: “Couple therapy has large effects on key relationship domains and gains are generally maintained over short- and long-term follow-up.”
| Meta-analysis | What it measured | Effect size | Studies |
| Roddy et al., 2020 | Relationship satisfaction pre to post within group | Hedges g of 1.12, confidence interval 0.92 to 1.31 | 58 studies, 40 unique samples, 2,092 couples |
| Rathgeber et al., 2019 | Post-test randomized controlled trials | overall g of 0.60, behavioral couple therapy 0.53, emotionally focused 0.73 | 33 studies, 2,730 participants |
| Rathgeber et al., 2019, twelve months | Behavioral couple therapy only | g of 0.06 | Data at that point were for behavioral couple therapy only |
The waitlist result is what makes the Roddy estimate useful here. Waitlist couples over the same period had a g of 0.12, with a confidence interval of minus 0.04 to 0.29, and the result was not significant. In those studies, untreated couples did not improve on their own.
Rathgeber and colleagues used randomized controlled trials only. Their meta-analysis appeared in the Journal of Marital and Family Therapy, volume 45, issue 3, pages 447 to 463, and included 33 studies and 2,730 participants. At post-test, the overall g was 0.60, with behavioral couple therapy at 0.53 and emotionally focused therapy at 0.73.
Their follow-up results were smaller. At six months, the overall g was 0.44, with behavioral couple therapy at 0.35 and emotionally focused therapy at 0.66. The uncomfortable figure is the twelve months result: behavioral couple therapy had a g of 0.06, and the authors wrote that the gains were not maintained after twelve months.
That twelve months finding must be read carefully. It applies to behavioral couple therapy only, because that was the only method with data at that point. It should not be applied to emotionally focused therapy, and it should not be treated as a single verdict on all couple therapy.
Rathgeber and colleagues also gave their own warning: “Results have to be interpreted with caution due to potential publication bias.” That caution matters because publication bias can make a body of published trials look stronger than the full record would look if every trial were visible.
There is a small irony in the publication trail. The more cautious result appeared in the Journal of Marital and Family Therapy, which is published by the American Association for Marriage and Family Therapy. The association’s public page also carries the 98% figure, so the same professional orbit contains both the promotional statistic and the more restrained randomized-trial estimate.
What ‘Success’ Is Actually Measuring
A marriage counseling success rate sounds simple until the outcome is named. In this research field, success usually means a change in a measured score. It does not automatically mean that a couple stayed married, stopped fighting, rebuilt trust, or felt ready to describe the relationship as healthy.
Almost every result in this field comes from a self-report questionnaire about relationship satisfaction. The most common tool is the Dyadic Adjustment Scale, filled in by each partner. That matters because the unit being measured is the partner’s reported satisfaction at a point in time, then again after treatment or follow-up.
The phrase “clinically significant improvement” can also sound more concrete than it is. It means the score moved past a defined cutoff. The cutoff is a statistical threshold. It is not a description of a marriage, and it does not tell the reader what changed at home, which problems remained, or whether both partners experienced the change in the same way.
Relationship status is a separate outcome. Staying together and being satisfied can move in different directions. A couple can remain together with low satisfaction, or separate after deciding that the relationship should end. Christensen 2010 reported improvement and relationship status separately for exactly that reason, so the reader would not have to treat one as a substitute for the other.
This distinction is especially important for couples who enter therapy to decide whether to continue. For those couples, a separation may be the result of a clearer decision process. No published success rate has a category for that kind of outcome, so a single success figure can flatten very different treatment goals into one label.
The evidence base also has limits that affect how widely the numbers should be read. Rathgeber et al. 2019 warn about potential publication bias, which means the published record may give a cleaner or more favorable picture than the full set of attempted research. Roddy et al. 2020 also note that their sample is exclusively opposite-sex couples. That limitation matters for readers looking for evidence that applies to same-sex couples, because findings from one sample do not automatically answer every relationship question.
On this page, “success” should be read as a measured research outcome first. The plain-language question, whether counseling helped a particular marriage, is wider than any questionnaire score. The best numbers are useful, but they need to be read beside the outcome measured, the people studied, and the reason the couple entered therapy.
Satisfaction is not the only outcome couples care about. Our roundup of sexless marriage statistics covers one specific complaint that brings couples into therapy and that these questionnaires do not measure separately.
There Is One Marriage and Family Therapist for Every 2,094 Married Adults
Marriage counseling is often discussed as if supply were unlimited, but the occupational count is small. In May 2025, the Bureau of Labor Statistics counted 66,740 marriage and family therapists employed in the United States. Against 139,776,124 married adults in the 2024 American Community Survey, our ratio is 47.7 therapists per 100,000 married adults, or one for every 2,094 married adults.
This is not a full count of everyone who sees couples. Psychologists, clinical social workers and licensed professional counselors also do couples work, and they sit in different occupation codes. The marriage and family therapist occupation is the closest available measure because it is defined around couples and families.
Our method is simple. We took the employment and wage figures for marriage and family therapists from the Bureau of Labor Statistics Occupational Employment and Wage Statistics release for May 2025, and the count of married adults from the Census Bureau’s American Community Survey for 2024. The Bureau publishes the headcount, the Census publishes the population, and the ratio between them is ours.
The Bureau of Labor Statistics count is an employment count, so it includes workers classified in the occupation across settings. It does not say how many offer private couples sessions, how many focus on families, or how full their caseloads are. It also does not separate full-time and part-time availability for married couples.
Because job titles and licenses vary across the counseling field, the occupation code is a blunt instrument. It still gives a national denominator for the profession most explicitly named for marriage and family therapy.
| Occupation | Employed | Annual median wage |
| Marriage and family therapists | 66,740 | $66,940 |
| Substance abuse, behavioral disorder and mental health counselors | 491,930 | $59,350 |
| Educational, guidance and career counselors and advisors | 353,310 | $64,330 |
| Clinical and counseling psychologists | 75,990 | $100,580 |
| Counselors, all other | 28,580 | $50,860 |
The comparison with adjacent counseling occupations puts the size in context. Marriage and family therapy is one of the smallest groups in this set, and it is outnumbered roughly seven to one by substance abuse, behavioral disorder and mental health counselors. It is also smaller than educational, guidance and career counselors and advisors, and smaller than clinical and counseling psychologists.
That does not mean the larger occupations are substitutes for marriage and family therapists. It means couples work can be delivered by clinicians who are counted elsewhere. A couple who receives counseling may be outside the marriage and family therapist count even when the appointment is couples therapy.
The wage column should be read as labor income. It is not a consumer price list. For marriage and family therapists, $66,940 is the annual median wage, while the annual mean wage is $76,960. The $66,940 figure is what the therapist earns in a year, not what a couple pays for an hour.
The American Association for Marriage and Family Therapy adds a demand-side check on this supply picture. Its own page states that marriage and family therapists are treating over 1.8 million people at any given time. That figure is people in care, while our ratio uses married adults in the population, so the measures answer different questions.
For a reader checking a counseling success claim, the supply measure keeps access separate from outcomes. A national outcome claim cannot say how easily couples find the right clinician, how long they wait, or whether their provider is in this specific occupation code. The labor market count answers a narrower question, the size of the occupation most directly named for couples and families.
A 36-Fold Gap Between States
Our state analysis uses BLS OEWS May 2025 employment and wage data with ACS 2024 counts of married adults. On that measure, California sits at 224.0 therapists per 100,000 married adults, while Arkansas sits at 6.2 per 100,000. California to Arkansas is a 36 to 1 ratio.
California also dominates the head count. It employs 34,970 therapists out of the national total of 66,740, or 52.4%. That single-state concentration makes any national average fragile, because a licensing system can shape the national picture.
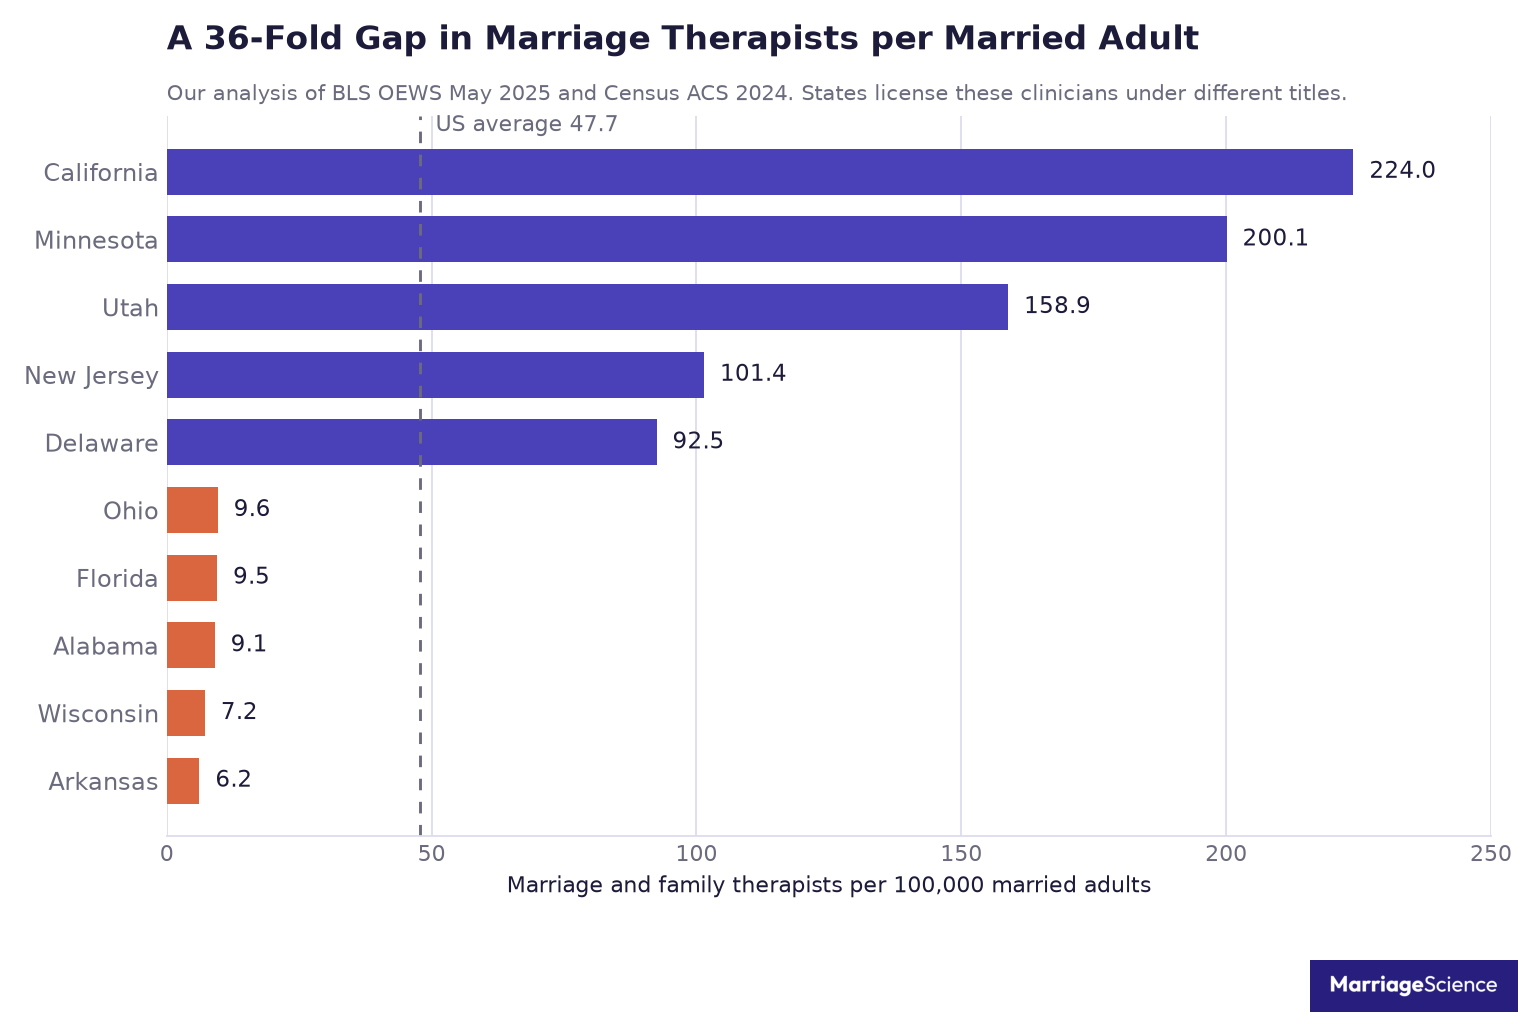
The table below shows the high and low ends of the state distribution. The spread is large even before wages enter the picture. A national success-rate claim can sound precise while the workforce behind it is counted unevenly across states. That makes the gap useful, but easy to misread.
The top group mixes large and smaller labor markets. Minnesota reports 4,870 therapists and 200.1 per 100,000 married adults, while Utah reports 2,390 and 158.9 per 100,000. New Jersey and Delaware sit lower on the same scale, at 101.4 and 92.5 per 100,000.
| State | Therapists | Per 100,000 married adults | Median wage |
| Highest group | |||
| California | 34,970 | 224.0 | $67,300 |
| Minnesota | 4,870 | 200.1 | $72,470 |
| Utah | 2,390 | 158.9 | $84,980 |
| New Jersey | 4,040 | 101.4 | $92,150 |
| Delaware | 400 | 92.5 | $76,580 |
| Lowest group | |||
| Arkansas | 80 | 6.2 | $64,340 |
| Wisconsin | 180 | 7.2 | $37,870 |
| Alabama | 190 | 9.1 | $49,990 |
| Florida | 930 | 9.5 | $56,400 |
Some large states fall near the other end of this occupation count. Texas has 1,380 therapists and 10.9 per 100,000 married adults. New York has 770 and 10.0, while Ohio has 460 and 9.6.
Pay does not line up cleanly with therapist density. Median wage runs from $37,870 in Wisconsin to $141,960 in Hawaii, a 3.7-fold spread. The wage range adds another warning against reading the state table as a simple map of access.
The caveat is the finding. This occupation is defined by license title, and states license master’s-level therapists under different names. California’s licensed marriage and family therapist credential is that state’s main master’s-level clinical license, while most states put comparable clinicians under professional counselor licenses that fall under a different occupation code.
That means the state figures measure how a state licenses at least as much as how easily a couple can find help. A low number does not prove a shortage. Florida, Alabama, Wisconsin, and Arkansas may look thin in this table, but the table cannot see clinicians counted under another license family.
The missing-state problem points the same way. Only 40 of the 50 states and the District of Columbia have a published employment estimate for this occupation. The other eleven have none, and they include states as large as Arizona, Georgia, Washington and Oklahoma. The full list is Arizona, the District of Columbia, Georgia, Louisiana, Nevada, North Dakota, Oklahoma, Rhode Island, Vermont, Washington and Wyoming.
Those blanks do not mean couples in those places have no options. They mean the OEWS occupation is not a clean container for couples therapy. A clinician can work with couples while being licensed and counted in a category that this table does not capture.
The honest conclusion is blunt: there is no clean national count of people who provide couples therapy, because the states do not define the job the same way. That is worth knowing on its own. It is a second reason to distrust confident national statistics about this field.
State-level variation is the rule in this subject. Our analysis of the divorce rate by state found a similar spread in how often marriages end, measured from Census records instead of employment counts.
What the Evidence Does Support
The direction of the evidence is not in doubt. Roddy et al. 2020 found a Hedges g of 1.12 for relationship satisfaction among couples who received treatment, compared with a waitlist g of 0.12. The plain reading is simple: couples who go to counseling improve more than couples who wait. Rathgeber et al. 2019 points in the same direction, with a medium effect at post-test, g of 0.60. That comparison is the central anchor here because it uses a waiting group, so improvement is not left to wishful interpretation.
Roddy et al. 2020 also found significant effects on self-reported and observed communication, emotional intimacy and partner behaviors. That matters because relationship satisfaction can move for reasons outside the therapy room. When communication, intimacy and partner behavior move as well, the positive case is stronger. The result says couple therapy can change the day-to-day patterns that partners live with, along with a survey score. For readers trying to separate advertising language from outcome data, that distinction matters.
One finding from Roddy et al. 2020 is especially useful for setting expectations. Moderation analyses were generally nonsignificant, but greater baseline distress was associated with larger gains. That cuts against the common advice that therapy only works when couples start early. The finding is limited in a specific way. It describes how much couples improve. It says nothing about whether they stay together. It should not be turned into a promise for couples in severe distress.
The long-term trial adds a second boundary. In Christensen et al. 2010, couples received no booster sessions after treatment ended. Integrative behavioral couple therapy was significantly better than traditional through two years, after which the two converged. At five years, 50.0% and 45.9% were clinically significantly improved, with effect sizes of d = 1.03 and d = 0.92 relative to pretreatment. The gains were real, and the early gap between methods did not last. The absence of booster sessions matters because maintenance was left to the couple after formal treatment ended.
Taken together, the data support confidence with limits. Short-term gains are measurable. Long-term follow-up still shows clinically significant improvement for a large share of couples, while also showing that a treatment advantage can narrow after contact stops.
This is the accurate positive case for marriage counseling. The best evidence supports a real chance of substantial improvement in satisfaction, communication, emotional intimacy and partner behaviors. It also supports a meaningful chance of separating anyway, because clinical improvement and staying together are different outcomes. A responsible expectation is neither a miracle claim nor a shrug. Counseling has measurable benefits, but these sources give no basis for the figure of 70% to 75% as a general marriage counseling success rate.
For the wider research on what makes marriages last, our marriage statistics collect the demographic evidence alongside this clinical work.
Methodology and Sources
This page separates administrative data from clinical outcome research. For therapist supply, our analysis uses Bureau of Labor Statistics, Occupational Employment and Wage Statistics data and Census Bureau population data. The employment counts and the wages are the Bureau’s, the married population is the Census Bureau’s, and the ratios are ours.
Throughout, source labels separate observed administrative counts from ratios created for comparison, and separate published outcome findings from association claims or search result wording.
The labor source is the Bureau of Labor Statistics, Occupational Employment and Wage Statistics, May 2025 release, occupation code 21-1013, marriage and family therapists. We took the figures from the OEWS time series files. The population source is the Census Bureau, American Community Survey 2024 1-year estimates, table B12001, men and women now married, accessed 7 September 2026.
Jurisdiction-level therapist availability is reported only where the underlying employment estimate is published. In this occupation, 40 of 51 jurisdictions have a published employment estimate. We do not compute rates for the remaining jurisdictions, because a missing employment estimate would make the comparison look more precise than the source data allow.
For counseling outcome claims, we used peer-reviewed research and named the specific paper behind each figure that appears in the text. The main outcome sources are Christensen, Atkins, Baucom and Yi, 2010, Journal of Consulting and Clinical Psychology, and Roddy, Walsh, Rothman, Hatch and Doss, 2020, Journal of Consulting and Clinical Psychology. We also used Rathgeber, Bürkner, Schiller and Holling, 2019, Journal of Marital and Family Therapy, Johnson, Hunsley, Greenberg and Schindler, 1999, Clinical Psychology: Science and Practice, and Beasley and Ager, 2019, Journal of Evidence-Informed Social Work.
We treated trade association claims as claims from the association. We did not treat them as independent outcome estimates. The American Association for Marriage and Family Therapy page was read from an archived capture dated 13 April 2026 because the live site blocks automated access. When a claim traced to that page, it is identified above as an association statement.
We also recorded Google AI Overview text on 7 September 2026. That text may change, so it is used only as a record of what the search result said at that time. It is not used as a primary source for clinical effectiveness.
Several common numbers were left out. We found no verifiable figure for what a couples therapy session costs on average in the United States, and no reliable national figure for how many couples enter therapy in a year. Numbers circulating for both trace only to secondary write-ups, so they were excluded.
We also do not report a success rate for the Gottman method. No independent randomized trial producing one could be verified. This does not evaluate the method as a clinical approach, it only explains why no national success-rate figure for that method appears here.
Figures on this page are current as of September 2026.
This page sits in our statistics hub, which collects the rest of our research on marriage, divorce and dating.



