


Barna Group’s 2025 marriage and divorce trends report says practicing Christians are as likely as other adults to have gone through a divorce: 16% of practicing Christians, 16% of non-Christians, and 20% of nonpracticing Christians.
The catch is the denominator. Those shares are counted over all adults, including people who never married.
Someone who never married cannot divorce.
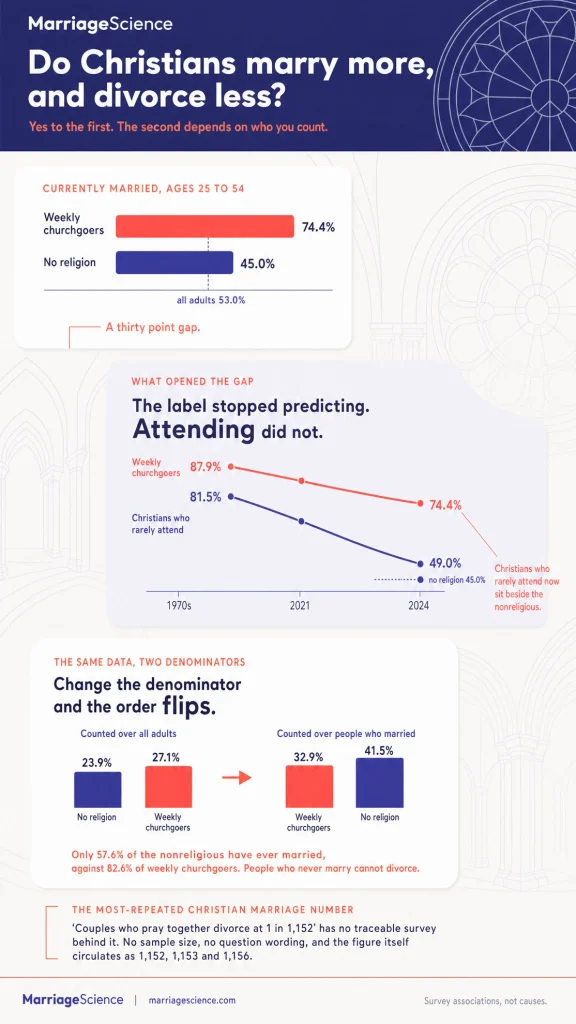
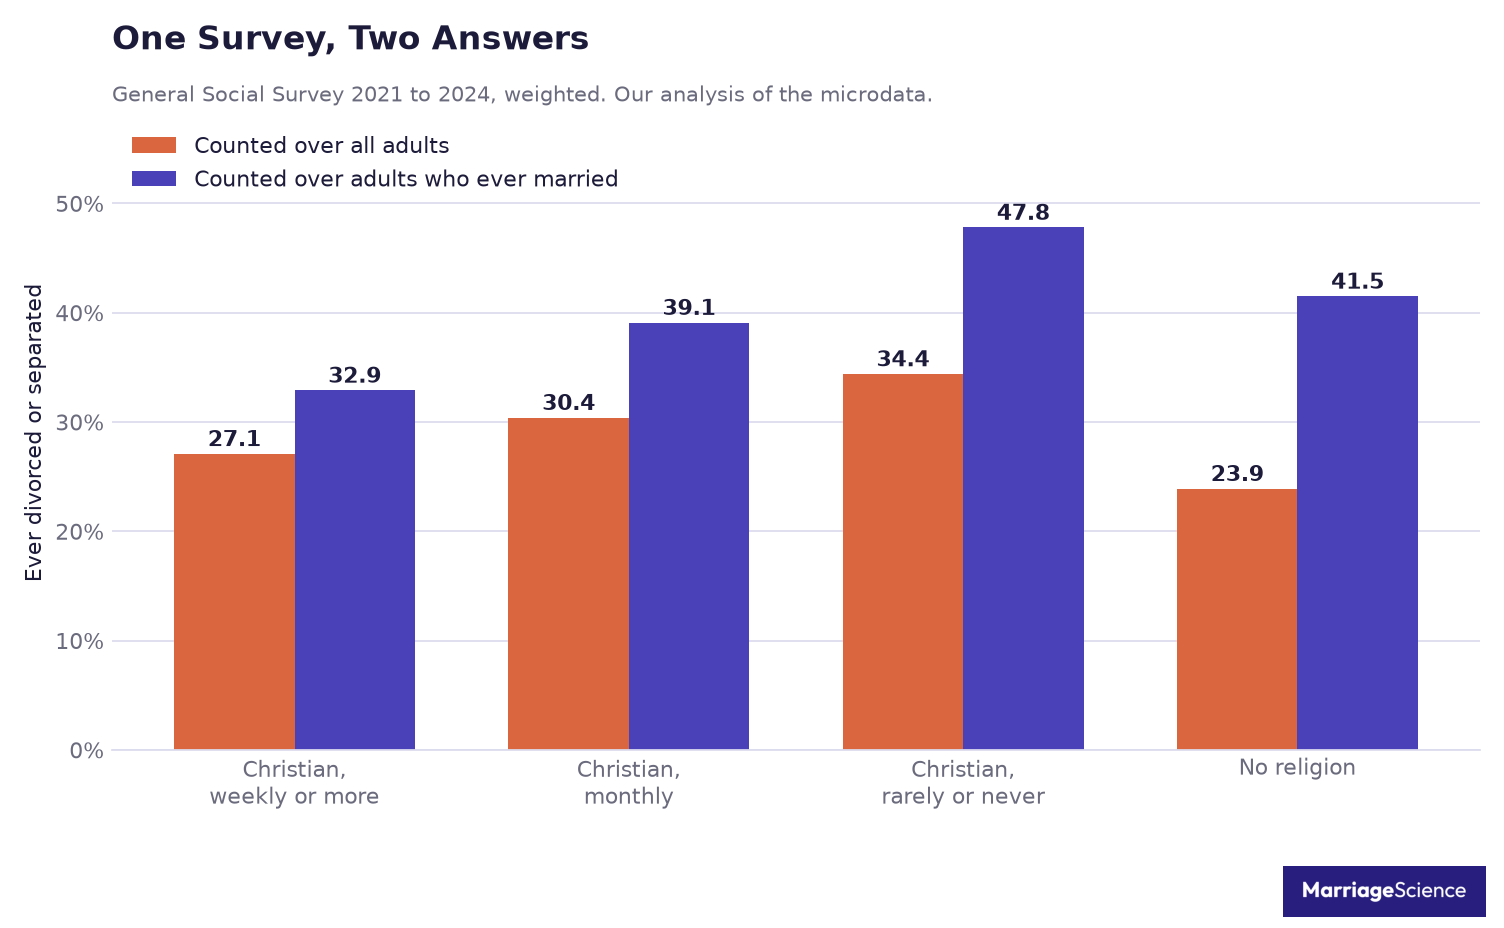
We ran the same comparison in the General Social Survey, 2021 to 2024, both ways. Counted over all adults, Americans with no religion look like the least-divorced group, 23.9% ever divorced or separated, below weekly churchgoers at 27.1%.
That is because only 57.6% of Americans with no religion have ever married, against 82.6% of weekly churchgoers. Counted over people who actually married, the order flips: 32.9% of weekly churchgoers against 41.5% of the nonreligious.
This page is our analysis of the General Social Survey, 1972 to 2024, on Christian marriage in the United States. It follows who marries, how young, whom they marry, how happy they say they are, sex and fidelity, plus where the most repeated Christian marriage numbers come from.
Single and hoping to marry within the faith? Our ranking of the best Christian dating sites compares the services we tested.
Key Statistics on Christian Marriage
Unless another source is named, every figure below is our own analysis of the General Social Survey, 1972 to 2024. Here, “weekly churchgoers” means Christians who attend services weekly or more.
- Barna Group’s 2025 report put the share who have ever divorced at 16% for practicing Christians and 16% for non-Christians, counted over all adults.
- Counted over adults who have married, 2021 to 2024: weekly churchgoers 32.9% ever divorced or separated, adults with no religion 41.5%, Christians who rarely or never attend 47.8%.
- In a 14-year study of 66,444 married nurses, mostly Christian, frequent service attendance was linked to a 50% lower risk of divorce (Li, Kubzansky and VanderWeele, PLoS One, 2018).
- Ages 25 to 54, 2021 to 2024: 74.4% of weekly churchgoers are currently married, against 45.0% of adults with no religion and 53.0% of all adults.
- In the 1970s, 87.9% of weekly churchgoers aged 25 to 54 were married. The rarely-or-never Christian group fell from 81.5% to 49.0% over the same span.
- Christians made up 89.7% of adults in GSS surveys in the 1970s and 65.1% in 2021 to 2024.
- Ages 18 to 29, 2021 to 2024: 31.5% of weekly churchgoers are married, against 17.8% of all adults that age.
- Ages 25 to 34, 2010 to 2024: 71.6% of weekly churchgoers have ever married, against 37.4% of adults with no religion.
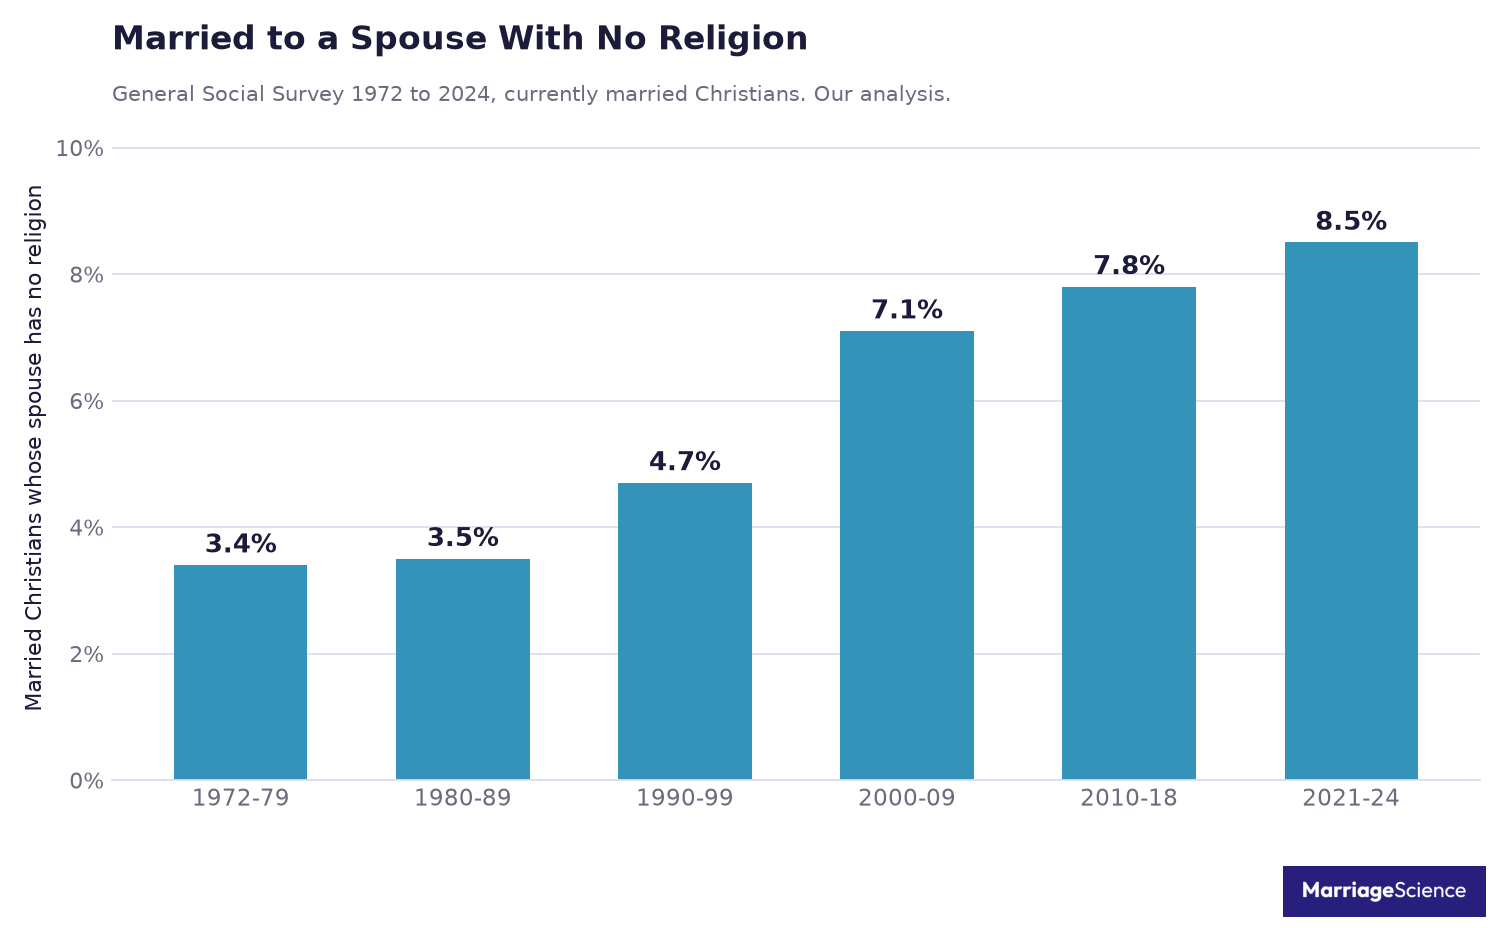
- 8.5% of married Christians in 2021 to 2024 had a spouse with no religion, up from 3.4% in the 1970s.
- Among weekly churchgoers the share married to someone with no religion is 2.9%. Among Christians who rarely or never attend it is 13.3%.
- Pew Research Center: 39% of Americans who married since 2010 have a spouse from a different religious group, against 19% of those who wed before 1960.
- 67.7% of married weekly churchgoers call their marriage “very happy”, against 57.7% of married adults with no religion, 2010 to 2024, age-standardized.
- Married Christians whose spouse has no religion: 48.8% “very happy”. Christians married to another Christian: 64.1%.
- Married weekly churchgoers aged 18 to 59 report sex about 67.6 times a year, adults with no religion about 53.4 times.
- 13.0% of ever-married weekly churchgoers say they have had sex with someone other than their spouse while married, against 20.6% of ever-married adults with no religion.
- Church introduced 4% of heterosexual couples who met in 2017, down from 7% in 1995. Online introduced 39% (Rosenfeld, Thomas and Hausen, PNAS, 2019).
Christians Are More Likely to Be Married
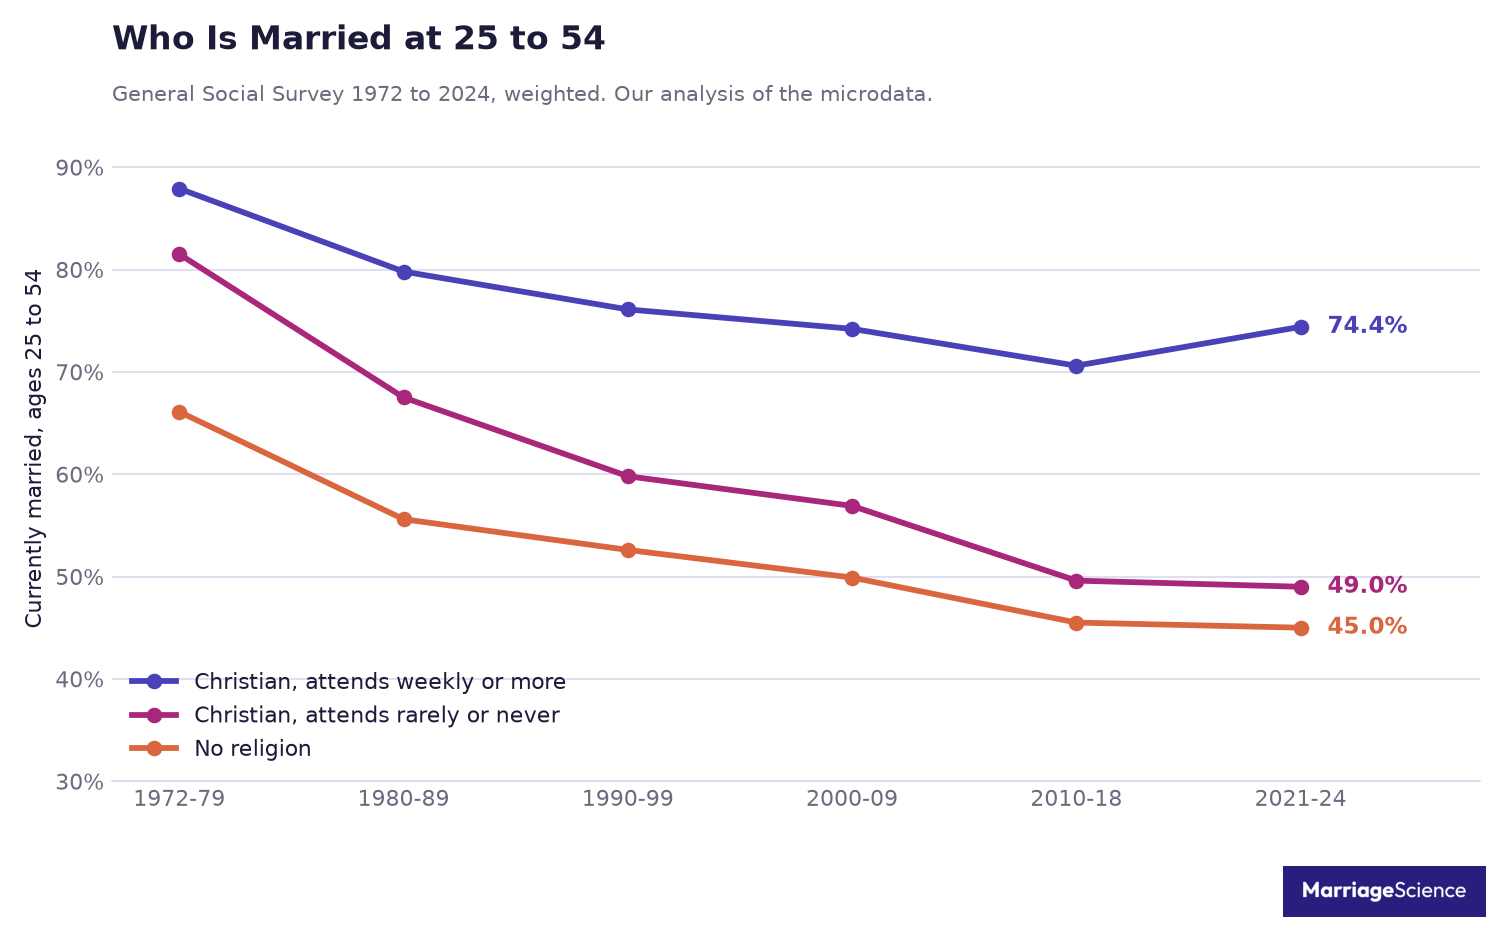
Our analysis of the General Social Survey finds a large marriage gap by religion and attendance among adults aged 25 to 54. In 2021 to 2024, 74.4% of weekly churchgoers were currently married, compared with 45.0% of adults with no religion and 53.0% of all adults in the same age range.
The wider story is a long decline in marriage across the country. Among all adults aged 25 to 54, the married share fell from 82.8% in the 1970s to 53.0% in 2021 to 2024.
Among all Christians together, it fell from 84.1% to 57.3%.
Weekly churchgoers also saw a decline from the 1970s, but their line moved less. Their married share was 87.9% in 1972 to 1979, 79.8% in the 1980s, 76.1% in the 1990s, 74.2% in the 2000s, 70.6% in 2010 to 2018, and 74.4% in 2021 to 2024.
Other groups fell much further, which is why the latest gap is so wide.
The gap between the most and least observant Christians was small in the 1970s, 87.9% against 81.5%. In 2021 to 2024, it was 74.4% against 49.0%.
A Christian label alone predicts little in the recent data. Christians who rarely or never attend now sit close to adults with no religion, 49.0% against 45.0%.
Christians attending monthly to nearly weekly also moved down, from 84.0% in the 1970s to 61.0% in 2021 to 2024.
| Period | Weekly churchgoers | Monthly | Rarely or never | No religion | All adults |
| 1972 to 1979 | 87.9% | 84.0% | 81.5% | 66.1% | 82.8% |
| 1980s | 79.8% | 70.2% | 67.5% | 55.6% | 70.5% |
| 1990s | 76.1% | 67.2% | 59.8% | 52.6% | 64.6% |
| 2000s | 74.2% | 64.6% | 56.9% | 49.9% | 61.3% |
| 2010 to 2018 | 70.6% | 59.5% | 49.6% | 45.5% | 55.3% |
| 2021 to 2024 | 74.4% | 61.0% | 49.0% | 45.0% | 53.0% |
The latest period is large enough to compare groups directly. It includes 614 weekly churchgoers, 649 monthly attenders, 1,607 Christians who rarely or never attend, and 1,720 adults with no religion.
There is one caution. Weekly churchgoers are a smaller and more committed group than they were in the 1970s, when Christians were 89.7% of all adults, compared with 65.1% in 2021 to 2024.
Part of the steadiness may reflect who still attends, and the survey cannot separate that from any effect of attending.
The child count follows the same ordering among adults aged 40 to 59 in 2010 to 2024. Weekly churchgoers reported 2.51 children on average, monthly attenders reported 2.40, Christians who rarely or never attend reported 2.08, and adults with no religion reported 1.80.
Young Christian Marriage
Our analysis of the General Social Survey shows young marriage falling among churchgoers too. Among Christians aged 18 to 29 who attend services weekly or more, the share currently married fell from 51.5% in the 1970s to 31.5% in 2021 to 2024.
That is a drop of 20 points.
The wider age group fell further. Among all adults aged 18 to 29, the currently married share went from 49.4% in the 1970s to 17.8% in 2021 to 2024.
In the 1970s, weekly churchgoers and the average young adult were about level, 51.5% against 49.4%. By 2021 to 2024, weekly churchgoers were almost twice as likely to be married at that age, 31.5% against 17.8%.
The period pattern is steady. Marriage fell across young adulthood, but weekly churchgoing Christians kept a higher married share in every period shown here.
| Period | Weekly churchgoers 18 to 29 | All adults 18 to 29 |
| 1970s | 51.5% | 49.4% |
| 1980s | 44.5% | 38.8% |
| 1990s | 41.8% | 32.1% |
| 2000s | 40.2% | 26.1% |
| 2010 to 2018 | 34.6% | 18.8% |
| 2021 to 2024 | 31.5% | 17.8% |
A second view uses ever married status. In the 2010 to 2024 pooled data for adults ages 25 to 34, there is a clear attendance gradient.
Weekly churchgoers were 71.6% ever married, compared with 55.3% among monthly attenders, 44.4% among Christians who rarely or never attend, and 37.4% among adults with no religion. That measure includes people who are married now and people who have been married before, so it captures entry into marriage more than current marital status alone.
The pattern also matches an outside check focused on evangelicals. Sociologist Mark Regnerus reported from an Austin Institute survey that 56% of evangelicals aged 20 to 39 were married in 2014, against 42% of everyone else that age.
In the 2014 General Social Survey, Protestants who report a “born again” experience, aged 20 to 39, were 54.9% married against 41.0% of all adults that age. Close enough to call it reproduced.
The timing piece matters because young adult partnership has shifted toward later marriage and more cohabitation. The Institute for Family Studies research brief The Religious Marriage Paradox reports that women who grew up religious are about 20% less likely to begin a cohabiting union in any given year, and that religious twenty-somethings who marry directly without cohabiting appear to have the lowest divorce rates.
Religious participation is linked to a different path through early adulthood in these data. Young Christian marriage has declined, but it has declined from a higher starting point and remains much more common than the age-group average.
Age at marriage differs across the country as well as across congregations. Our analysis of the average marriage age maps it state by state.
Cohabitation has its own research record, covered in our analysis of living together before marriage.
How Many Christians Marry Another Christian
Most married Christians are still married to another Christian, but the pattern has loosened over time. The figures below are our analysis of the General Social Survey.
Among currently married Christians, 96.2% had a Christian spouse in the 1970s. In 2021 to 2024, 89.9% did.
The same direction appears inside Christian traditions. The share with a spouse in the same broad group, such as Protestant married to Protestant or Catholic married to Catholic, moved from 86.6% in the 1970s to 75.9% in 2021 to 2024.
| Period | Spouse is Christian | Same broad group | Spouse has no religion |
| 1972 to 1979 | 96.2% | 86.6% | 3.4% |
| 1980s | 95.3% | 86.7% | 3.5% |
| 1990s | 94.0% | 83.4% | 4.7% |
| 2000s | 91.4% | 80.0% | 7.1% |
| 2010 to 2018 | 90.5% | 78.4% | 7.8% |
| 2021 to 2024 | 89.9% | 75.9% | 8.5% |
The clearest change is the growth in Christians married to someone with no religion. That share was 3.4% in the 1970s, 3.5% in the 1980s, 4.7% in the 1990s, 7.1% in the 2000s, 7.8% in 2010 to 2018, and 8.5% in 2021 to 2024.
Across the series, the share has more than doubled.
Attendance is strongly linked to these marriage patterns. From 2010 to 2024, 2.9% of weekly churchgoers had a spouse with no religion, compared with 5.9% of monthly attenders and 13.3% of Christians who rarely or never attended.
Rarely or never means attending several times a year or less.
The same attendance split appears for same broad group marriages. From 2010 to 2024, 90.5% of weekly churchgoers were married within the same broad group, compared with 83.2% of monthly attenders and 64.0% of those who rarely or never attended.
Mixed marriages are concentrated among Christians who rarely attend.
Pew Research Center reported a related national pattern in its Religious Landscape Study 2014. It found that 69% of married Americans said their spouse shared their religion.
Among those married since 2010, 39% were in a religious intermarriage, compared with 19% of those who wed before 1960.
Pew also found that Christians married to a religiously unaffiliated spouse made up 18% of marriages since 2010, compared with 5% before 1960. Pew counts only marriages still intact, so its figures describe current marriages among people who married in those periods.
Our GSS figure for all married adults in 2014 with a spouse in the same broad religious group was 74.1%, higher than Pew’s 69% because the GSS groups are coarser, with all Protestants counted as one group. Pew’s 18% for recent Christian and unaffiliated marriages is higher than our 8.5% because it looks only at couples who married after 2010.
Our figure covers every married couple of any age.
Marital Happiness Among Christians
In our analysis of the General Social Survey, marital happiness is highest among married Christians who attend services weekly or more. For married adults in 2010 to 2024, 67.7% of weekly churchgoers called their marriage “very happy,” compared with 61.2% of Christians attending monthly, 59.5% of Christians attending rarely or never, and 57.7% of adults with no religion.
These attendance figures are age-standardized, with each group weighted to the same age mix. The unadjusted figure for all married adults was 61.5%.
The sample sizes behind the attendance rows were 2,339, 1,676, 3,075, and 1,855.
| Group | Very happy |
| Weekly churchgoers | 67.7% |
| Christians attending monthly | 61.2% |
| Christians attending rarely or never | 59.5% |
| No religion | 57.7% |
| Christians married to another Christian | 64.1% |
| Christians married to someone with no religion | 48.8% |
The attendance gap is 10 points from weekly churchgoers to Christians who attend rarely or never. The gap by the religion of the spouse is bigger.
Christians married to another Christian reported 64.1% very happy, while Christians married to someone with no religion reported 48.8% very happy.
That second comparison is about 15 points. It comes from one spouse’s answer, and the smaller group, Christians married to someone with no religion, included 591 people.
It is a survey association and says nothing about any one couple.
The direction is open. An unhappy Christian in a mixed religion marriage may have stopped attending services, and a Christian who rarely attends may be more likely to marry someone with no religion.
The survey cannot say which came first, and it cannot describe the private life of both spouses.
The long-run trend among married Christians is fairly steady. The share calling their marriage very happy was 67.3% in the 1970s, then 63.1%, 62.7%, 61.6%, 63.0%, and 62.0% in 2021 to 2024.
That pattern is roughly flat for 30 years, with no clear recent break in the GSS series.
Ellison, Burdette and Wilcox reported a related pattern in Journal of Marriage and Family. Their 2010 article The Couple That Prays Together used a 2006 telephone survey of 2,400 working-age adults aged 18 to 59 and found that couples’ in-home devotional activities and shared religious beliefs were linked with higher relationship quality.
It measured relationship quality, not divorce.
Taken together, the GSS figures point to two separate associations. Service attendance goes with somewhat higher marital happiness among married Christians, and shared religious identity inside the couple goes with a larger gap.
The “1 in 1,152” Prayer Statistic
The “1 in 1,152” prayer statistic is one of the most repeated Christian marriage claims online. The usual wording says couples who pray together divorce at a rate of 1 in 1,152, credited to “a 1997 Gallup poll” done for a “National Association of Marriage Enhancement.”
The same claim does not appear in one stable form. The rate also appears as 1 in 1,153 and 1 in 1,156, and the sponsor is sometimes called the National Association of Marriage Enrichment.
Those variations are a warning sign, because the claim is being passed around without the ordinary details that let a reader check it.
We found no Gallup release, no sample size, no question wording and no definition of “regularly” behind the number. Those omissions matter for any divorce statistic.
A claim about prayer and divorce needs to say who was surveyed, how couples were counted, what time period was covered and what “pray together” meant.
The figure is often attached to the 2010 Journal of Marriage and Family study “The Couple That Prays Together.” That paper measured relationship quality.
It did not report divorce rates, so it cannot be the source for the 1 in 1,152 divorce rate.
This does not mean shared prayer has no connection with marriage. It means this specific number cannot be traced to a survey anyone can check.
Faith practices are personal, and couples may experience prayer as part of intimacy, conflict repair or shared meaning, but a viral divorce rate still needs a source.
What can be sourced is narrower. The Nurses’ Health Study result tied frequent attendance to a 50% lower risk of divorce over 14 years, and our analysis of the General Social Survey reports attendance gaps later on this page.
For that reason, we leave the 1 in 1,152 figure out of every table here.
Sex in Christian Marriages
Sex is one place where the stereotype about Christian marriage runs ahead of the survey data. In our analysis of the General Social Survey, married adults aged 18 to 59 who were weekly churchgoers reported the highest sexual frequency among the groups in this section.
Weekly churchgoers reported sex about 67.6 times a year, and 58.3% said they had sex weekly or more. Among Christians who attended monthly, the estimate was 66.5 times a year, with 56.2% reporting sex weekly or more.
The estimates decline among less religious groups, but the pattern is gradual. Christians who rarely or never attend reported 63.8 times a year, and 50.7% had sex weekly or more.
Adults with no religion reported 53.4 times a year, and 44.7% had sex weekly or more.
| Group | Times a Year | Weekly or More | None in Past Year |
| Weekly churchgoers | 67.6 | 58.3% | 2.3% |
| Monthly attenders | 66.5 | 56.2% | 3.0% |
| Christians who rarely or never attend | 63.8 | 50.7% | 4.3% |
| No religion | 53.4 | 44.7% | 4.9% |
The gap between weekly churchgoers and the nonreligious is about 14 times a year. That does not mean attendance causes a couple to have more sex.
These are correlations in survey answers, and the groups differ in background, family structure and other ways even after age-standardization.
Sexless marriages are rare in every group. Only 2.3% of weekly churchgoers said they had no sex in the past year.
The comparable shares were 3.0% among monthly attenders, 4.3% among Christians who rarely or never attend, and 4.9% among adults with no religion.
These figures come from self-reports in bands for 2010 to 2024, so the times a year column should be read as an estimate. The underlying samples were 926 weekly churchgoers, 721 monthly attenders, 1,275 Christians who rarely or never attend, and 895 adults with no religion.
The popular image of religious marriages as less sexual does not show in these answers. A fuller look at married sex frequency is in our analysis of how often couples have sex.
Infidelity and Church Attendance
Our analysis of the General Social Survey looks at ever-married adults from 2010 to 2022 and uses the question, “Have you ever had sex with someone other than your husband or wife while you were married?” The results are age-standardized, so the comparison is not driven by older or younger age profiles across religious groups.
Among weekly churchgoers, 13.0% answered yes. The share was 14.0% among monthly attenders, 16.4% among Christians who rarely or never attend, and 20.6% among adults with no religion.
| Group | Men | Women | All |
| Weekly churchgoers | 16.9% | 10.4% | 13.0% |
| Monthly | 18.0% | 11.2% | 14.0% |
| Rarely or never | 18.9% | 14.3% | 16.4% |
| No religion | 23.0% | 17.7% | 20.6% |
The gender pattern is clear. Men report higher levels of marital infidelity than women in every attendance group, but the attendance gradient is steeper for women than for men.
Among men, the three Christian groups sit within two points of each other: 16.9% for weekly churchgoers, 18.0% for monthly attenders, and 18.9% for those who rarely or never attend. Men with no religion are higher at 23.0%.
Among women, the spread is wider. The share is 10.4% for weekly churchgoers, 11.2% for monthly attenders, 14.3% for those who rarely or never attend, and 17.7% for women with no religion.
The sample sizes were 2,184 for weekly churchgoers, 1,505 for monthly attenders, 3,034 for rarely or never attenders, and 1,672 for adults with no religion. These are survey answers about a person’s whole marriage history.
The data cannot say whether attendance came before or after the affair, and people who strayed may also have left church afterwards.
Christian Divorce Rates, Counted Two Ways
Divorce statistics for Christians can tell different stories because the denominator changes. An all adults rate mixes marital history with divorce history: whether someone has ever married, and whether an ever married person has later divorced or separated.
When the denominator includes everyone, groups that marry less can look as if they divorce less.
That is why a plain claim that Christians divorce as often as everyone else needs a careful read. Barna Group’s 2025 marriage and divorce trends report puts the ever divorced share at 16% among practicing Christians, 16% among non-Christians, 20% among nonpracticing Christians, and 18% among all U.S. adults.
It also reports that 58% of divorced Christians have remarried, and adds that Christians “remain more likely than their peers of other faith groups to be married”. The page gives no sample size.
The same publisher’s 2008 report found a closer split: 32% of born-again adults and 33% of other adults had ever divorced. Those findings are often cited in short form, but the short form leaves out the marriage denominator.
GSS shares are higher than those figures, partly because the GSS outcome counts legal separation as well as divorce. Our analysis of the General Social Survey, using 2021 to 2024, also separates attendance groups instead of treating all Christians as a single block.
| Group | Ever divorced, all adults | Ever married | Ever divorced, ever married |
| Weekly churchgoers | 27.1% | 82.6% | 32.9% |
| Monthly | 30.4% | 77.7% | 39.1% |
| Christians who rarely or never attend | 34.4% | 72.0% | 47.8% |
| No religion | 23.9% | 57.6% | 41.5% |
On the all adults measure, people with no religion are at 23.9%, below weekly churchgoers at 27.1% and Christians who rarely or never attend at 34.4%. That comparison is shaped by marriage itself: 57.6% of people with no religion had ever married, compared with 82.6% of weekly churchgoers and 72.0% of Christians who rarely or never attend.
The low figure for no religion is a real survey result. It also folds marriage rates into what looks like a divorce statistic.
Among ever married adults, weekly churchgoers are at 32.9%, monthly attenders are at 39.1%, people with no religion are at 41.5%, and Christians who rarely or never attend are at 47.8%. In this table, the highest rate belongs to Christians who rarely or never attend, 47.8%.
Monthly attenders sit between weekly churchgoers and Christians who rarely or never attend on both divorce columns.
The Nurses’ Health Study analysis by Li, Kubzansky and VanderWeele, published in PLoS One in 2018, followed 66,444 married nurses in their 50s, mostly Christian, from 1996 to 2010. In that study, frequent service attendance was linked to a 50% lower risk of divorce, with a 95% confidence interval of 32% to 63%, and a 52% lower risk of divorce or separation.
Because the study measured attendance before the divorces happened, it answers part of the objection that people simply stop attending after a divorce.
The short version is that Christian divorce rates vary by attendance and by denominator. A headline comparing all adults is useful only if readers also know how many people in each group have ever married.
Our full breakdown by denomination and attendance is in our analysis of the divorce rate by religion.
Abuse in Christian Marriages
There is no national survey we could find that measures a rate of abuse in Christian marriages. The General Social Survey does not ask about domestic violence, so we cannot compute one for Christian marriages, weekly churchgoers, or any other religious attendance group in our main data source.
The best evidence we found comes from wave 1 of the National Survey of Families and Households, analyzed in three peer-reviewed papers led by Christopher Ellison. These papers study reported domestic violence and religious involvement, so they are useful for context, but they are not a current national rate for abuse inside Christian marriages.
Ellison, Bartkowski and Anderson, published in the Journal of Family Issues in 1999, found that regular attendance was linked to lower self-reported perpetration for both men and women. Whether the couple shared a denomination mattered little.
Men who held much more conservative theological views than their partners were especially likely to perpetrate domestic violence.
Ellison and Anderson, published in the Journal for the Scientific Study of Religion in 2001, found that among men the lower risk showed only for weekly attenders, while among women it also showed for monthly attenders. The pattern held in the partner’s own reports and after controls for social support, alcohol and drug use, self-esteem and depression.
Ellison, Trinitapoli, Anderson and Johnson, published in Violence Against Women in 2007, found that the link with attendance was stronger for African American men and women and for Hispanic men. These are associations from one survey wave fielded in the late 1980s.
They describe averages, and they say nothing about any one home.
Anyone in danger can reach the National Domestic Violence Hotline.
Where Christian Couples Meet Now
The meeting story for couples has moved away from older social channels and toward online introductions. In 2019, Rosenfeld, Thomas and Hausen reported in PNAS on the How Couples Meet and Stay Together survey of heterosexual couples.
From 1995 to 2017, online meeting rose from 2% to 39%.
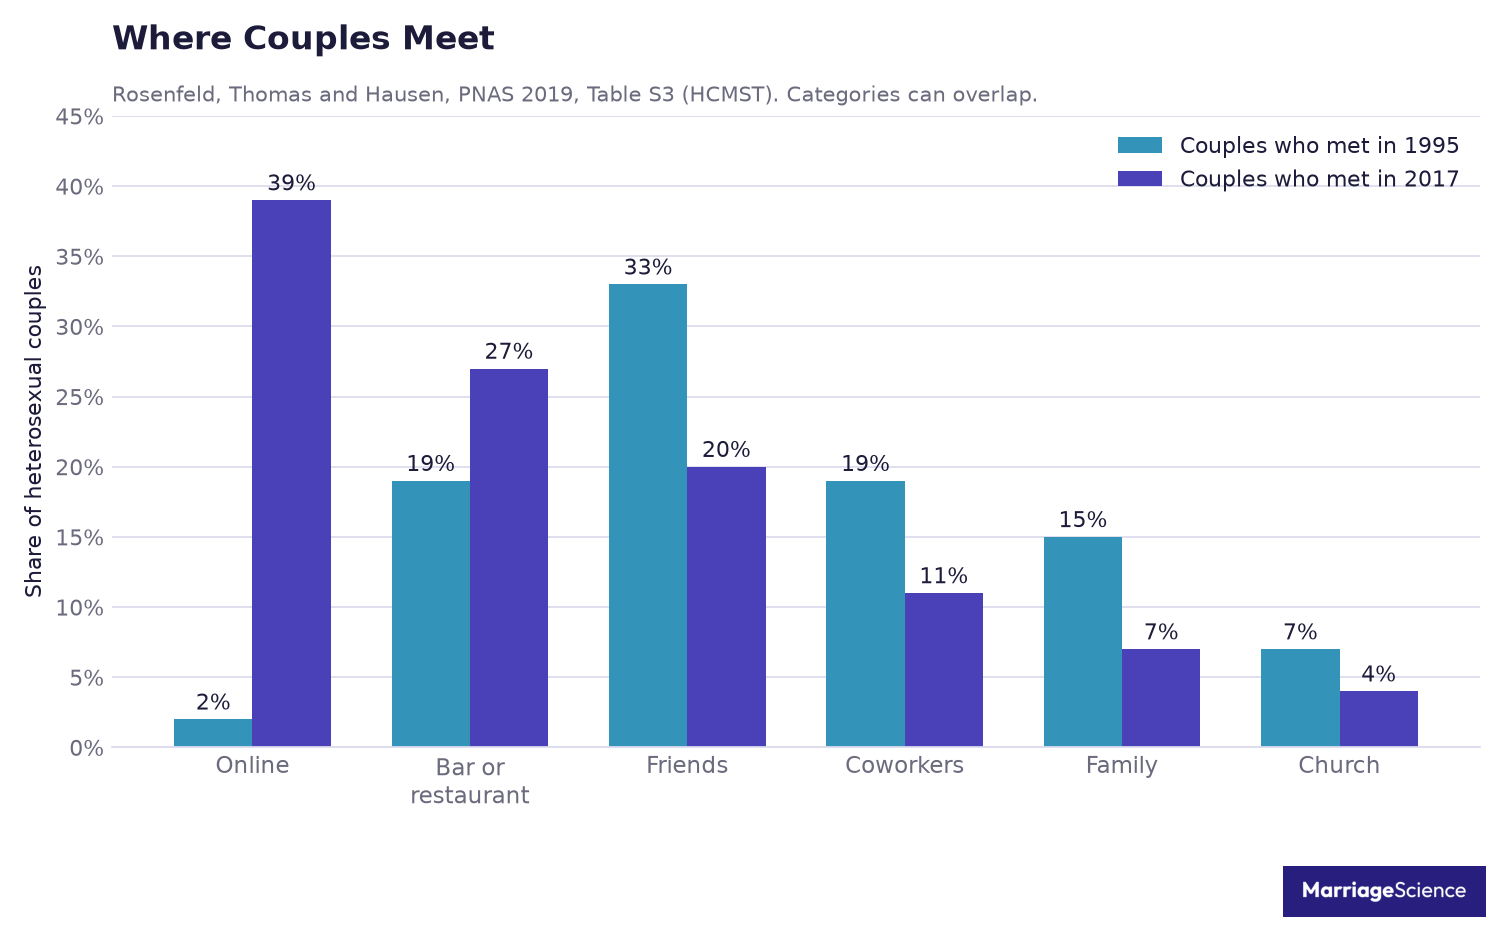
Other channels changed at the same time. Meeting through friends fell from 33% to 20%, meeting through family fell from 15% to 7%, and meeting through coworkers fell from 19% to 11%.
Bars or restaurants moved the other way, from 19% to 27%, while church fell from 7% to 4%.
Those figures describe all heterosexual couples in that survey, not Christian couples alone. The categories can overlap, so they should be read as reported pathways instead of a single exclusive box for each couple.
Still, the church line matters for Christians because it shows fewer couples naming church as one of the places they met.
In our analysis of the General Social Survey, among weekly churchgoers, 90.5% were married to a spouse in the same broad group, and only 2.9% were married to someone with no religion.
The practical issue is the size and visibility of the dating pool. The Christian share of adults fell from 89.7% to 65.1%, while church also became a less common reported meeting place in the couple survey.
A single Christian who wants a Christian spouse may be looking in a smaller pool with fewer church-based introductions than earlier cohorts had.
Faith-specific dating services fill a gap in that setting. They give Christian singles a place where faith identity, denomination, and worship habits can be stated directly before a first date.
For readers comparing options, our ranking of the best Christian dating sites focuses on services built for people who want Christian identity to be part of the search from the start.
ChristianCafe has run since 1999. Its free trial lets you send messages, and its search filters are built around faith.
The site can work well for Christians who want belief and practice to appear in the search process early, but its member pool is smaller outside big cities. That tradeoff is central to our ChristianCafe review.
For what the research says about couples who meet on apps and sites, see our review of the online dating success rate.
Methodology and Sources
Our analysis uses the cumulative General Social Survey file for 1972 to 2024, administered by NORC at the University of Chicago. The file contains 75,699 interviews, which lets us compare marital status, divorce history, religious identity, attendance, and selected relationship outcomes across the full series.
We applied WTSSALL through 2018 and WTSSPS from 2021, following NORC’s guidance for the two eras. Those weights align the survey samples with the adult population covered in each period and avoid mixing the older and newer weighting systems.
We define Christian as Protestant, Catholic, Orthodox or people who identify simply as “Christian.” Weekly churchgoers are Christians who attend services weekly or more often. The other attendance bands are monthly to nearly weekly and several times a year or less.
No religion is coded as “none.”
For happiness, sex and infidelity, we age standardize the estimates. Each group is weighted to the age mix of the whole base in six bands, from 18 to 29 through 70 and older, because these outcomes change with age and churchgoers are older on average.
Our divorce measure is broader than current status alone. Ever divorced or separated includes people currently divorced or separated, plus people who are married or widowed and answered yes to whether they had ever been divorced or separated.
We ran two checks against outside benchmarks. For 2014, our figure for married born-again Protestants aged 20 to 39 is 54.9%, close to the 56% Mark Regnerus reported for evangelicals that year.
Our same-religion marriage share is 74.1%, which sits where expected next to Pew’s 69%, given our coarser religious groups.
We also kept several claims out of the article. We excluded the 1 in 1,152 prayer figure because it is untraceable.
We excluded age at first marriage by religion because the GSS last asked it in 2006. We did not publish a national rate of abuse in Christian marriages because no survey in this source set measures it, and we left out company claims about marriages made on dating sites.
Every comparison is a correlation in survey data. It does not show that attending church causes any of these outcomes.
The estimates describe patterns by religious identity and attendance, with the limits of self-reported survey data.
Sources used for this article are listed below.
- General Social Survey 1972 to 2024
- Barna Group, Marriage and Divorce Trends, 2025
- Barna Group, New Marriage and Divorce Statistics Released, 2008
- Li, Kubzansky and VanderWeele, PLoS One, 2018
- Ellison, Burdette and Wilcox, Journal of Marriage and Family, 2010
- Ellison, Bartkowski and Anderson, Journal of Family Issues, 1999
- Ellison and Anderson, Journal for the Scientific Study of Religion, 2001
- Ellison, Trinitapoli, Anderson and Johnson, Violence Against Women, 2007
- Pew Research Center, interfaith marriage, 2015
- Rosenfeld, Thomas and Hausen, PNAS, 2019
- Institute for Family Studies, The Religious Marriage Paradox



