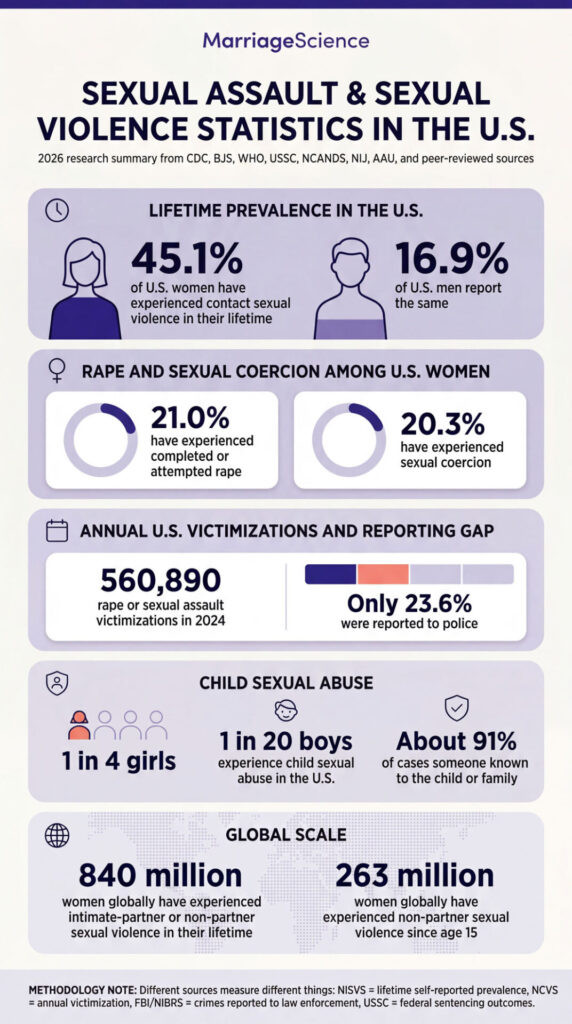
Nearly half of U.S. women – 45.1%, or 57.7 million people – have experienced some form of contact sexual violence in their lifetime, according to the CDC’s most recent NISVS release. More than 1 in 6 men (16.9%) report the same. Globally, the World Health Organization estimates that 840 million women have endured intimate-partner or non-partner sexual violence in their lifetime. Only about 1 in 4 rape or sexual assault victimizations in the United States were reported to police in 2024.
We aggregated data from the CDC’s National Intimate Partner and Sexual Violence Survey (NISVS), the Bureau of Justice Statistics’ National Crime Victimization Survey (NCVS), the FBI’s NIBRS, the World Health Organization, the U.S. Sentencing Commission, the National Child Abuse and Neglect Data System (NCANDS), the Association of American Universities, the National Institute of Justice, and peer-reviewed studies. Each of these instruments measures something different – NISVS captures lifetime self-reported victimization, NCVS captures past-year crime victimizations whether reported or not, FBI data captures crimes reported to law enforcement, and USSC tracks federal sentencing outcomes – and the figures should be read alongside those methodological labels rather than averaged together.
What Changed in 2025 and 2026
Four major data releases reshaped the sexual assault statistical landscape in the past 18 months, and the figures in this article reflect all of them:
- CDC released the first new NISVS data brief since 2016/2017 (December 2025). The 2023/2024 brief uses revised methodology, a new address-based push-to-web sampling approach, and adds technology-facilitated sexual violence as a measured category for the first time. The CDC explicitly cautions against comparing the new figures to earlier NISVS waves.
- BJS published Criminal Victimization, 2024 (September 2025) with a split-sample design that ran the legacy NCVS instrument alongside the redesigned questionnaire. The split halved the effective sample size for each instrument, widening confidence intervals and producing some single-year swings – including the reported-to-police share for rape and sexual assault falling from 46.0% in 2023 to 23.6% in 2024 – that BJS flags as influenced by the redesign rather than a clean behavioral change.
- WHO and UN partners released the first global estimates of non-partner sexual violence (November 2025), finding that 263 million women have experienced non-partner sexual violence since age 15. Combined with intimate-partner violence figures, the lifetime total reaches 840 million women globally.
- The USSC’s FY2024 figures show federal sexual abuse cases up 62.5% since FY2020, with 1,430 cases sentenced in FY24 at an average sentence of 221 months.
These four releases mean any sexual assault statistic citing pre-2023 NISVS, pre-2024 NCVS, or pre-2025 WHO figures is now out of date.
Main Outcomes
- 45.1% of U.S. women and 16.9% of U.S. men have experienced contact sexual violence in their lifetime (CDC NISVS 2023/2024 Data Brief).
- 21.0% of U.S. women have experienced completed or attempted rape; another 20.3% have experienced sexual coercion (CDC NISVS 2023/2024).
- Around 840 million women globally – nearly 1 in 3 – have experienced intimate-partner or non-partner sexual violence in their lifetime (WHO, November 2025).
- 263 million women globally have experienced non-partner sexual violence since age 15 (WHO, November 2025).
- The rate of rape or sexual assault was 2.0 per 1,000 persons age 12 or older in 2024, with about 560,890 victimizations (BJS NCVS 2024).
- Only 23.6% of rape or sexual assault victimizations were reported to police in 2024, down from 46.0% in 2023 (BJS NCVS 2024).
- About 1 in 4 girls and 1 in 20 boys in the United States experience child sexual abuse; roughly 91% of cases involve a perpetrator known to the child or family (CDC, Fast Facts: Preventing Child Sexual Abuse).
- 93.5% of individuals federally sentenced for sexual abuse in fiscal year 2024 were men; the average sentence was 221 months (USSC FY24 Quick Facts on Sexual Abuse).
- 56.1% of American Indian and Alaska Native women have experienced sexual violence in their lifetime (National Institute of Justice, 2016 NISVS AIAN analysis).
- 26.4% of undergraduate women at participating universities reported nonconsensual sexual contact by physical force or inability to consent (AAU Campus Climate Survey 2019).
- 28.2% of U.S. women have experienced technology-facilitated sexual violence in their lifetime, a new measure added to NISVS in 2023/2024 (CDC NISVS 2023/2024).
- 75.6% of perceived offenders in violent victimizations in 2024 were male (BJS NCVS 2024).
For every rape or sexual assault reported to police in 2024, roughly 72 people reported experiencing contact sexual violence in past-year health surveys – an order-of-magnitude gap between official crime statistics and population-level prevalence (Marriage Science analysis of CDC NISVS 2023/2024 and BJS NCVS 2024).
1. U.S. Lifetime Prevalence
The headline NISVS figure – 45.1% of U.S. women – collapses four distinct experiences into one number. Disaggregating matters: rape (21.0%), sexual coercion (20.3%), and unwanted sexual contact (39.0%) measure separate behaviors that secondary sources often blur together.
Roughly 1 in 3 U.S. women has also experienced verbal sexual harassment in a public place (29.5%) or workplace (30.4%), and more than 1 in 4 has experienced technology-facilitated sexual violence (28.2%).
The CDC cautions against comparing the 2023/2024 brief to earlier NISVS waves because of changes to methodology, sampling, and how sexual-violence questions are now asked – readers looking at multi-year trend lines should treat 2023/2024 as a new baseline rather than the next data point in a series.
| Metric | Value | Source |
|---|---|---|
| U.S. women, lifetime contact sexual violence | 45.1% (57.7 million) | CDC NISVS 2023/2024 Data Brief |
| U.S. women, lifetime completed or attempted rape | 21.0% (26.8 million) | CDC NISVS 2023/2024 Data Brief |
| U.S. women, lifetime sexual coercion | 20.3% (26.0 million) | CDC NISVS 2023/2024 Data Brief |
| U.S. women, lifetime unwanted sexual contact | 39.0% (49.9 million) | CDC NISVS 2023/2024 Data Brief |
| U.S. men, lifetime contact sexual violence | 16.9% (20.6 million) | CDC NISVS 2023/2024 Data Brief |
| U.S. men, lifetime completed or attempted rape | 3.2% (3.9 million) | CDC NISVS 2023/2024 Data Brief |
| U.S. men, lifetime made to penetrate someone else | 3.8% (4.6 million) | CDC NISVS 2023/2024 Data Brief |
| State range, lifetime contact sexual violence (women) | 35.1% to 69.9% | CDC NISVS 2023/2024 Data Brief |
Source: CDC NISVS 2023/2024 Sexual Violence Data Brief (PDF).
2. Annual Incidence and Reported Crime
NCVS measures past-year victimizations whether or not they were reported to police, while NISVS measures lifetime self-reported violence – the two surveys consistently produce different annual numbers, and that’s by design rather than error.
BJS reported 560,890 rape or sexual assault victimizations in 2024 at a rate of 2.0 per 1,000 persons age 12 or older. The NCVS underwent its first major instrument redesign since 1992 in 2024, and BJS split the sample in half between the legacy and redesigned questionnaires.
Cutting the sample in half widened confidence intervals across every estimate, which is why BJS flags single-year comparisons with caution and why a few of the year-over-year swings below carry larger error bars than usual.
| Metric | Value | Source |
|---|---|---|
| U.S. rape or sexual assault victimizations, 2024 | 560,890 | BJS NCVS 2024 |
| U.S. rape or sexual assault rate, 2024 | 2.0 per 1,000 persons age 12+ | BJS NCVS 2024 |
| U.S. rape or sexual assault rate, 2023 | 1.7 per 1,000 persons age 12+ | BJS NCVS 2024 |
| % of rape/sexual assault reported to police, 2024 | 23.6% | BJS NCVS 2024 |
| % of rape/sexual assault reported to police, 2023 | 46.0% | BJS NCVS 2024 |
| Total violent victimization rate, 2024 | 23.3 per 1,000 persons age 12+ | BJS NCVS 2024 |
| Intimate partner violence rate, 2024 | 2.7 per 1,000 persons age 12+ | BJS NCVS 2024 |
| Persons who experienced rape/sexual assault at least once, 2024 | 389,370 (0.14% of population age 12+) | BJS NCVS 2024 |
Source: BJS Criminal Victimization, 2024 (NCJ 310547).
3. Reporting and Help-Seeking
The reporting gap is the single most important number to understand when reading any sexual assault statistic.
NCVS finds that only about 1 in 4 rape or sexual assault victimizations was reported to police in 2024 – and that share dropped sharply from 46.0% in 2023, a change BJS flags as influenced by the sample redesign.
Campus surveys produce even lower reporting rates: AAU found that the most common reason students gave for not reporting was that they did not believe the incident was “serious enough” to merit action. Reasons NCVS respondents historically cite include fear of reprisal, belief that police could not help, and viewing the incident as personal.
Non-partner sexual violence – which often occurs in dating, social, or workplace contexts – accounts for a substantial share of unreported cases, and the calculus survivors describe for whether to disclose is shaped by whether the person they would name is an acquaintance, a partner, or a stranger.
For people meeting potential partners online, vetted dating platforms with verified profiles and reporting tools are one of several harm-reduction layers researchers have begun to study alongside campus prevention programs and bystander training.
| Metric | Value | Source |
|---|---|---|
| Rape/sexual assault reported to police, 2024 (NCVS) | 23.6% | BJS NCVS 2024 |
| Rape/sexual assault rate not reported to police, 2024 | 1.4 per 1,000 persons age 12+ | BJS NCVS 2024 |
| Rape/sexual assault rate not reported to police, 2023 | 0.9 per 1,000 persons age 12+ | BJS NCVS 2024 |
| Violent victimizations where victim received service-provider assistance, 2024 | 8.3% | BJS NCVS 2024 |
| Intimate partner violence victimizations with service-provider assistance, 2024 | 22.1% | BJS NCVS 2024 |
| Confidence among students experiencing nonconsensual contact that school would take a report seriously | 45.0% | AAU Campus Climate Survey 2019 |
| Top reason students gave for not reporting | Did not believe incident was serious enough | AAU Campus Climate Survey 2019 |
Source: BJS Criminal Victimization, 2024
The Iceberg Ratio: Self-Reported Victimization vs. Reported Crime
Comparing self-reported past-12-month sexual violence (NISVS) against the share of NCVS victimizations that reached police produces a stark gap that neither survey publishes on its own.
NISVS 2023/2024 reports 7.0 million U.S. women and 2.6 million U.S. men – roughly 9.6 million people total – experienced contact sexual violence in the 12 months before the survey. NCVS 2024 reports 560,890 rape or sexual assault victimizations, of which 23.6% (about 132,400) were reported to police.
The implied ratio: for every sexual violence incident that reaches law enforcement in a given year, roughly 72 people report experiencing contact sexual violence to a health-survey interviewer.
The two surveys define violence somewhat differently and serve different purposes, so this is not a clean 1-to-1 comparison – but the order-of-magnitude gap holds across any reasonable methodological adjustment, and it is the single most useful number for understanding why crime-report-based statistics consistently undercount the population-level burden of sexual violence.
| Measure | Annual estimate | Source |
|---|---|---|
| Past-12-month contact sexual violence (women + men), NISVS | ~9.6 million | CDC NISVS 2023/2024 |
| Rape/sexual assault victimizations, NCVS 2024 | 560,890 | BJS NCVS 2024 |
| Of those, reported to police | ~132,400 (23.6%) | BJS NCVS 2024 |
| Self-reported NISVS victims per NCVS police-reported case | ~72 to 1 | Marriage Science analysis of CDC NISVS and BJS NCVS |
4. Perpetrator Demographics
USSC tracks people convicted in federal court, NISVS measures perpetration as reported by survivors in a general-population survey, and NCVS captures victims’ perceptions of offenders.
These are three different populations and cannot be combined into a single perpetrator profile – federal convictions, for instance, capture a thin slice of all sexual violence because most cases are prosecuted (or not prosecuted) at the state level.
Across all three, men account for the overwhelming majority of perpetrators. The Native American share of federal sexual-abuse convictions reflects the federal government’s jurisdiction over crimes committed by Native Americans in Indian Country under the Major Crimes Act (18 U.S.C. § 1153), and is a function of which cases land in federal court rather than a statement about general-population rates.
| Metric | Value | Source |
|---|---|---|
| Federal sexual abuse cases, FY24 | 1,430 (2.3% of all federal cases) | USSC FY24 Quick Facts on Sexual Abuse |
| Federal sexual abuse cases vs. FY20 | +62.5% | USSC FY24 Quick Facts on Sexual Abuse |
| Federally sentenced sexual abuse defendants who were men | 93.5% | USSC FY24 Quick Facts on Sexual Abuse |
| Average federal sexual abuse sentence | 221 months | USSC FY24 Quick Facts on Sexual Abuse |
| Federally sentenced sexual abuse defendants imprisoned | 99.2% | USSC FY24 Quick Facts on Sexual Abuse |
| Average sentence, production of child sexual abuse material | 273 months | USSC FY24 Quick Facts on Sexual Abuse |
| Perceived male offenders in NCVS violent incidents, 2024 | 75.6% | BJS NCVS 2024 |
| Male offenders against male victims, 2024 (NCVS) | 2,389,160 incidents | BJS NCVS 2024 |
Source: USSC FY24 Quick Facts on Sexual Abuse Offenses.
5. Child Sexual Abuse
CDC’s headline estimate – at least 1 in 4 girls and 1 in 20 boys in the U.S. experience child sexual abuse – replaced an older “1 in 13 boys” figure that still circulates in secondary sources; the methodology used to produce the newer estimate captured a broader range of unwanted contact experiences, and CDC notes the boy figure is widely considered an undercount.
NCANDS, which tracks cases reaching child protective services, captures only a fraction of total child sexual abuse – roughly 7% of substantiated maltreatment cases involve sexual abuse, and most child sexual abuse never reaches a CPS report.
The 91% known-perpetrator finding is the central fact policymakers point to when designing prevention curricula focused on grooming behaviors and trusted-adult disclosure pathways rather than “stranger danger.”
| Metric | Value | Source |
|---|---|---|
| U.S. girls who experience child sexual abuse | At least 1 in 4 (25%) | CDC Fast Facts: Preventing Child Sexual Abuse |
| U.S. boys who experience child sexual abuse | At least 1 in 20 (5%) | CDC Fast Facts: Preventing Child Sexual Abuse |
| Share of child sexual abuse perpetrated by someone known to the child | About 91% | CDC Fast Facts: Preventing Child Sexual Abuse |
| Total U.S. child maltreatment victims, FFY 2023 | 546,159 | HHS/ACF Child Maltreatment 2023 (NCANDS) |
| Estimated lifetime economic burden of child sexual abuse (2015 dollars) | $9.3 billion (likely an undercount) | CDC; Letourneau et al., 2018 |
| CPS referrals received, FFY 2023 | 4.399 million (covering 7.78 million children) | HHS/ACF Child Maltreatment 2023 |
Source: CDC About Child Sexual Abuse and Child Maltreatment 2023 (HHS/ACF).
6. Subgroup Disparities
NISVS oversampling and identity-disclosure design have a measurable effect on disparity estimates – surveys that don’t oversample American Indian and Alaska Native populations or that don’t ask about sexual orientation produce systematically lower disparity figures than those that do.
The National Institute of Justice’s analysis of the NISVS AIAN oversample found that more than four in five Native women had experienced violence in their lifetime and 56.1% had experienced sexual violence specifically.
Williams Institute work on LGBT victimization, drawing on NCVS and other sources, finds LGBT people experience violent victimization at roughly five times the rate of non-LGBT people. Bisexual women in particular show higher lifetime IPV and sexual violence rates than either lesbian or heterosexual women across multiple data sources.
| Metric | Value | Source |
|---|---|---|
| AIAN women, lifetime sexual violence | 56.1% | NIJ 2016 (NISVS 2010 AIAN oversample) |
| AIAN women, lifetime experience of any violence | 84.3% | NIJ 2016 (NISVS 2010 AIAN oversample) |
| AIAN women, share of perpetrators who were non-Native | 96% | NIJ 2016 (NISVS 2010 AIAN oversample) |
| LBQ women, physical or sexual assault since age 18 | 46% | Williams Institute, Health and Well-Being of LBQ Women |
| LGBT violent victimization rate (NCVS-based) | 106.4 per 1,000 vs. 21.1 per 1,000 non-LGBT | Williams Institute, Anti-LGBT Victimization in the United States |
| AIAN women, IPV lifetime prevalence (NISVS 2016/17) | 57.7% | CDC NISVS 2016/2017 (via Leemis 2022) |
| LBQQ girls reporting past-year sexual violence | About 25% (vs. ~15% for straight girls) | Williams Institute, LBQ Women in the US |
Source: Williams Institute publications on LGBT victimization and LBQ women.
7. Global Comparison
The WHO November 2025 release combines intimate-partner violence and non-partner sexual violence into a single global figure, which is the right way to capture lifetime exposure but not directly comparable to NISVS estimates that report sexual violence by itself.
Regional variation is substantial – Oceania (excluding Australia and New Zealand) reports a past-year IPV prevalence of 38%, more than three times the global average, with national lifetime estimates among ever-partnered women age 15–49 reaching as high as 61% in some Pacific countries.
The 0.2% annual decline since 2000 means that, at the current pace, the SDG 5.2 target to eliminate violence against women will not be met – a point WHO made explicit in its release.
| Metric | Value | Source |
|---|---|---|
| Women globally with lifetime partner or sexual violence | About 840 million (nearly 1 in 3) | WHO/UN, 19 November 2025 |
| Women globally with past-12-month physical or sexual IPV | 316 million (11% of those age 15+) | WHO/UN, 19 November 2025 |
| Women with lifetime non-partner sexual violence since age 15 | 263 million | WHO/UN, 19 November 2025 |
| Global lifetime prevalence of non-partner sexual violence | 8.2% of women age 15+ | WHO/UN, 19 November 2025 |
| Past-12-month IPV among adolescent girls age 15–19 | 12.5 million (16% of partnered girls) | WHO/UN, 19 November 2025 |
| Oceania (excl. AU/NZ) past-year IPV prevalence | 38% | WHO/UN, 19 November 2025 |
| Annual decline in IPV since 2000 | 0.2% per year | WHO/UN, 19 November 2025 |
| Share of global development aid going to violence-prevention programming (2022) | 0.2% | WHO/UN, 19 November 2025 |
Sexual Assault by the Numbers
| Metric | Value | Source |
|---|---|---|
| U.S. women, lifetime contact sexual violence | 45.1% (57.7 million) | CDC NISVS 2023/2024 |
| U.S. men, lifetime contact sexual violence | 16.9% (20.6 million) | CDC NISVS 2023/2024 |
| U.S. women, lifetime rape (completed or attempted) | 21.0% | CDC NISVS 2023/2024 |
| U.S. women, lifetime unwanted sexual contact | 39.0% | CDC NISVS 2023/2024 |
| U.S. women, lifetime technology-facilitated sexual violence | 28.2% | CDC NISVS 2023/2024 |
| U.S. women, past-12-month contact sexual violence | 5.5% (7.0 million) | CDC NISVS 2023/2024 |
| U.S. rape or sexual assault victimizations, 2024 | 560,890 | BJS NCVS 2024 |
| Rape/sexual assault reported to police, 2024 | 23.6% | BJS NCVS 2024 |
| Total U.S. violent victimization rate, 2024 | 23.3 per 1,000 | BJS NCVS 2024 |
| U.S. girls who experience child sexual abuse | At least 1 in 4 | CDC Fast Facts |
| U.S. boys who experience child sexual abuse | At least 1 in 20 | CDC Fast Facts |
| Child sexual abuse with a known perpetrator | About 91% | CDC Fast Facts |
| Total U.S. child maltreatment victims, FFY 2023 | 546,159 | HHS/ACF Child Maltreatment 2023 |
| Federally sentenced sexual abuse defendants (FY24) | 1,430 | USSC FY24 Quick Facts |
| Federal sexual abuse defendants who were men (FY24) | 93.5% | USSC FY24 Quick Facts |
| Average federal sexual abuse sentence (FY24) | 221 months | USSC FY24 Quick Facts |
| AIAN women, lifetime sexual violence | 56.1% | NIJ 2016 (NISVS AIAN oversample) |
| LBQ women, physical or sexual assault since age 18 | 46% | Williams Institute |
| Women globally with lifetime partner or sexual violence | About 840 million | WHO/UN November 2025 |
| Past-12-month IPV among women globally | 11% (316 million) | WHO/UN November 2025 |
| Undergraduate women reporting nonconsensual sexual contact since enrolling | 26.4% | AAU 2019 Campus Climate Survey |
Methodology and Sources
The figures above are drawn from primary U.S. and international data sources. Each measures something different, and we have labeled every stat with the instrument and reporting year so readers can interpret responsibly.
- CDC National Intimate Partner and Sexual Violence Survey (NISVS) 2023/2024 Sexual Violence Data Brief – self-reported lifetime and 12-month prevalence among 15,609 adults, December 2025 release. The CDC cautions against comparing 2023/2024 figures to earlier waves due to instrument and methodology changes.
- Bureau of Justice Statistics, Criminal Victimization, 2024 (NCJ 310547) – NCVS legacy-instrument estimates of past-year victimization and reporting, released September 2025. The 2024 split-sample design widened confidence intervals.
- U.S. Sentencing Commission, FY24 Quick Facts on Sexual Abuse Offenses – federal sentencing outcomes for 1,430 sexual abuse cases under USSC §§2A3.1–§2G2.6.
- HHS Administration for Children and Families, Child Maltreatment 2023 (NCANDS) – administrative data on cases reaching child protective services in FFY 2023.
- CDC, About Child Sexual Abuse / Fast Facts: Preventing Child Sexual Abuse – CDC’s standing estimates of child sexual abuse prevalence and known-perpetrator share, drawing on Finkelhor et al. and related peer-reviewed work.
- World Health Organization & UN partners, Lifetime toll: 840 million women faced partner or sexual violence – released 19 November 2025, combining intimate-partner and non-partner sexual violence data with the first published regional estimates of non-partner sexual violence.
- National Institute of Justice, Violence Against American Indian and Alaska Native Women and Men (NCJ 249736) – analysis of the NISVS AIAN oversample.
- Williams Institute at UCLA School of Law – multiple reports on LGBT victimization rates and LBQ women’s experiences of sexual and physical violence.
- Association of American Universities, 2019 Campus Climate Survey on Sexual Assault and Misconduct – 181,752 students across 33 institutions, the most recent AAU climate survey.
Last updated: May 2026. We update this page annually as new CDC NISVS briefs, BJS NCVS reports, FBI NIBRS releases, USSC Quick Facts, NCANDS reports, and WHO global updates are published. Limitations to note: NISVS 2023/2024 had a 16.5% response rate (with a 72.1% cooperation rate among those reached), the NCVS 2024 sample was halved during instrument redesign, FBI reported-crime counts capture only crimes that came to police attention, and global figures rely on modeled estimates with sparse data for older adult women and several regions.