

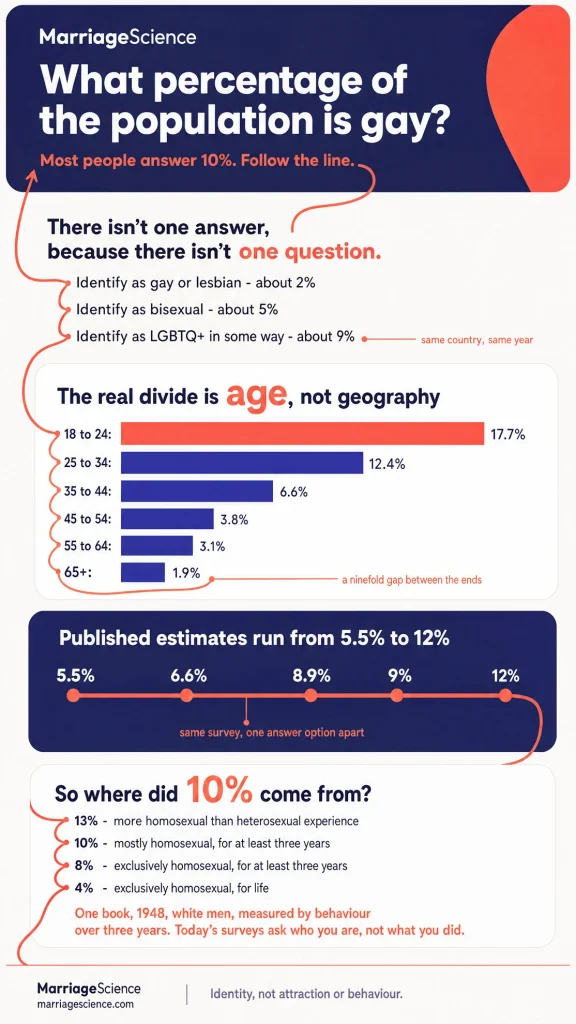
About 2% of U.S. adults identify as gay or lesbian, about 5% identify as bisexual, and about 9% identify as LGBTQ+ in some way. That broad LGBTQ+ figure comes from Gallup 2025, 9%, and includes people whose identity falls outside lesbian, gay or bisexual as well.
The number most people remember is 10%. That figure traces to Alfred Kinsey’s 1948 book, but it measured something different, behavior over at least three years among white men.
This page adds state level detail from current survey data. We report lesbian, gay and bisexual shares for the 32 states that asked in 2024, from our analysis of 246,949 CDC survey answers.
We also explain why published estimates range from 5.5% to 12%, and show how identity splits by age and sex. The share has risen mainly because younger adults identify as LGBTQ+ far more often.
Key Statistics on the LGBTQ Population
These figures come from Gallup’s national polls, the Williams Institute, the Human Rights Campaign Foundation, and our analysis of the CDC’s 2024 BRFSS. The estimates do not all count the same groups, so each item keeps the source’s label, including LGBTQ+, LGBT, lesbian, gay or bisexual, and “something else” where used.
- Gallup: 9% of U.S. adults identified as LGBTQ+ in 2025, up from 3.5% in 2012.
- Gallup 2025: bisexual people are more than half of LGBTQ+ adults, about 5.3% of all adults, compared with 3.1% in 2020.
- Gallup 2024: 2.0% of adults identify as gay and 1.4% identify as lesbian, using Gallup’s national identity categories.
- Gallup 2025: 23% of adults under 30 identify as LGBTQ+, against 3% or less at 50 and older.
- Gallup 2024: 31% of Gen Z women and 12% of Gen Z men identify as LGBTQ+, a gender gap within the same generation.
- Kinsey 1948: the famous 10% meant men who were mostly homosexual for at least three years between 16 and 55, not a lifetime identity.
- Kinsey 1948, same page: 4% of white men were exclusively homosexual throughout their lives, a narrower measure than the famous figure.
- Williams Institute, BRFSS 2020 to 2021: 5.5% of adults, about 13.9 million people, identify as LGBT.
- Human Rights Campaign Foundation, Household Pulse Survey 2021 to 2024: 12%, counting transgender and gender diverse people.
- Gallup: 0.7% of U.S. adults are in a same-sex marriage, about 930,000 marriages.
- Across the 32 states that asked in 2024, 6.6% of adults identify as lesbian, gay or bisexual, and 8.9% including “something else”.
- Bisexual adults are 4.4% of adults in those states, twice the 2.2% who identify as gay or lesbian.
- Massachusetts has the highest lesbian, gay and bisexual share at 8.7%, while Idaho has the lowest at 4.2%.
- Among adults aged 18 to 24, 17.7% identify as lesbian, gay or bisexual, against 1.9% at 65 and older.
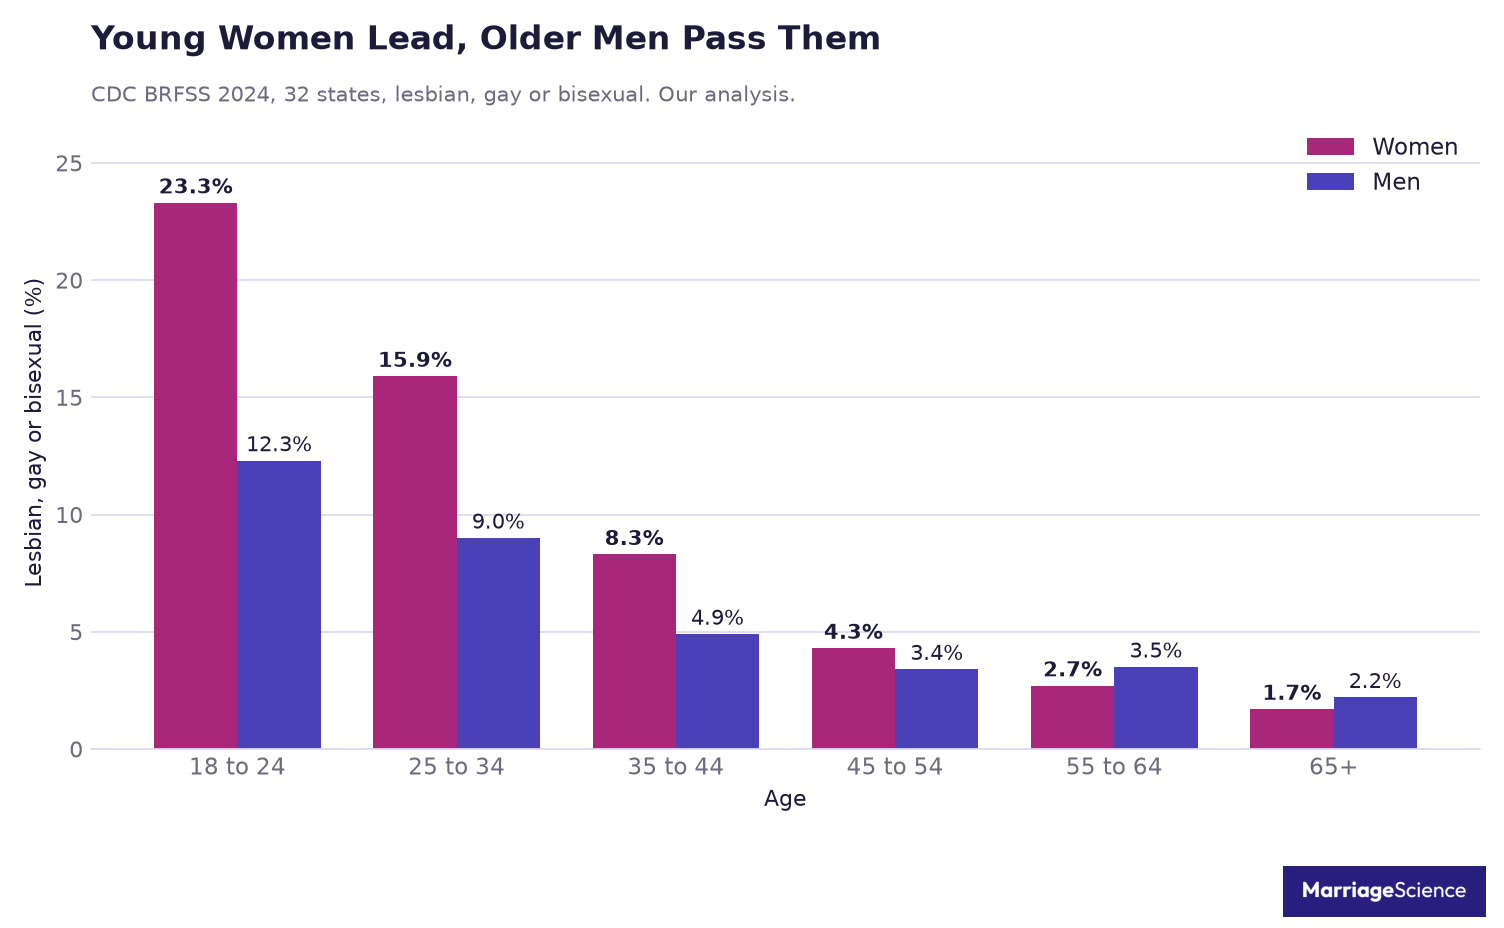
- Women aged 18 to 24: 23.3% identify as lesbian, gay or bisexual, compared with 12.3% of men the same age.
- After 55 the gap reverses: 3.5% of men aged 55 to 64 identify as lesbian, gay or bisexual, against 2.7% of women.
What Percentage of the Population Is Gay?
There is no single clean percentage for this question, because surveys count different identities in different ways. The most direct answer is to separate gay, lesbian, bisexual, transgender, and other LGBTQ+ identities instead of treating them as one number.
In the 2024 national Gallup poll of 14,162 adults, released in 2025, 2.0% of adults identified as gay and 1.4% identified as lesbian. The same poll found 5.2% bisexual, 1.3% transgender, just under 1% another LGBTQ+ identity, 85.7% straight, and 5% declined to answer.
A later 2025 national survey of 13,454 adults put LGBTQ+ identification at 9%. In that survey, 86% identified as heterosexual and 5% gave no response.
Our analysis of CDC data gives a state survey comparison. In the 32 states that asked the sexual orientation question in 2024, 2.2% identified as gay or lesbian, 4.4% identified as bisexual, and 2.3% chose something else.
The CDC source is the Behavioral Risk Factor Surveillance System, or BRFSS, a state health survey. In 2024 it had 457,670 respondents, and 32 states asked the optional sexual orientation module.
That module asks, “Which of the following best represents how you think of yourself?”
Men choose from gay, straight, bisexual or something else, and women from lesbian or gay, straight, bisexual or something else. In the 32 states we analyzed, 3.3% of people asked said they did not know or refused.
| Identity | Gallup, 2024 national | CDC BRFSS 2024, 32 states (our analysis) |
|---|---|---|
| Gay or lesbian | 3.4% (2.0% gay, 1.4% lesbian) | 2.2% |
| Bisexual | 5.2% | 4.4% |
| Something else / other LGBTQ+ | just under 1% | 2.3% |
| Transgender | 1.3% | not in our data |
The Gallup phone poll and the CDC state health survey use different methods, yet they land close on the main identity groups. Read together, they point to a small gay and lesbian share, a larger bisexual share, and a larger LGBTQ+ population when transgender and other identities are included.
What each label means, and how orientation differs from identity, is explained in our guide to sexual orientation.
Where the 10% Figure Came From
The familiar 10% figure traces back to Sexual Behavior in the Human Male, published in 1948 by Alfred Kinsey, Wardell Pomeroy and Clyde Martin. The line appears on page 651, in a discussion of male sexual behavior.
On page 651, the authors wrote, “10 per cent of the males are more or less exclusively homosexual (i.e., rate 5 or 6) for at least three years between the ages of 16 and 55. This is one male in ten in the white male population.”
That sentence has often been shortened into the 10% figure. In the book, it was a measure of behavior on Kinsey’s 0 to 6 scale, with the quoted group rated 5 or 6.
It was not a survey of how people identify. Kinsey’s scale sorted reported experience and response, so the wording does not match identity questions used in current surveys.
The time period matters too.
The quote counts men who met that definition for at least three years between the ages of 16 and 55. It says nothing about a whole life.
The scope was also narrow.
The figure covered “the white male population” in the quote, meaning white men only, in the 1940s. Women were not in this book.
The lines around the quote show that Kinsey was giving related measures, each with a different threshold. On the same page, 13 per cent had more homosexual than heterosexual experience for at least three years, 8 per cent were exclusively homosexual for at least three years, and “4 per cent of the white males are exclusively homosexual throughout their lives, after the onset of adolescence.”
The wording sits inside a set of thresholds. Moving from rates 4 to 6, to rates 5 or 6, to rate 6 changes what is being counted, even before the life course measure is considered.
This distinction is why the same sentence cannot be carried into a state table as a current population estimate. A behavior category from one book and an identity category from a survey are different measures.
| Kinsey 1948 measure (white men) | Share |
|---|---|
| More homosexual than heterosexual for at least 3 years (rates 4 to 6) | 13% |
| Mostly homosexual for at least 3 years (rates 5 or 6) | 10% |
| Exclusively homosexual for at least 3 years (rate 6) | 8% |
| Exclusively homosexual for life after adolescence | 4% |
Read this way, the famous figure is narrower than it usually sounds. It describes mostly homosexual behavior for at least three years among white men, as Kinsey classified it, not the share of the whole population that would identify as LGBTQ+ today.
The 10% figure survived because it is a round, memorable number. Today’s identity surveys measure something else, so they cannot confirm or refute it.
Why Estimates Range From 5.5% to 12%
Published estimates range from 5.5% to 12% because the sources do not count the same population in the same way. The difference is mostly about survey design, timing, definitions, and how less common answer choices are treated.
The Williams Institute put the adult LGBT share at 5.5%, about 13.9 million, using BRFSS 2020 to 2021. Its report says Washington, D.C. has the highest share, 14.3%.
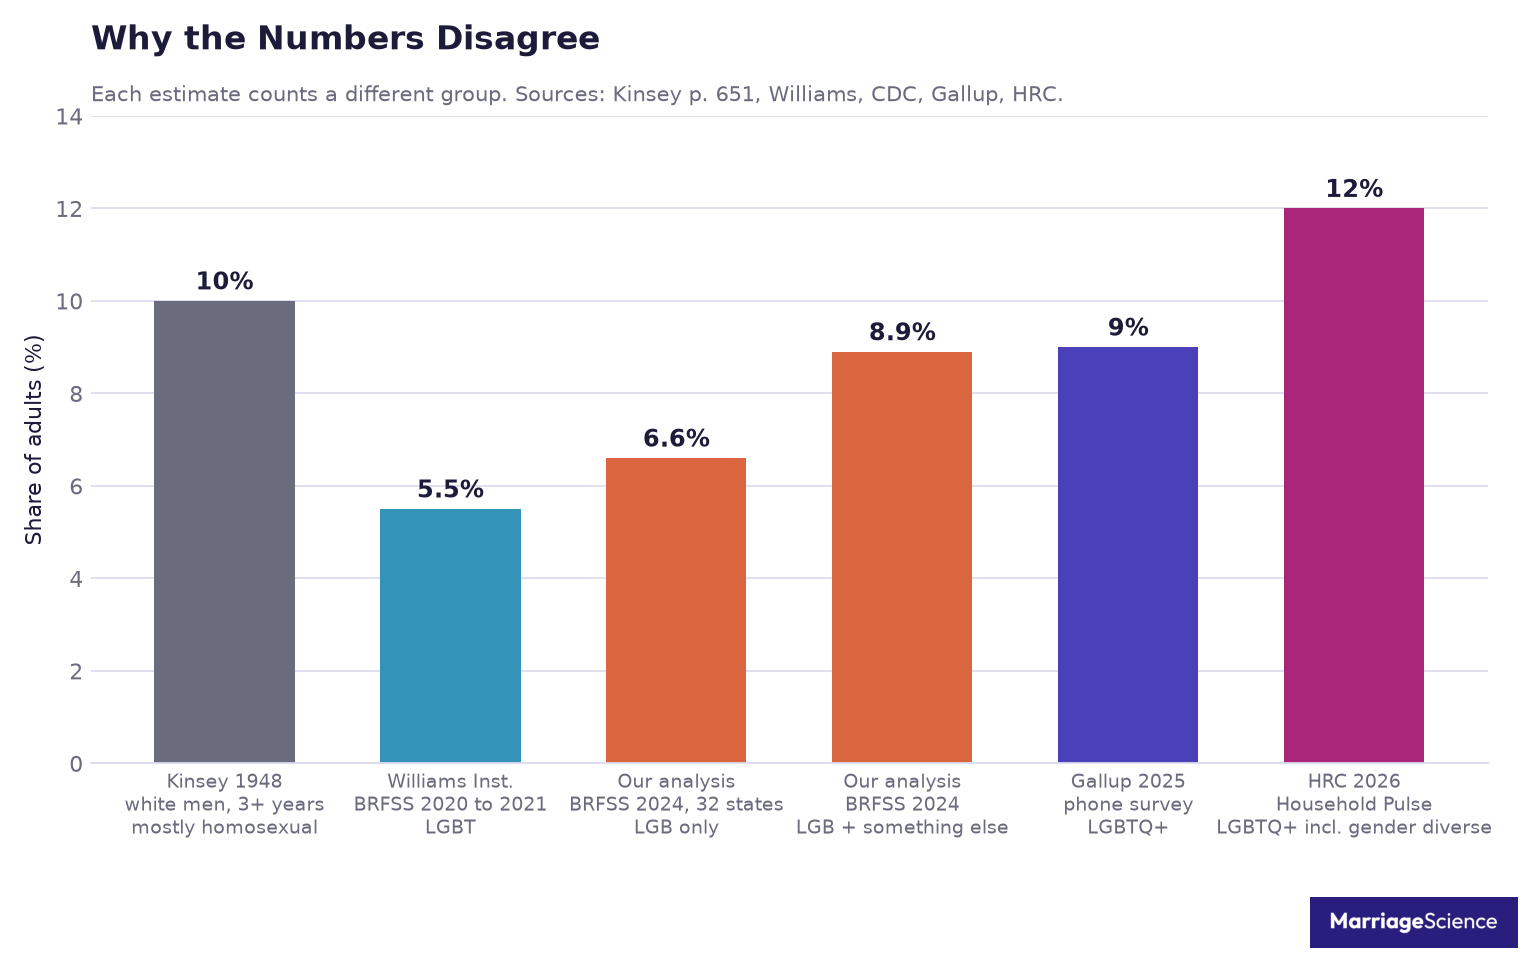
Gallup reported 9% LGBTQ+ in 2025 from national phone interviews, with respondents allowed to identify with any LGBTQ+ identity. The Human Rights Campaign Foundation reported 12%, about 25.6 million people, from more than 2.4 million responses to the Census Bureau’s Household Pulse Survey from 2021 to 2024, including transgender and gender diverse people.
The first source of variation is the survey itself. A national phone poll, a state health survey, and an online Census survey reach people in different settings, ask questions in different ways, and may produce different comfort levels when respondents answer identity questions.
The second source of variation is timing. Identification is rising fast, so a figure based on BRFSS 2020 to 2021 and a figure based on 2025 interviews are separated by more than a change in sample source.
The third source of variation is definition. LGB only, LGBT, and LGBTQ+ with gender identity are different categories, and the broader category will usually count more people when it includes transgender and gender diverse respondents as well as sexual orientation.
The fourth source of variation is how answers outside the main categories are handled. Some surveys let respondents choose something else, some combine that response with LGB or LGBTQ+ groups, and some leave blank answers or refusals outside the counted group.
Our analysis shows the definition effect in the same 2024 data. The share is 6.6% for lesbian, gay or bisexual, then 8.9% when something else is added.
The Human Rights Campaign Foundation says the share is above 10% in 40 of 50 states. We treat that as its estimate, because it uses its own data source and definition.
The table shows what each number counts. It does not rank them.
| Estimate | Share | Data | Counts |
|---|---|---|---|
| Kinsey (1948) | 10% | Interviews, white men | Homosexual behavior for 3+ years |
| Williams Institute (2023 report) | 5.5% | BRFSS 2020 to 2021 | LGBT |
| Our analysis | 6.6% | BRFSS 2024, 32 states | Lesbian, gay, bisexual |
| Our analysis | 8.9% | BRFSS 2024, 32 states | LGB + something else |
| Gallup (2025) | 9% | Phone survey | LGBTQ+ |
| HRC Foundation (2026) | 12% | Household Pulse 2021 to 2024 | LGBTQ+ incl. gender diverse |
LGBTQ Population by State
The Behavioral Risk Factor Surveillance System (BRFSS) is the CDC’s state-run health survey, and in 2024 it had 457,670 respondents.
Our analysis of CDC data covers the states that asked that question in 2024. 32 states asked it, while 17 states, Washington, D.C. and Puerto Rico did not, including California, New York, Florida, Colorado and Ohio. Tennessee is not in the 2024 public file at all, so 18 states have no 2024 BRFSS figure.
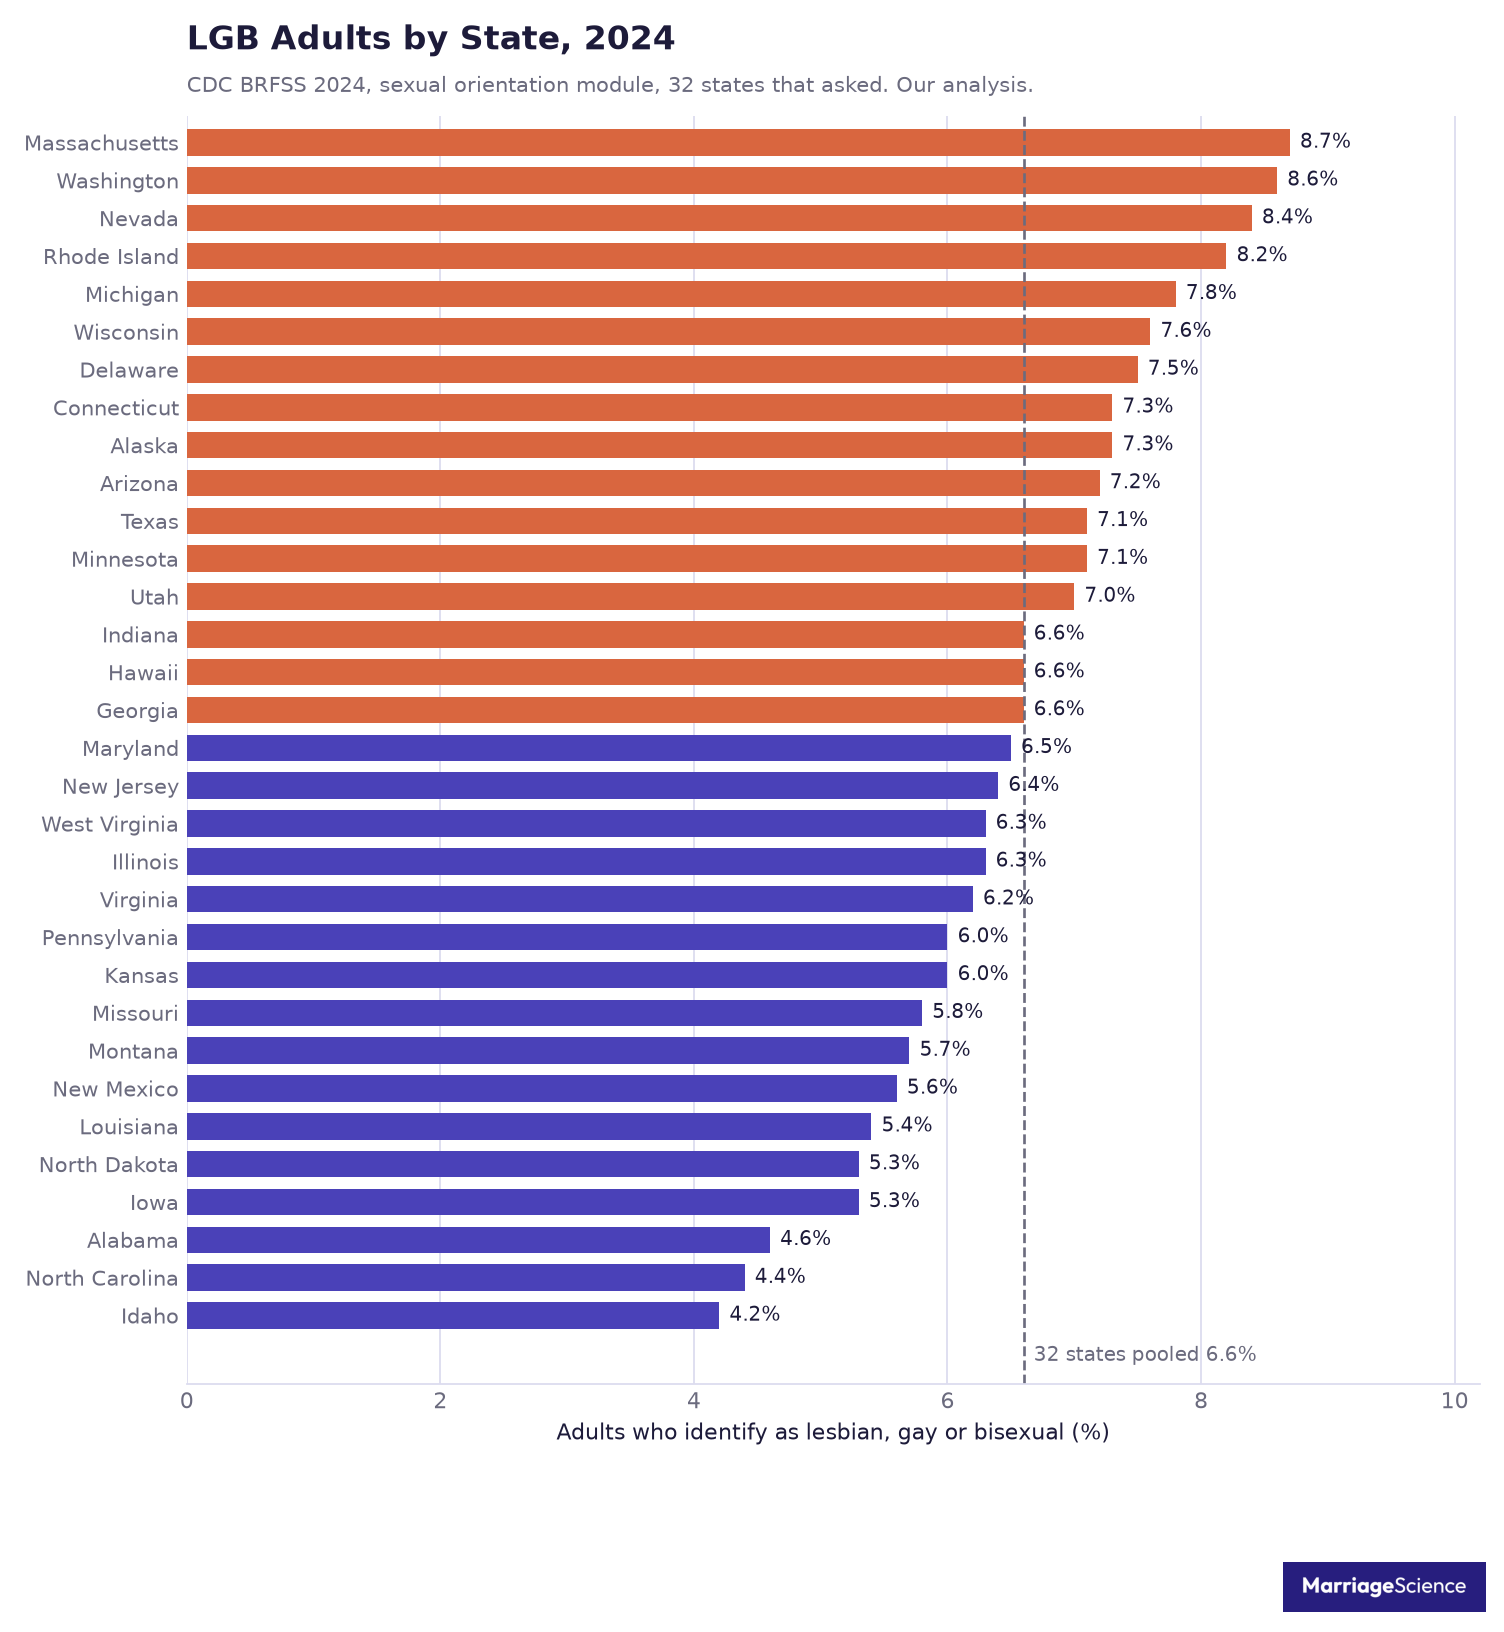
Among the states with data, the highest lesbian, gay or bisexual shares were in Massachusetts at 8.7%, Washington at 8.6%, Nevada at 8.4%, Rhode Island at 8.2% and Michigan at 7.8%. The lowest were Idaho at 4.2%, North Carolina at 4.4%, Alabama at 4.6%, and Iowa and North Dakota at 5.3% each.
Bisexual is the largest group in every one of the 32 states that asked the sexual orientation question. Utah is 7.0%, above the 32-state figure of 6.6%, and Texas is 7.1%.
State rankings should be read with the survey margins in mind. Most state figures are within about 1 point, while Nevada is has the widest margin, plus or minus 1.9 points, because fewer people answered there.
| Rank | State | Lesbian, gay or bisexual | Gay or lesbian | Bisexual | Incl. something else |
|---|---|---|---|---|---|
| 1 | Massachusetts | 8.7% (±0.8) | 3.3% | 5.4% | 11.2% |
| 2 | Washington | 8.6% (±0.5) | 2.8% | 5.9% | 11.6% |
| 3 | Nevada | 8.4% (±1.9) | 3.4% | 5.0% | 10.6% |
| 4 | Rhode Island | 8.2% (±1.0) | 2.5% | 5.7% | 11.2% |
| 5 | Michigan | 7.8% (±0.7) | 2.2% | 5.5% | 10.1% |
| 6 | Wisconsin | 7.6% (±0.8) | 2.4% | 5.2% | 10.6% |
| 7 | Delaware | 7.5% (±1.2) | 3.3% | 4.2% | 9.8% |
| 8 | Alaska | 7.3% (±1.1) | 2.1% | 5.2% | 9.7% |
| 9 | Connecticut | 7.3% (±0.9) | 2.3% | 5.1% | 10.3% |
| 10 | Arizona | 7.2% (±1.1) | 2.6% | 4.6% | 9.7% |
| 11 | Minnesota | 7.1% (±0.5) | 2.4% | 4.7% | 9.7% |
| 12 | Texas | 7.1% (±0.9) | 2.6% | 4.5% | 9.8% |
| 13 | Utah | 7.0% (±0.6) | 2.0% | 4.9% | 9.4% |
| 14 | Georgia | 6.6% (±0.9) | 2.0% | 4.6% | 8.9% |
| 15 | Hawaii | 6.6% (±0.9) | 3.0% | 3.5% | 8.9% |
| 16 | Indiana | 6.6% (±0.6) | 2.0% | 4.5% | 9.0% |
| 17 | Maryland | 6.5% (±0.6) | 2.6% | 3.9% | 9.4% |
| 18 | New Jersey | 6.4% (±0.8) | 2.1% | 4.3% | 8.8% |
| 19 | Illinois | 6.3% (±0.6) | 2.1% | 4.2% | 8.0% |
| 20 | West Virginia | 6.3% (±0.8) | 2.1% | 4.1% | 7.8% |
| 21 | Virginia | 6.2% (±1.0) | 1.9% | 4.3% | 8.4% |
| 22 | Kansas | 6.0% (±0.6) | 1.8% | 4.2% | 7.9% |
| 23 | Pennsylvania | 6.0% (±1.3) | 1.9% | 4.1% | 8.5% |
| 24 | Missouri | 5.8% (±0.8) | 1.7% | 4.1% | 8.2% |
| 25 | Montana | 5.7% (±0.8) | 1.4% | 4.4% | 7.6% |
| 26 | New Mexico | 5.6% (±1.2) | 1.9% | 3.7% | 7.6% |
| 27 | Louisiana | 5.4% (±0.8) | 2.0% | 3.5% | 6.9% |
| 28 | Iowa | 5.3% (±0.6) | 1.3% | 4.0% | 7.1% |
| 29 | North Dakota | 5.3% (±0.8) | 1.6% | 3.6% | 7.5% |
| 30 | Alabama | 4.6% (±0.8) | 1.3% | 3.3% | 5.8% |
| 31 | North Carolina | 4.4% (±0.8) | 1.9% | 2.5% | 5.1% |
| 32 | Idaho | 4.2% (±0.9) | 0.9% | 3.3% | 6.4% |
Share of adults who gave a sexual orientation in the CDC BRFSS 2024, our analysis. The figure in brackets is an approximate 95% margin of error in percentage points.
Bisexual People Are the Largest Group
Gallup 2024 places bisexual adults at the center of LGBTQ+ identification in the United States. In that survey, 56% of LGBTQ+ adults said they were bisexual, compared with 21% gay, 15% lesbian, 14% transgender and 6% something else.
Those shares add to more than 100% because respondents could give more than one identity. That detail matters when reading the categories, since a person who identifies as bisexual may also identify as transgender or use another label.
The generational pattern is clear in Gallup’s data. More than half of Gen Z and millennial LGBTQ+ adults are bisexual, with 59% among Gen Z and 52% among millennials.
| Generation | Share of LGBTQ+ adults who are bisexual (Gallup 2024) |
|---|---|
| Gen Z | 59% |
| Millennials | 52% |
| Generation X | 44% |
| Baby boomers | 19% |
| Silent Generation | 11% |
The share is lower in older generations, at 44% in Generation X, 19% among baby boomers and 11% in the Silent Generation. Gallup also reports that older LGBTQ+ people are most likely to be gay or lesbian.
Our analysis of CDC data shows a similar pattern across the state-level adult data available for this article. Across the 32 states, 4.4% of adults identify as bisexual, while 2.2% identify as gay or lesbian.
Age makes the bisexual share especially visible in the CDC data. Among adults 18 to 24, 13.5% identify as bisexual across those states.
An LGBTQ+ total can hide the fact that bisexual people make up the largest group within LGBTQ+ adults, while gay and lesbian adults are counted separately in many surveys.
How bisexual and pansexual differ, and why some people use both words, is covered in pansexual vs bisexual.
Age: The Biggest Divide
Age is the clearest split in our analysis of CDC data. Across 32 states in 2024, younger adults were much more likely than older adults to identify as lesbian, gay or bisexual, and the gap was visible at every step down the age scale.
Among people 18 to 24, 17.7% identified as lesbian, gay or bisexual.
The share was 12.4% for people 25 to 34, then 6.6% for people 35 to 44. By 65 and older, the figure was 1.9%.
| Age | Lesbian, gay or bisexual | Including something else |
|---|---|---|
| 18 to 24 | 17.7% | 22.8% |
| 25 to 34 | 12.4% | 15.8% |
| 35 to 44 | 6.6% | 9.1% |
| 45 to 54 | 3.8% | 5.1% |
| 55 to 64 | 3.1% | 4.2% |
| 65 and older | 1.9% | 3.4% |
The broader CDC measure, which includes people who selected “something else,” shows the same age pattern. It places the 18 to 24 group at 22.8%, compared with 15.8% for 25 to 34 and 9.1% for 35 to 44.
Older age groups were lower on both measures.
The lesbian, gay or bisexual share was 3.8% for people 45 to 54, 3.1% for people 55 to 64, and 1.9% for people 65 and older. Including “something else,” those figures were 5.1%, 4.2%, and 3.4%.
Gallup shows a similar age divide using its LGBTQ+ measure.
Gen Z adults averaged 22.7% LGBTQ+ over 2023 and 2024, up from 18.8% in 2020 to 2022. At the other end of the age scale, the Silent Generation is 1.8%.
Gallup says the rise comes mainly from more young adults, especially young women, identifying as bisexual. That is Gallup’s explanation for the recent increase in its LGBTQ+ estimate, and it matches the basic shape of the CDC results, where the youngest adult group has the highest share.
The two sources use different wording and count different identity groups, so their figures should be read in their own terms. Taken together, age moves the share far more than geography does: from 1.9% to 17.7% across age groups, against 4.2% to 8.7% across states.
How the youngest adults date, meet and define relationships is in our Gen Z dating statistics.
Women Identify as LGB More Often, Until Midlife
In our analysis of CDC data across the 32 states, 7.8% of women and 5.4% of men identify as lesbian, gay or bisexual. That pattern is strongest in the younger adult age groups included in the data.
Among adults 18 to 24, women are at 23.3% and men are at 12.3%. For adults 25 to 34, women are at 15.9% and men are at 9.0%.
The later age groups move in the other direction, with men higher than women at 55 to 64 and at 65 and older. At 55 to 64, men are at 3.5% and women are at 2.7%, while at 65 and older, men are at 2.2% and women are at 1.7%.
The data show a reversal in the older age groups. The data do not say why.
Gallup 2024 reports 10% of women and 6% of men identify as LGBTQ+. Gallup says the difference is mostly because women are more likely to be bisexual.
Gallup’s Gen Z women figure is 31%, compared with 12% for Gen Z men. That is a separate LGBTQ+ measure, so it should be read alongside the CDC LGB figures with care.
These are different measures, because LGB counts lesbian, gay or bisexual identity, while LGBTQ+ includes transgender and other identities. The CDC figures in this section come from state data, while the Gallup figures come from Gallup’s national reporting.
Relationships and Same-Sex Marriage
Gallup‘s combined 2021 to 2024 data put relationship status into clear categories for LGBTQ+ adults. The figures count marriage and cohabiting partnerships separately, and they also separate same-sex and opposite-sex relationships.
Among LGBTQ+ adults, 8.0% are in a same-sex marriage and 6.4% live with a same-sex partner. A larger share are in opposite-sex relationships, with 11.3% married to an opposite-sex spouse and 11.5% living with an opposite-sex partner, driven by bisexual adults.
| Relationship status of LGBTQ+ adults | Share |
|---|---|
| Same-sex marriage | 8.0% |
| Same-sex partner | 6.4% |
| Opposite-sex marriage | 11.3% |
| Opposite-sex partner | 11.5% |
| Single or never married | 51.1% |
The bisexual figures explain much of the opposite-sex marriage total. Gallup reports that 16% of bisexual adults are married to an opposite-sex spouse, compared with 2% who are married to a same-sex spouse.
Gay or lesbian adults have a different marriage profile in the same data. Among gay or lesbian adults, 19% are married to a same-sex spouse.
Being single is the most common status. Gallup finds that 51.1% of LGBTQ+ adults are single or never married, against 23.7% of all U.S. adults.
Same-sex marriage is a small but measurable share of adult relationships across the country. Gallup reports that 0.7% of all U.S. adults are in a same-sex marriage, an estimated 930,000 marriages, up from 368,000 before the 2015 Obergefell decision.
These figures also show why a single marriage statistic cannot describe LGBTQ+ relationships. The same population includes same-sex spouses, opposite-sex spouses, cohabiting partners, and adults who are single or never married.
How long same-sex marriages last, and how often they end, is in our analysis of the lesbian divorce rate.
Meeting Same-Sex Partners Online
Dating sites are one route to a same-sex partner. Some people prefer a site built only for men seeking men and women seeking women, where nobody has to explain themselves.
GayBloom: Best for Same-Gender Dating
GayBloom is an adults-only dating site for men seeking men and women seeking women. It runs in a mobile browser, with free sign-up and paid Full Member access.
Moderators review every photo before it goes live. Filters screen messages for outside links, payment requests and abusive language.
- Who It Matches
- Men with men, women with women
- How It Bills
- Subscription with trials
- To Start
- Free sign-up
- App
- Mobile browser only
Its sign-up only offers a man seeking a man or a woman seeking a woman, so bisexual and nonbinary users may want a general app beside it. A trial changes to a full monthly plan unless you cancel before it ends.
Prices, renewal rules and safety steps are in our full GayBloom review.
Coming Out: When and How Many
A Gallup Panel survey of 46,933 adults, May 2024, separates two parts of the coming out timeline. One is when LGBTQ+ adults first recognized their identity, and the other is when they told someone else.
The median age LGBTQ+ adults recognized their identity was 14. Gallup found that 48% knew by 14 and 72% by 18, so private recognition often came before adulthood in this survey.
Telling others often happened later. In the same survey, 57% came out to others by 22, while 18% have never come out to anyone.
The age of coming out also differs by age group. Adults 18 to 29 came out at a median age of 17, while adults 65 and older came out at a median age of 26.
Those figures describe when people shared their identity. Recognition came earlier.
Coming out also varies by identity group. Gallup reported that 23% of bisexual adults are not out to anyone, against 5% of gay or lesbian adults.
That gap matters for reading LGBTQ+ statistics because survey answers depend on disclosure. A person can recognize an identity privately, share it with selected people, share it widely, or keep it private in all settings.
People who are not out may also not tell a survey, so every estimate here may be closer to a floor than to a ceiling.
What the Data Cannot Tell You
No current national count exists in the federal data used here. The 2024 BRFSS data used for state comparisons are incomplete because 18 states and Washington, D.C. have no 2024 BRFSS figure, including the three largest states.
That gap has two sources in the file we analyzed. 17 states and D.C. did not ask the sexual orientation item, and Tennessee is not in the public file.
BRFSS also has a measurement limit inside the states that did ask. It asks no follow-up to “something else,” so the 2.3% who gave that answer can include pansexual, queer and asexual people, and it can also include people who misread the question.
For that reason, our rankings use lesbian, gay and bisexual only. That keeps the ranking category tied to identities the survey separates clearly, while leaving the “something else” responses outside the ranked LGB measure.
Another limit is missing answers. In the BRFSS file, 3.3% of people asked said they did not know or refused, so the reported shares come from people who answered the identity question.
These are identity measures. They do not measure attraction or behavior, which Kinsey counted, so they should be read as identity estimates instead of a count of attraction or behavior.
Our state figures use the survey’s final weight and an approximate margin of error. That means the percentages are estimates from a sample, and close state rankings should be read with care.
For the words behind the acronym, see our LGBTQ glossary page.
Methodology and Sources
Our analysis uses the CDC BRFSS 2024 public file, with 457,670 respondents and the sexual orientation module. The module records SOMALE for men and SOFEMALE for women, and we weighted results with the final weight _LLCPWT.
Our shares are calculated among people who gave an orientation. “Don’t know” and “refused” answers are excluded from the denominator and reported separately, so readers can see how much item nonresponse sits outside the main percentage.
For the state ranking, we used the 32 states that asked the sexual orientation module. There were 246,949 answers in those states, including 18,074 answers coded lesbian, gay, bisexual or something else.
Guam and the U.S. Virgin Islands also asked the questions. We excluded them from the ranking because the article compares states.
We checked the calculations against the CDC codebook. Our weighted percentages reproduce the CDC codebook exactly, for example 2.53% of men gay and 5.75% of women bisexual across all respondents asked.
Margins of error use an effective sample size from the weights and ignore stratification, so they are approximate. They should be read as a guide to sampling noise in the published tables, while the ranking itself still comes from the weighted BRFSS responses.
We kept the source language matched to the measure.
When a source measured LGB adults, we used LGB. When a source measured LGBTQ+ adults, including transgender and other identities, we used LGBTQ+.
Other sources used in the article are Gallup news releases on 2024 and 2025 data, same-sex marriage and coming out, the Williams Institute’s 2023 report, the Human Rights Campaign Foundation’s 2026 release, and page 651 of Sexual Behavior in the Human Male (1948), read in full text.



