


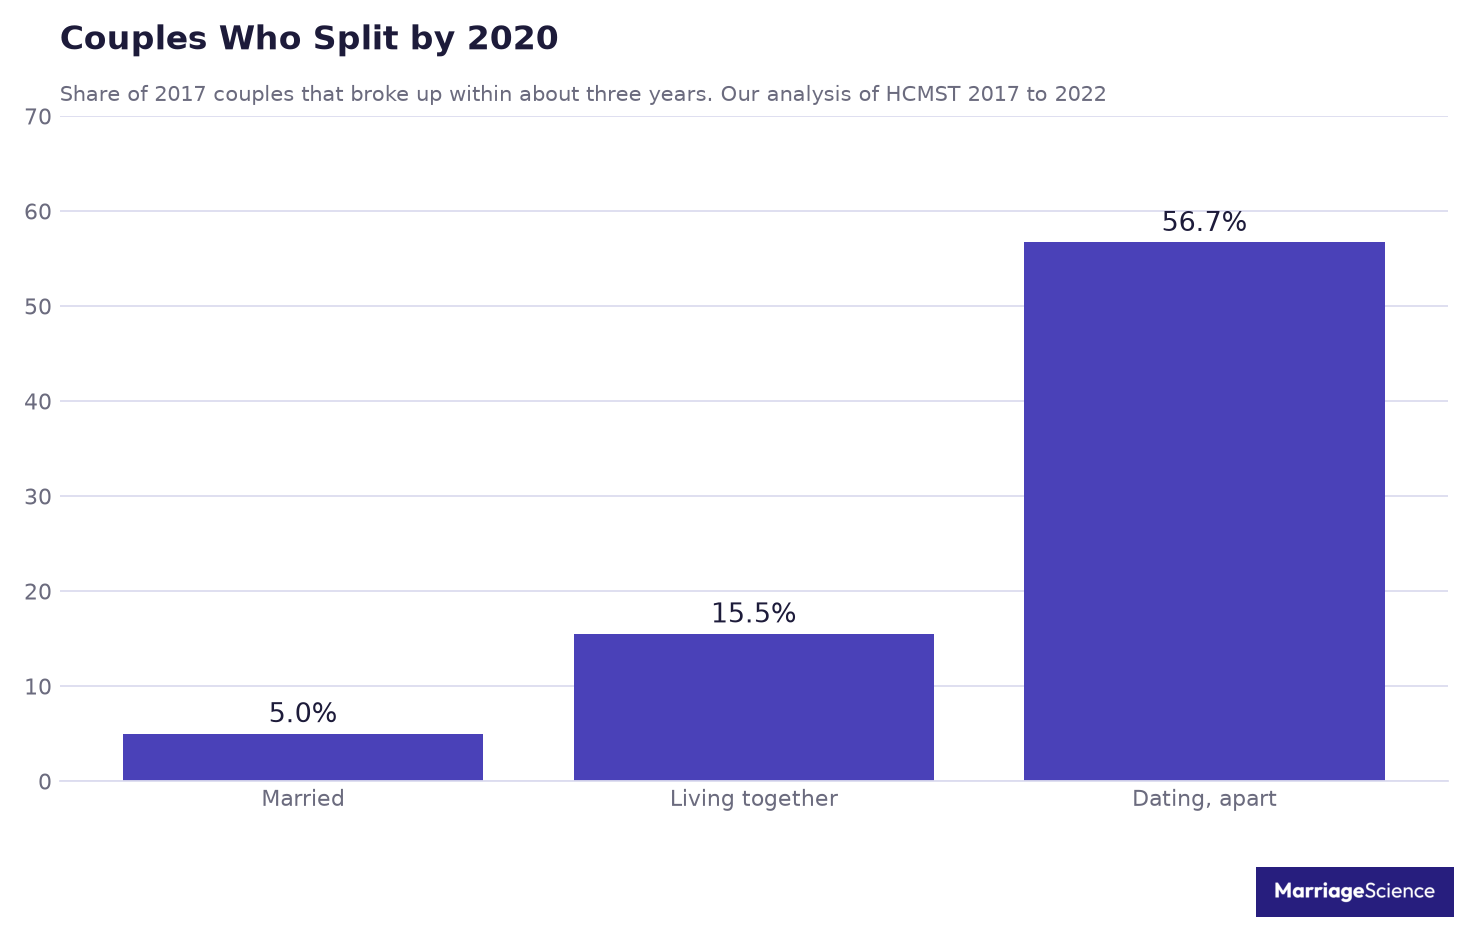
Overall, our analysis of the Stanford How Couples Meet and Stay Together panel, 14.9% of US couples who were together in 2017 had split by 2020. Notably, the differences by relationship type were substantial: 5.0% of married couples had split, compared with 56.7% of couples who were dating but did not live together.
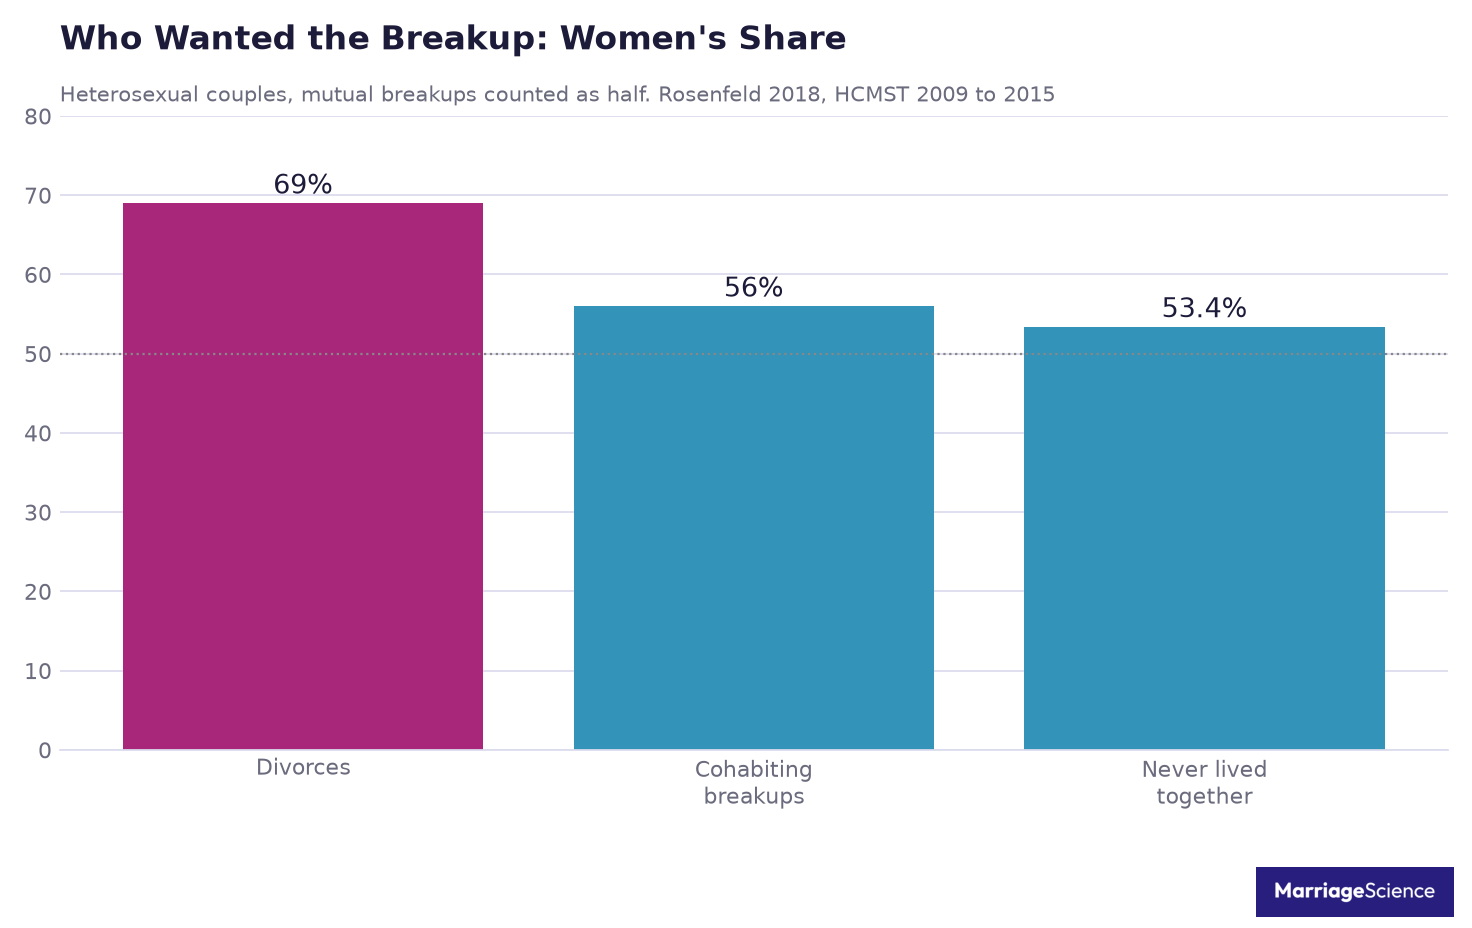
The claim that women initiate 70% of breakups comes from research on divorce. Rosenfeld (2018) found that women wanted 69% of marital breakups, while the figures for non-marital breakups were much closer to an even split.
Key Statistics on Breakups
The first six figures below come from our analysis of the Stanford HCMST panel covering 2017 to 2022. Each of the remaining figures names its source in the sentence.
- 14.9% of couples who were together in 2017 had split by 2020.
- 5.0% of married couples in 2017 had split by 2020.
- 15.5% of unmarried couples who lived together in 2017 had split by 2020.
- 56.7% of couples who were dating but not living together in 2017 had split by 2020.
Breakups by Relationship Length
- 60.2% of couples who had been together for less than 2 years in 2017 had split by 2020.
- 2.3% of couples who had been together for 20 years or longer in 2017 had split by 2020.
Additional Breakup and Relationship Findings
- 36.5% of unmarried adults ages 18 to 35 had broken up at least once over 20 months, according to Rhoades, Kamp Dush, Atkins, Stanley and Markman (2011).
- 77% of US adult citizens said they had broken up with someone, according to YouGov (2025).
- 74% of US adult citizens said someone had broken up with them, according to YouGov (2025).
- 32% of US adults reported having experienced two to three breakups in a YouGov daily question in 2023.
- 27% of first premarital cohabiting relationships had ended within 3 years, according to Copen, Daniels and Mosher (2013).
- 44.8% of young daters and people who lived with a partner had broken up and reconciled, according to Halpern-Meekin, Manning, Giordano and Longmore (2013).
Breakup, Reconciliation, and Well-Being Statistics
- 9% of US adults said a romantic relationship had ended because of political disagreement, according to YouGov (2024).
- 26.8% of people who had experienced a breakup in the previous 6 months reported symptoms in the mild-to-severe depression range, according to Verhallen et al. (2019).
- 25% of adults tracked after a breakup followed a fast recovery path, according to Verhallen et al. (2022).
- 97% of US adults said that breaking up in person is at least sometimes acceptable, according to Pew Research Center (2019).
How Common Are Breakups?
Breakups are common in dating and unmarried relationships, but estimates vary depending on the group researchers study. Panel studies track relationships over time, while public polls generally ask adults to recall their past experiences.

Rhoades, Kamp Dush, Atkins, Stanley and Markman (2011) followed 1,295 unmarried people ages 18 to 35 for 20 months. During that period, 36.5% experienced at least one breakup. Of those, 74.4% broke up once and 19.7% broke up twice.
A 2025 YouGov commercial opt-in poll of 1,125 US adult citizens found that 77% had broken up with someone. In the same poll, 74% said someone else had broken up with them.
In its 2023 daily question, YouGov asked 3,928 US adults how many breakups they had experienced. Because YouGov uses commercial opt-in panels, treat these results as poll figures rather than representative population estimates.
| Number of Breakups | Share of US Adults |
|---|---|
| None | 12% |
| One | 12% |
| Two to three | 32% |
| Four to five | 17% |
| Six to ten | 7% |
| More than ten | 5% |
These polls provide useful context because they include adults with a range of relationship histories. However, longitudinal studies are better suited to estimating how often relationships that are currently ongoing end within a specific period.
How Many Couples Break Up Within Three Years
In our analysis, we followed people who reported being in a relationship in 2017 and took part in the 2020 follow-up of the Stanford HCMST panel. Across married, cohabiting, and dating relationships, 14.9% had ended by the 2020 survey wave.
The figures varied considerably by relationship type. Married couples had the lowest share of breakups, while couples who were dating without living together had the highest.
Breakup Rates by Couple Type
The results below show the figures for each couple type. Respondent counts are unweighted counts for the groups included in our analysis.
| Couple Type in 2017 | Split by 2020 | Respondents |
|---|---|---|
| All couples | 14.9% | 1,675 |
| Married | 5.0% | 1,275 |
| Unmarried cohabiting | 15.5% | 203 |
| Dating, not living together | 56.7% | 197 |
How Relationship Length Affects Breakup Risk
Relationship length also made a difference. Couples who had already been together longer in 2017 were much less likely to report a breakup, separation, or divorce by 2020.
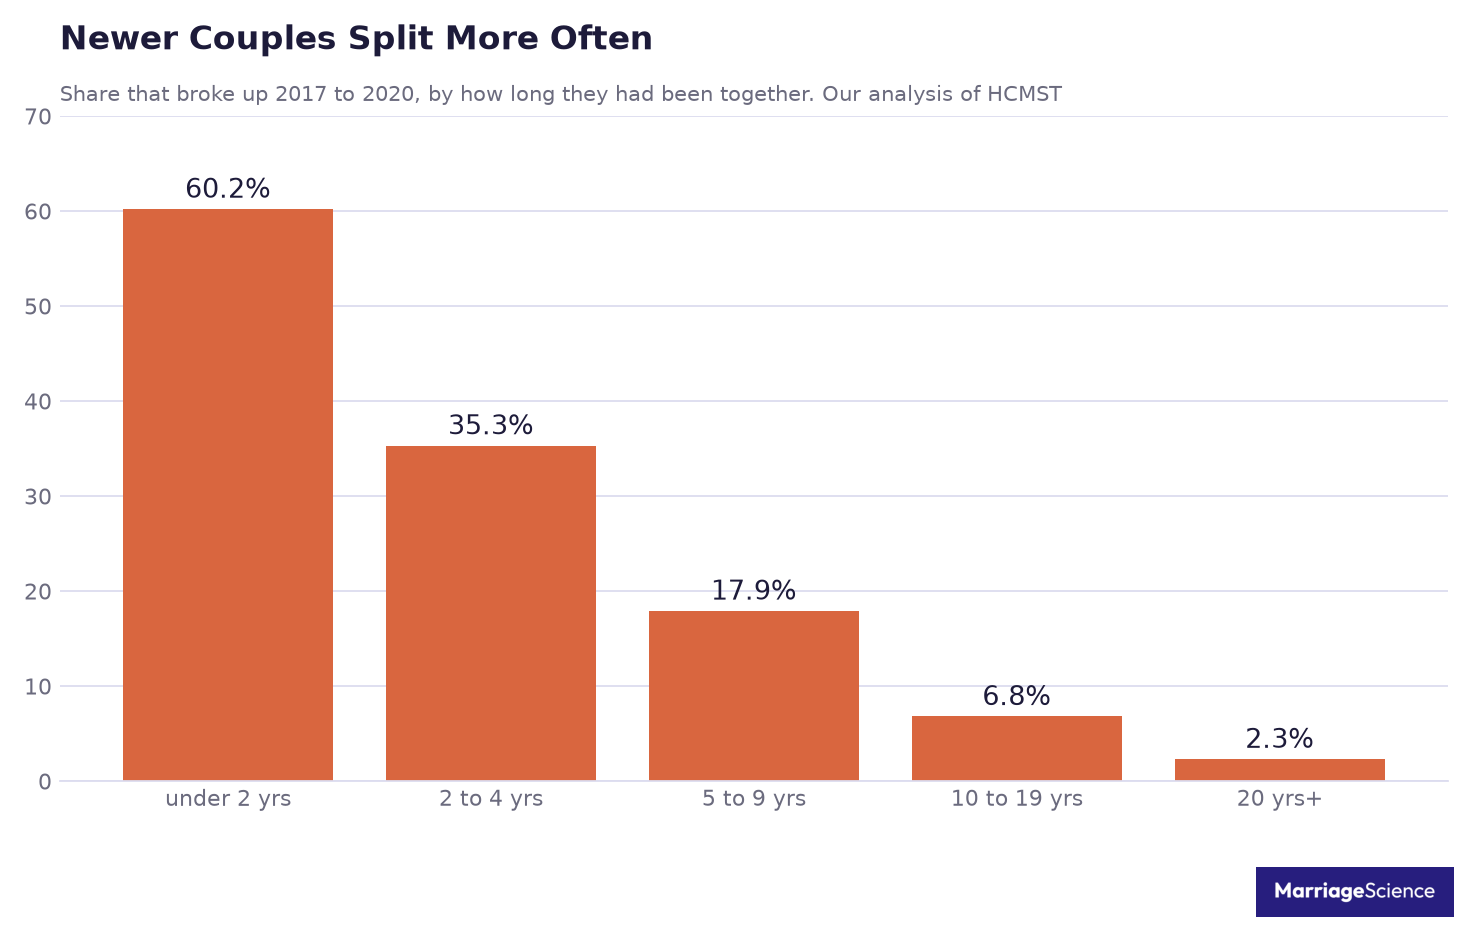
These figures include married, cohabiting, and dating relationships. We measured relationship length at the time of the 2017 survey and then followed those relationships through the 2020 wave.
| Relationship Length in 2017 | Split by 2020 |
|---|---|
| Under 2 years | 60.2% |
| 2 to 4 years | 35.3% |
| 5 to 9 years | 17.9% |
| 10 to 19 years | 6.8% |
| 20 years or more | 2.3% |
We found a similar pattern among unmarried couples. By 2020, 60.6% of unmarried couples who had been together for less than 2 years in 2017 had split. The share was 41.8% among those together for 2 to 4 years and 19.9% among those together for 5 years or longer.
Age and Breakup Risk
Age showed a similar pattern. Younger respondents who were in relationships in 2017 were more likely to report that their relationship had ended by 2020.
| Respondent Age in 2017 | Split by 2020 |
|---|---|
| 18 to 29 | 35.6% |
| 30 to 44 | 14.2% |
| 45 to 59 | 8.3% |
| 60 and older | 3.0% |
How the Findings Compare With Earlier Research
Rosenfeld (2018) offers a useful comparison because the study used earlier HCMST data collected from 2009 to 2015. It reported annual breakup rates of 1.2% for married couples, 9.4% for couples who had lived together, and 30.3% for couples who had never lived together.
Our three-year figures do not replicate those annual rates exactly. The study periods, groups, and follow-up windows differ. Even so, the overall pattern is consistent: marriage had the lowest breakup rate, while dating without living together had the highest.
Evidence on Shorter Relationships
Rosenfeld (2014) also found that newer relationships had high breakup rates. In that Journal of Marriage and Family article, unmarried couples who had been together for less than a year broke up at a rate of more than 60% per year.
A report by Copen, Daniels and Mosher (2013) from CDC/NCHS offers another perspective on early cohabitation. It reports the outcomes of first premarital cohabiting relationships within 3 years.
| Outcome by 3 Years | Share of First Premarital Cohabitations |
|---|---|
| Became marriages | 40% |
| Still intact | 32% |
| Dissolved | 27% |
The same CDC/NCHS report found that first premarital cohabiting relationships lasted a median of 22 months. This figure includes relationships that ended in marriage, remained intact, or dissolved.
Limitations of the Analysis
However, our HCMST analysis has several limitations. It covers roughly three years of follow-up and relies on respondents’ accounts of their own relationships. The unmarried groups are relatively small, with about 200 respondents in each, and the survey period overlaps with the first months of the pandemic.
Who Initiates Breakups
The claim that “women initiate 70% of breakups” needs more precise wording. Rosenfeld (2018) found that women wanted 69% of marital breakups. For non-marital relationships, the figures were much closer to an even split: 56% among couples who had lived together and 53.4% among couples who had never lived together.
Rosenfeld found that neither of the two non-marital figures differed significantly from 50%. In other words, the 70% figure applies to divorce, not to breakups across all relationship types. We discuss divorce initiation in our article on who initiates divorce.
Findings From Our HCMST Analysis
Our pooled analysis of heterosexual breakups reported in the 2020 and 2022 HCMST waves found that women wanted 53.5% of breakups when researchers counted mutual breakups as half. The analysis included 210 breakups, and the married subgroup was small.
In our pooled data, respondents described 38.2% of heterosexual breakups as mutual. Among married couples, women wanted 54.3% of breakups, based on 66 cases. Among couples who had never lived together, the figure was 52.9%.
Rosenfeld (2018) also reported the share of breakups that both partners wanted. Mutual breakups accounted for 19% of marital breakups, 32% of cohabiting breakups, and 35% of breakups among couples who had never lived together.
A Note About How Partners Report Breakups
One important caveat: Rosenfeld (2018) found that women reported more breakups as female-wanted than men did. The paper describes this difference as ego bias.
Most Common Reasons for Breakups
There is no large, representative US study that ranks breakup reasons and assigns a percentage to each one. The strongest available evidence comes from smaller or older studies, or research that focuses on a single issue.

Hill, Rubin and Peplau (1976) followed college dating couples for two years and recorded 103 breakups. They found that unequal levels of involvement and differences in age, educational goals, intelligence, and attractiveness predicted breakups.
The researchers also found that breakups tended to cluster around turning points in the school year. In most cases, both partners did not share the desire to end the relationship.
Sprecher (1994) studied both partners in 47 couples. Men and women gave similar reasons for ending their relationships and reported similar levels of overall distress.
Political Disagreement as a Breakup Factor
On this specific issue, a 2024 YouGov commercial poll of 14,636 US adults found that 9% said a romantic relationship had ended because of political disagreement. Since the poll focused on one issue, it cannot provide a complete ranking of breakup causes.
Bühler and Orth (2025) offer some of the clearest evidence on how relationships change before separation. Across four national longitudinal samples, relationship satisfaction declined gradually at first, then fell more sharply during a final phase that began 0.58 to 2.30 years before separation.
This pattern shows how satisfaction changes over time before a separation. It does not identify the final argument or suggest that one factor alone caused the breakup.
When Do Relationships End?
The timing of a breakup depends heavily on relationship type and length. In our HCMST analysis, couples who had been together for less than 2 years in 2017 had the highest share of breakups by 2020. Couples who had been together for 20 years or longer had the lowest.
This does not mean that new relationships are destined to fail. Rather, the early years often bring more change, particularly for couples who are dating but do not live together.
Bühler and Orth (2025) found that relationship satisfaction often declines before a separation. Across the four national samples, the sharper final phase began 0.58 to 2.30 years before the breakup.
How Each Partner Experiences the Lead-Up to Separation
The partner who was eventually left entered this final phase later, but their satisfaction declined more sharply. As a result, this finding may help explain why one person can feel blindsided while the other has been unhappy for a longer time.
Copen, Daniels and Mosher (2013) found that first premarital cohabiting relationships lasted a median of 22 months. This figure includes first cohabitations that led to marriage, continued, or dissolved.
How People Break Up
Pew Research Center (2019) asked US adults whether they considered different ways of ending a relationship acceptable at least some of the time. Respondents were much more accepting of in-person breakups than breakups by text, email, or private social media message.

The figures below show the share of adults in the Pew Research Center (2019) survey who said each method was at least sometimes acceptable.
| Method | Acceptable at Least Sometimes |
|---|---|
| In person | 97% |
| Phone | 51% |
| Text | 14% |
| 14% | |
| Social media private message | 11% |
How Teenagers Reported Ending Relationships
In 2015, Pew asked teens ages 13 to 17 who had relationship experience about how they had ended relationships. Among those teens, 62% had broken up with someone in person, 27% had ended a relationship by text, and 31% had been broken up with by text.
Keep the teen findings separate from the adult results. The groups differ in age, social environment, and dating norms.
Breakup Recovery Statistics
In practice, people recover from breakups in different ways. Some feel better quickly, others continue to experience distress. Still others see mixed changes in emotional distress and life satisfaction.
Eastwick, Finkel, Krishnamurti and Loewenstein (2008) followed students after breakups and measured their distress at 0, 2, 6, and 10 weeks. Of the 69 students in the study, 26 experienced a breakup. Their measured distress decreased over time.
Rhoades, Kamp Dush, Atkins, Stanley and Markman (2011) found varied short-term responses to breakups among unmarried adults ages 18 to 35. Distress increased after 30.7% of breakups, decreased after 19.6%, and changed very little after 49.7%.
In the same study, life satisfaction decreased after 28.6% of breakups and increased after 16.1%. The researchers also found that 36% of those who had broken up were already dating someone new by the next survey.
Readers who are ready to meet someone new can start with our list of the best dating sites. Our guide to the best free dating sites covers the options that cost nothing.
Verhallen et al. (2022) followed 87 adults for 30 weeks and identified four recovery paths: resilience, fast recovery, slow recovery, and chronic distress.
| Recovery Path | Share of 87 Adults |
|---|---|
| Resilience | 44% |
| Fast recovery | 25% |
| Slow recovery | 22% |
| Chronic distress | 9% |
How People Experience Breakup Pain
Morris, Reiber and Roman (2015) surveyed 5,705 people across 96 countries about the pain of a breakup. Women reported an average emotional pain score of 6.84 and a physical pain score of 4.21. Men reported scores of 6.58 for emotional pain and 3.75 for physical pain.
You may have seen the popular claim that getting over a breakup takes 18 months. We traced that figure in our guide to how long it takes to get over a breakup. It comes from a 2017 OnePoll marketing poll for Yelp Eat24. The poll arrived at 18 months by multiplying three major breakups by six months each, but it did not publish its methodology.
Getting Back Together Statistics
Several sources examine how often former partners get back together, and our guide to whether an ex comes back discusses the signs of reconciliation. However, the studies use different age groups, relationship types, and sampling methods, so you should not average their findings.
Halpern-Meekin, Manning, Giordano and Longmore (2013) studied 792 daters and people living with a partner, ages 17 to 24, in Lucas County, Ohio. In this group, 44.8% had broken up and reconciled with their current or most recent partner.
Among the participants who reconciled in Halpern-Meekin et al. (2013), 57% had sex with their former partner. Because the study focused on young people, do not treat this figure as an estimate for all US adults.
On-Again, Off-Again Relationships
Dailey, Pfiester, Jin, Beck and Clark (2009) found that almost two thirds of 445 US college students had experienced an on-again, off-again relationship. These findings describe college dating, not the wider adult population.
Vennum, Lindstrom, Monk and Adams (2014) studied a nationally representative sample of 323 cohabiting couples and 752 married couples. More than one third of the cohabiting partners and one fifth of the married partners had broken up and reunited within their current relationship.
A 2025 YouGov poll found that 38% of US adult citizens had gotten back together with an ex. The same poll found that 42% had experienced an on-again, off-again relationship.
We did not find a study that reports how often reconciled couples stay together in the long term. Before citing claims that most reunited couples break up again, look for a clear and reliable source.
Breakups and Mental Health
Breakups can be painful, and a small number of studies link them to mental health risks. Keep in mind that these findings describe associations within the specific groups researchers studied.
Verhallen et al. (2019) studied 71 people who had experienced a breakup within the previous 6 months. Among them, 26.8% reported symptoms that fell within the mild-to-severe depression range.
Monroe, Rohde, Seeley and Lewinsohn (1999) studied 1,470 older adolescents. They found that a recent breakup predicted the first onset of major depression.
Kendler et al. (2003) studied 7,322 adult twins. They found that being left by a partner involved both humiliation and loss, and predicted depression more strongly than events involving loss alone.
Social Media and Post-Breakup Distress
Marshall (2012) studied 464 people and found a link between monitoring an ex on Facebook and greater distress and longing, as well as lower personal growth. If you are reading about the stages of a breakup while checking your ex’s page every day, this finding is worth considering.
Schredl and Wood (2021) studied 425 students and analyzed 1,612 dreams recorded over 14 days. An ex-partner appeared in 4.78% of the dreams, and 15.76% of the students dreamed about an ex at least once during the two-week period.
For practical advice on navigating the weeks after a split, see our guide on how to get over a breakup.
If you are in crisis, call or text 988. If you or someone else faces immediate danger, call 911.
Methodology and Sources
To produce these estimates, we analyzed the public Stanford How Couples Meet and Stay Together (HCMST) 2017–2022 file. Specifically, the analysis includes respondents who reported being in a relationship in 2017 and completed the 2020 follow-up.
For each relationship reported in 2017, we checked whether it had ended through divorce, separation, or breakup by the 2020 survey wave. Couples whose partner had died were not included.
To account for attrition, we applied the wave 2 adjusted weight and excluded cells with fewer than 50 respondents. The follow-up covered about three years, and the survey period overlapped with the first months of the pandemic.
Studies and Surveys Cited
- How Couples Meet and Stay Together, Rosenfeld, Thomas and Hausen, Stanford, 2017 to 2022.
- Rosenfeld 2018, gender of breakup, HCMST 2009 to 2015.
- Rosenfeld 2014, Journal of Marriage and Family, unmarried breakup rates by relationship duration.
- Rhoades, Kamp Dush, Atkins, Stanley and Markman 2011, unmarried young adults followed every four months for 20 months.
- Copen, Daniels and Mosher 2013, CDC/NCHS report on first premarital cohabitation.
- Halpern-Meekin, Manning, Giordano and Longmore 2013, young daters and cohabitors.
- Dailey, Pfiester, Jin, Beck and Clark 2009, on-again off-again relationships among college students.
- Vennum, Lindstrom, Monk and Adams 2014, relationship cycling among cohabiting and married couples.
- YouGov 2025, commercial opt-in poll of US adult citizens about relationships and breakups.
- YouGov 2023, daily question on number of breakups experienced.
- Hill, Rubin and Peplau 1976, two-year study of college dating couples.
- Sprecher 1994, breakup reasons and distress from both partners.
- YouGov 2024, commercial poll on political disagreement and relationship endings.
- Bühler and Orth 2025, relationship satisfaction changes before separation.
- Pew Research Center 2019, adult views on acceptable breakup methods.
- Pew Research Center 2015, teen breakup methods.
- Eastwick, Finkel, Krishnamurti and Loewenstein 2008, predicted and experienced breakup distress.
- Morris, Reiber and Roman 2015, emotional and physical pain after breakups.
- Verhallen et al. 2019, depressive symptoms after recent breakup.
- Verhallen et al. 2022, 30-week breakup recovery trajectories.
- Monroe, Rohde, Seeley and Lewinsohn 1999, breakup and first onset of major depression in older adolescents.
- Kendler et al. 2003, stressful life events and depression in adult twins.
- Marshall 2012, Facebook surveillance of an ex and post-breakup adjustment.
- Schredl and Wood 2021, dreams about ex-partners.
Claims We Excluded
For that reason, we left out several popular claims because the available sources were too weak to support them. For example, these include ranked lists of breakup reasons with percentages, reunion success rates, charts claiming to identify a “breakup season” through Facebook status changes, coach polls, and app polls.
We mention the OnePoll 2017 Yelp Eat24 “18 months” claim only because we traced it to a marketing poll. Do not cite it as a scientific estimate of how long breakup recovery takes.