


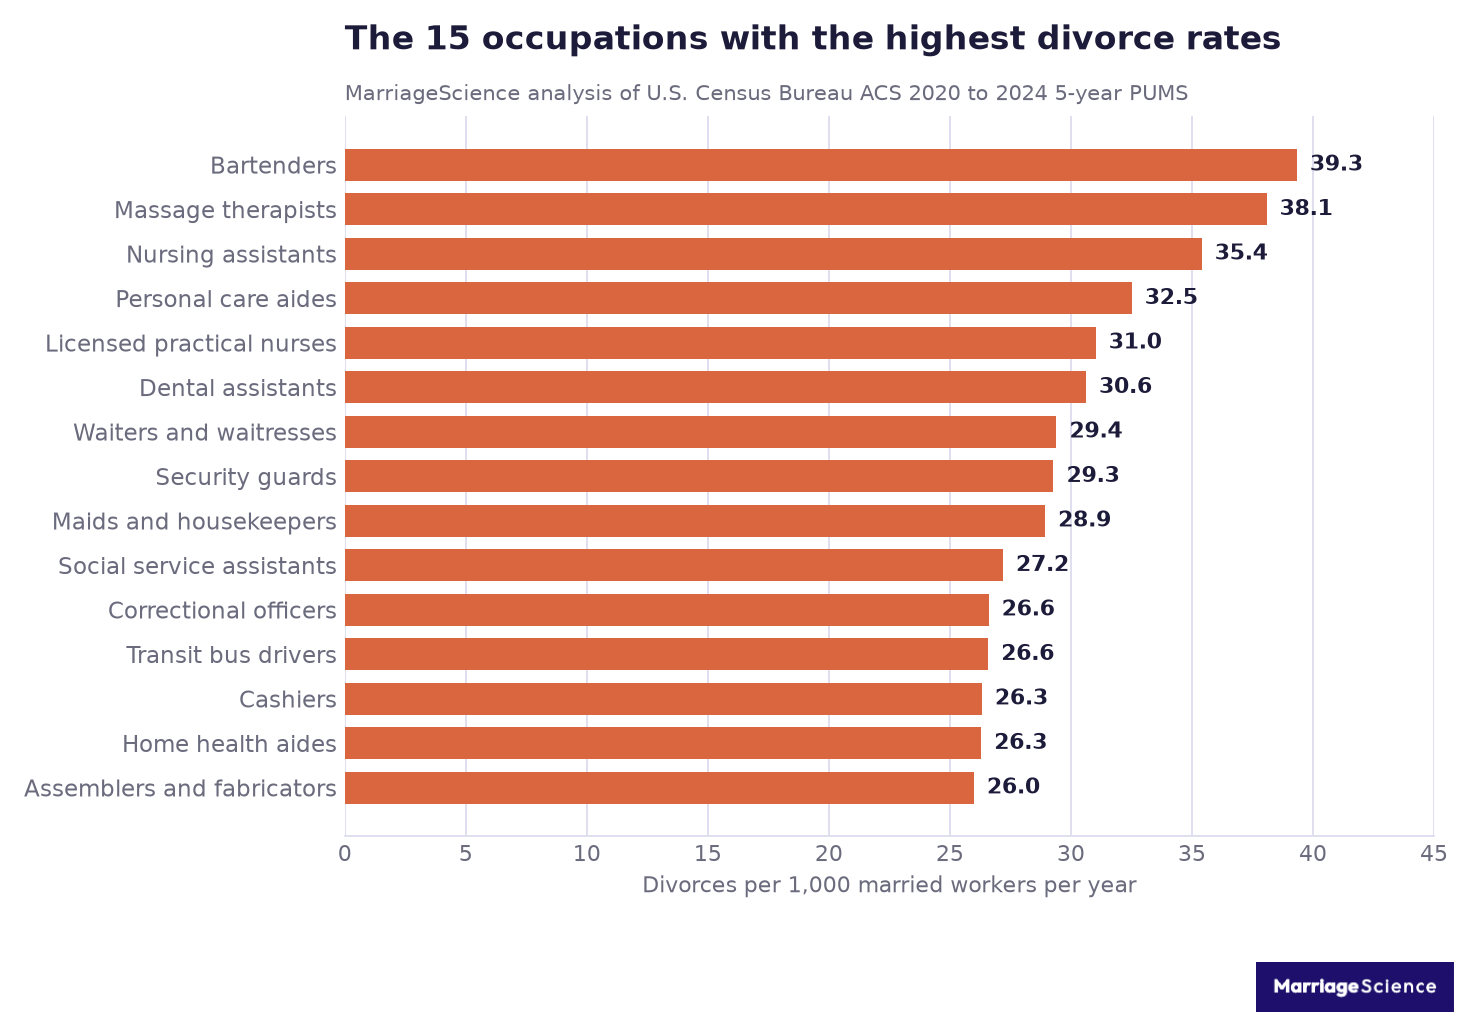
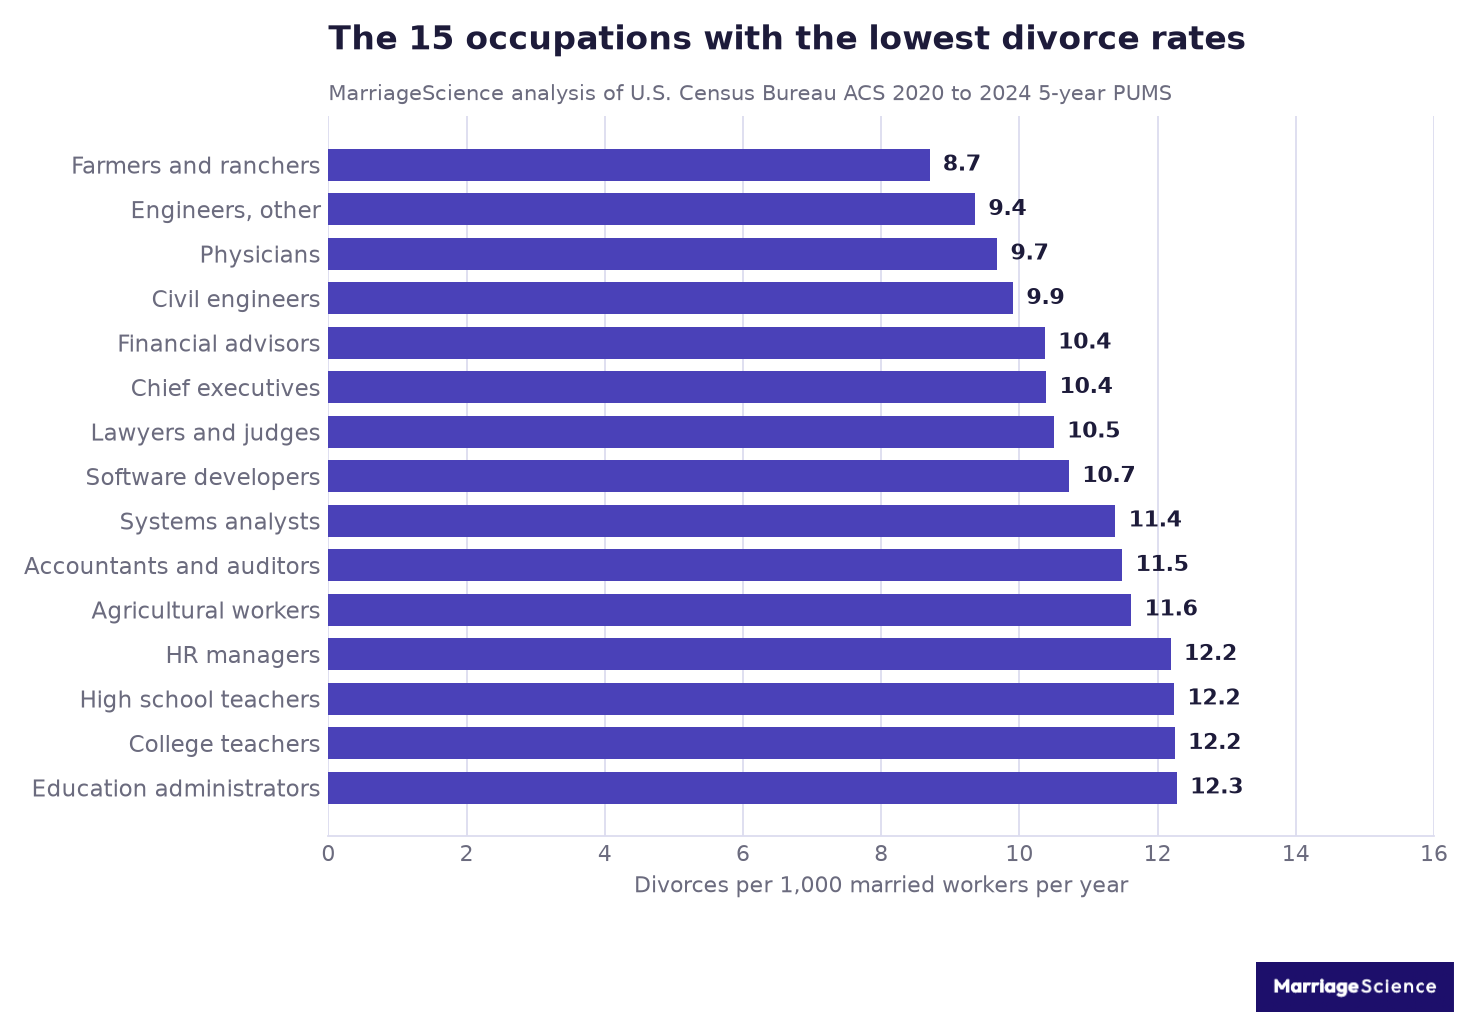
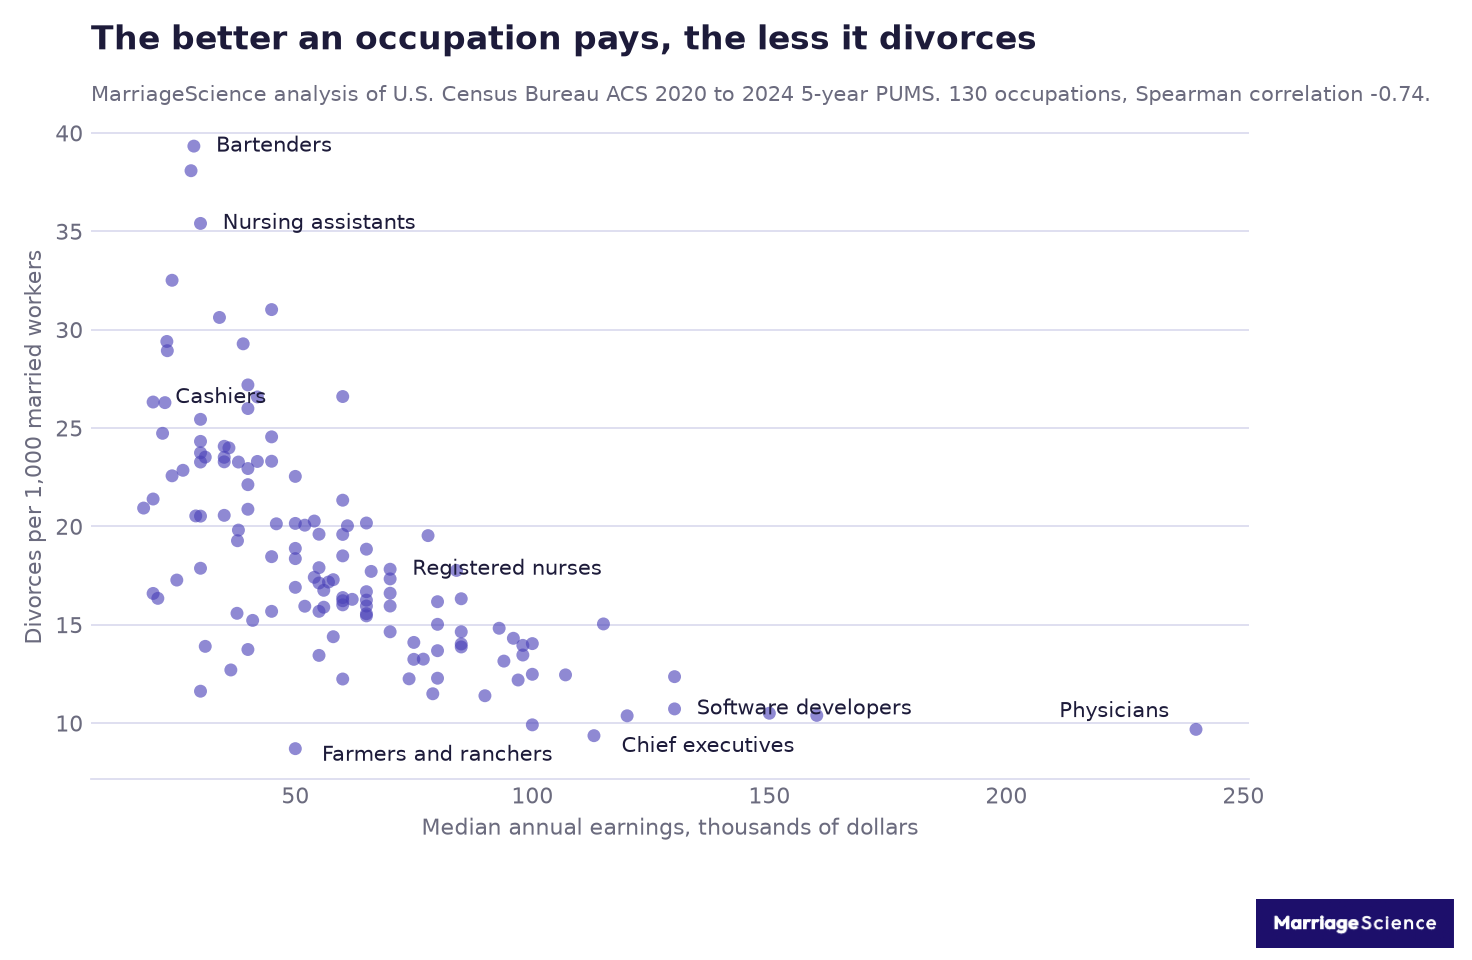
TL;DR: Bartenders have the highest divorce rate of any occupation in the United States, at 39.3 divorces a year per 1,000 married workers, and farmers and ranchers have the lowest at 8.7. Pay tracks that ranking closely, with the lowest-paid quarter of occupations divorcing at 24.1 per 1,000 against 13.2 in the highest-paid quarter.
Bartenders divorce at 4.5 times the rate of farmers and ranchers. That is the widest gap between any two occupations in this analysis, and it survives holding the age of the workforce constant.
We built the ranking from 3,729,969 Census person records covering 77.7 million married American workers, of whom 1,327,261 divorced in the year before they were surveyed. That is a national rate of 17.1 divorces per 1,000 married workers a year.
The source is the Census Bureau ACS public use microdata for 2020 to 2024, the same file the Census Bureau publishes for researchers. 525 occupations were computed and 130 of them carry enough divorces to be ranked.
Two design choices separate this from a head count. The denominator holds only people who were actually married during the year, so an occupation full of single people cannot look stable by default. And every rate is computed a second time with the age structure of the occupation held constant, because divorce risk peaks in the thirties and occupations differ enormously in how old their workers are.
The Occupations With the Highest Divorce Rates
Twelve of the twenty highest-divorce occupations pay a median wage under $35,000 a year, and six of them are care work: nursing assistants, personal care aides, licensed practical nurses, dental assistants, home health aides and social service assistants. The people holding American healthcare together at the bedside also have some of the least stable marriages in the country.
| Occupation | Divorces per 1,000 married workers | Median earnings |
| Bartenders | 39.3 | $28,600 |
| Massage Therapists | 38.1 | $28,000 |
| Nursing Assistants | 35.4 | $30,000 |
| Personal Care Aides | 32.5 | $24,000 |
| Licensed practical and vocational nurses | 31.0 | $45,000 |
| Dental Assistants | 30.6 | $34,000 |
| Waiters And Waitresses | 29.4 | $22,900 |
| Security guards and gambling surveillance officers | 29.3 | $39,000 |
| Maids And Housekeeping Cleaners | 28.9 | $23,000 |
| Social And Human Service Assistants | 27.2 | $40,000 |
| Correctional officers and jailers | 26.6 | $60,000 |
| Transit and intercity bus drivers | 26.6 | $42,000 |
Bartending and massage therapy sit at the top on smaller samples than the rest, 155 and 138 divorces respectively, so treat the exact ordering of the first two places as a coin toss.
The occupations from third place down, however, rest on several hundred divorces each and the ordering there is firm. For the national picture these figures sit inside, see our divorce statistics for 2026.
The Nursing Ladder, One Ward and Three Rates
The clearest signal in this half of the table is the nursing ladder. Nursing assistants divorce at 35.4 per 1,000 a year, licensed practical nurses at 31.0, and registered nurses at 17.8.
Three rungs of the same profession, often on the same ward and the same shift pattern, and the divorce rate halves as the credential gets longer.
Hospitality, meanwhile, repeats the shape. Waiters and waitresses divorce at 29.4 per 1,000 while chefs and head cooks, who work the same nights in the same buildings, divorce at 19.8.
What separates the pairs in both industries is job security and the ability to say no to a shift, which are the things a license or a kitchen title buys.
The Occupations With the Lowest Divorce Rates
Naturally, the bottom of the table is engineers, physicians, lawyers, executives and software developers, which is what most people would guess. The occupation that actually finishes last is the one nobody guesses.
| Occupation | Divorces per 1,000 married workers | Median earnings |
| Farmers, ranchers and other agricultural managers | 8.7 | $50,000 |
| Other Engineers | 9.4 | $113,000 |
| Physicians | 9.7 | $240,000 |
| Civil Engineers | 9.9 | $100,000 |
| Personal Financial Advisors | 10.4 | $120,000 |
| Chief executives and legislators | 10.4 | $160,000 |
| Lawyers, judges and magistrates | 10.5 | $150,000 |
| Software Developers | 10.7 | $130,000 |
| Computer Systems Analysts | 11.4 | $90,000 |
| Accountants And Auditors | 11.5 | $79,000 |
| Other Agricultural Workers | 11.6 | $30,000 |
| Human Resources Managers | 12.2 | $97,000 |
Farmers and ranchers divorce at 8.7 per 1,000 on a median wage of $50,000, which is a third of what physicians earn and half of what lawyers earn. Farm households own the business they work in, often across generations, and separating a marriage there means splitting an operating asset rather than a salary. The same logic runs through our prenup statistics.
Why the Bottom of the Table Is Mostly Degrees
Education runs through the rest of the bottom twenty.
Physicians, engineers, lawyers, accountants, systems analysts and postsecondary teachers all require years of schooling, and long schooling pushes back the age at first marriage, which is one of the most reliable protective factors in the divorce literature.
The job title is partly standing in for a marriage that started later and on firmer ground.
Teachers are the interesting entry here, though, because the pay is not the story. High school teachers divorce at 12.2 per 1,000 on a median $60,000, and elementary and middle school teachers at 13.4 on $55,000.
Both beat occupations paying twice as much. A predictable calendar and a workplace where the day ends appears to be worth a great deal.
Still, one warning about reading the bottom of this table as career advice.
The occupations here are the hardest in the economy to enter, and the people who enter them arrive with the family stability, the schooling and the marriage timing that predict low divorce before the first day of work. Nobody lowers their odds of divorce by becoming a physician.
Divorce Rate by Occupation Group
Grouping the 525 occupations into the Census families removes the small-sample noise while it leaves a three-to-one spread. Healthcare support, which is aides and assistants, divorces at nearly three times the rate of architecture and engineering.
| Occupation group | Divorces per 1,000 married workers | Married workers |
| Healthcare support | 30.8 | 1,993,775 |
| Food preparation and serving | 24.1 | 1,974,480 |
| Personal care and service | 21.5 | 1,518,520 |
| Transportation and material moving | 21.3 | 4,938,399 |
| Building and grounds cleaning and maintenance | 21.1 | 2,270,914 |
| Protective service | 20.6 | 1,700,864 |
| Production | 19.9 | 3,983,108 |
| Office and administrative support | 19.9 | 7,489,972 |
| Sales | 17.8 | 6,159,320 |
| Community and social service | 16.9 | 1,473,220 |
| Installation, maintenance, and repair | 16.6 | 2,568,863 |
| Healthcare practitioners and technical | 16.3 | 5,825,550 |
| Business and financial | 15.5 | 3,356,781 |
| Construction and extraction | 15.3 | 3,940,817 |
| Arts, design, entertainment, sports, and media | 14.7 | 1,553,170 |
| Education, training, and library | 14.3 | 5,536,329 |
| Management | 14.1 | 11,385,135 |
| Life, physical, and social science | 13.6 | 962,696 |
| Legal | 12.9 | 1,059,244 |
| Farming, fishing, and forestry | 12.7 | 408,457 |
| Computer and mathematical | 12.1 | 3,437,937 |
| Financial specialists | 11.7 | 1,979,590 |
| Architecture and engineering | 11.0 | 2,087,593 |
The sector splits in half along the credential line. Healthcare support staff divorce at 30.8 per 1,000, while healthcare practitioners, the doctors, nurses and technologists, divorce at 16.3. Two people can work the same ward and face nearly double the difference in marital risk depending on which side of that line their job title falls.
Where the Schedule Does the Damage
Protective service at 20.6 and transportation at 21.3 are the two groups where the pay is respectable and the rate is high anyway. Both are built on nights, weekends and time spent away from home, and both employ men who are married at above-average rates to begin with. Whatever is raising those numbers, it is arriving through the schedule.
Office and administrative support is the group worth watching for scale. It divorces at 19.9 per 1,000, a little above the national figure, and it covers 7.5 million married workers, so it contributes more divorces in absolute terms than any group except management.
A modest rate across a very large group moves more marriages than a dramatic rate in a small one.
Pay Predicts the Ranking Better Than Anything Else We Tested
Finally, median earnings and divorce rate move against each other with a Spearman correlation of -0.74 across the 130 ranked occupations. That is a strong relationship for social data, and it survives every cut we tried.
| Occupations by pay | Median earnings | Mean divorce rate per 1,000 |
| Lowest-paid quarter | $29,500 | 24.1 |
| Second quarter | $45,000 | 20.3 |
| Third quarter | $60,000 | 17.1 |
| Highest-paid quarter | $93,500 | 13.2 |
The economics literature has been circling this for years. Killewald, American Sociological Review 2016 found that a husband being out of full-time work raises the odds of divorce in the following year, while household income and the wife’s earnings do not, which points at economic precarity, not at the size of the household budget.
That distinction matters for reading this table. A low median wage in an occupation usually travels with unpredictable hours, a schedule set by someone else a week at a time, no paid leave when a child is sick, and a real chance of losing the job in a downturn.
Those conditions are what the occupations at the top of our ranking share, and the wage is the easiest of them to measure.
The Two Occupations That Break the Pattern
Two occupations break the pattern hard enough to be worth naming. Correctional officers earn a median $60,000 and still divorce at 26.6 per 1,000, above cashiers.
Other agricultural workers earn a median $30,000 and divorce at 11.6, better than accountants. Pay explains most of the ranking and none of those two.
Of the pair, the correctional officer number is the more instructive. Prisons run on rotating shifts in isolated locations, mandatory overtime and a job that follows people home, and the pay is solidly middle-class.
If money were doing the work in this data, that occupation would sit near the middle of the table. It sits eleventh from the top.
Age Does Not Explain the Ranking
Divorce risk peaks in the thirties, and occupations differ enormously in how old their workforce is, so the obvious objection to any ranking like this one is that it just sorts jobs by age.
We tested it by recomputing every rate standardized to the age structure of the whole married workforce, in five bands.
Still, the ranking barely moved. The median occupation shifted two places out of 130, eight of the top ten stayed in the top ten and nine of the bottom ten stayed in the bottom ten.
| Occupation | Raw rate per 1,000 | Age-standardized rate | Change |
| Bartenders | 39.3 | 34.5 | -4.8 |
| Waiters And Waitresses | 29.4 | 26.6 | -2.8 |
| Nursing Assistants | 35.4 | 35.1 | -0.2 |
| Personal Care Aides | 32.5 | 34.1 | +1.6 |
| Registered Nurses | 17.8 | 17.5 | -0.3 |
| Software Developers | 10.7 | 10.2 | -0.6 |
| Physicians | 9.7 | 9.6 | -0.1 |
| Farmers, ranchers and other agricultural managers | 8.7 | 8.9 | +0.2 |
Bartenders take the largest single correction, from 39.3 down to 34.5, because the trade skews young. They stay in first place anyway. Age moves the numbers by a point or two and leaves the story where it was.
How the Age Adjustment Works
Direct standardization works by asking a counterfactual question of every occupation: if this job employed people of exactly the same ages as the American married workforce as a whole, and each age band kept its own divorce rate, what would the occupation-wide rate be?
Anything left after that adjustment belongs to the job or to the people who choose it, and in this data almost everything is left.
Women Divorce More Than Men in the Same Job
Across the whole married workforce, women divorce at 19.9 per 1,000 a year and men at 14.7. Some of that is reporting, since divorced women are more likely to be in paid work than divorced men are to change anything about theirs, and some of it is real.
What is harder to explain away, though, is where the gap is widest.
| Occupation | Men | Women | Share of workers who are women |
| Security guards and gambling surveillance officers | 22.6 | 55.2 | 20% |
| Truck drivers and driver/sales workers | 18.7 | 45.3 | 6% |
| Couriers And Messengers | 19.5 | 37.4 | 26% |
| Other Metal Workers And Plastic Workers | 20.0 | 37.9 | 19% |
| First-Line Supervisors Of Production And Operating Workers | 12.7 | 30.4 | 18% |
| Police Officers | 18.0 | 33.7 | 10% |
| Correctional officers and jailers | 23.8 | 37.9 | 20% |
| Sales Managers | 11.3 | 24.7 | 28% |
Women divorce more often than men in 64 of the 69 occupations where both sexes carry enough cases to compare, and the fewer women an occupation employs, the larger that gap gets. Female security guards divorce at 55.2 per 1,000 against 22.6 for the men beside them. Women driving trucks divorce at 45.3 against 18.7.
McKinnish, Journal of Human Resources 2007 offered one mechanism for occupation effects of this kind, showing that workers in occupations with more coworkers of the opposite sex divorce more often.
That study cannot explain this pattern, because the women here are the minority sex in their own workplaces and the men around them are not divorcing at the same rate. Shift work, physical risk and the marriage market a woman enters when she takes a job her husband’s friends do not recognize are all candidates, and none of them is settled.
Our marriage statistics page covers who marries in the first place.
Where the Gap Runs the Other Way
The five occupations that run the other way are worth listing, because they are all heavily female workplaces where the men are the rarity: maids and housekeepers, general office clerks, other teachers and instructors, credit counselors and loan officers, and nursing assistants. Male maids and housekeepers divorce at 36.1 per 1,000 against 27.9 for their female colleagues.
One pattern fits both directions: whoever is the minority sex in an occupation divorces more often than the majority working beside them. That is a finding about who takes those jobs at least as much as it is a finding about the jobs, and this dataset cannot separate the two.
Police, Nurse and Doctor Divorce Rates
Three jobs draw most of the questions about work and divorce: police officers, nurses and doctors. In our data, police officers divorce a little above the national rate, registered nurses sit right on it, and physicians are among the lowest of any occupation.
| Occupation | Divorces per 1,000 married workers a year | Women | Men |
| Police officers | 19.5 | 33.7 | 18.0 |
| Correctional officers and jailers | 26.6 | 37.9 | 23.8 |
| Firefighters | 13.7 | too few cases | 13.3 |
| Licensed practical nurses | 31.0 | 32.5 | too few cases |
| Registered nurses | 17.8 | 18.2 | 14.7 |
| Nurse practitioners and midwives | 12.4 | 12.3 | too few cases |
| Physicians | 9.7 | 10.0 | 9.4 |
| All occupations | 17.1 | 19.9 | 14.7 |
Cells marked “too few cases” have fewer than 50 divorces in the sample for that sex, the same floor used elsewhere in this study.
Police Officers and the 75 Percent Myth
Police officers divorce at 19.5 per 1,000 married workers a year, against 17.1 for all occupations. Adjusted for age the figure is 18.3, about 7 percent above the average.
Women officers divorce at 33.7 per 1,000, almost twice the 18.0 of men on the same force. Correctional officers sit higher at 26.6, and firefighters lower at 13.7.
The number that circulates online is far bigger: police divorce rates of “66 to 75 percent”. Radford University psychologists Shawn McCoy and Michael Aamodt went looking for its source and found no empirical study behind it.
Their analysis of the 2000 Census put law enforcement at 14.47 percent divorced or separated, below the 16.35 percent for all occupations and the 16.96 percent expected for officers’ age, sex and income (McCoy and Aamodt). The older department surveys cited for the myth were small, and the one with a national comparison found police below it.
Their figure counts people who are divorced or separated at the time of the census, while ours counts new divorces in a year, so the two are not directly comparable. Neither comes anywhere near three in four.
Nurses: It Depends on the License
Registered nurses divorce at 17.8 per 1,000 a year, almost exactly the national rate. Licensed practical nurses divorce at 31.0 and nurse practitioners at 12.4, so the answer to whether nurses divorce more depends on which nurse.
A 2015 study in the BMJ reached a similar placement from census data. After adjusting for age, sex, income, hours worked, years married and other factors, 33.0 percent of nurses had ever divorced, against 24.3 percent of physicians and 35.0 percent of professionals outside healthcare (Ly, Seabury and Jena).
Doctors Divorce Less Than Most Workers
Physicians divorce at 9.7 per 1,000 a year, about 43 percent below the national rate. That is the third lowest of the 130 occupations large enough to rank in this study.
The BMJ study, covering 48,881 physicians, put their adjusted chance of ever divorcing at 24.3 percent. Pharmacists, at 22.9 percent, and dentists, at 25.2 percent, landed close to them.
The same study found that women physicians had 1.51 times the odds of having divorced compared with men, and longer working hours went with more divorce only for women. In our one-year rate the gap is smaller, 10.0 per 1,000 for women physicians against 9.4 for men.
What This Ranking Cannot Tell You
Ultimately, a job title recorded after a divorce cannot prove the job caused it. The ACS asks what you do now and whether you divorced in the past 12 months, in that order, so a woman who took work as a home health aide after her marriage ended is counted as a home health aide who divorced.
That is not a flaw we can engineer away with a bigger sample, and it is the main reason this page ranks occupations without telling anyone to leave one. A rate is a description of a group of marriages, and the six limits below are the ones that would change how a careful reader uses these numbers.
Six Limits Worth Knowing
- Causation runs both ways. Divorce pushes people into flexible, lower-paid, quick-to-enter work, and those are the same occupations at the top of this ranking. Amato, Journal of Marriage and Family 2010 reviews how much of the economic gap around divorce predates it.
- Selection into the job comes first. Occupations sort people by education, age at first marriage and family background, all of which predict divorce before anyone clocks in.
- Active-duty military are excluded. The universe is civilian employment, so the armed forces do not appear at all.
- People out of work are excluded. Anyone not employed when surveyed has no current occupation to rank, which removes a group with elevated divorce risk.
- Same-sex and opposite-sex marriages are pooled, and the file does not let us separate first marriages from remarriages, which divorce more often.
- This page carries no standard errors. Because we did not fetch the 80 replicate weights, the guard against noise is a floor of 100 unweighted divorces per occupation instead of a confidence interval.
Summary: Divorce by Occupation, by the Numbers
Scope of the Analysis
| Metric | Value | Source |
| National divorce rate among married workers | 17.1 per 1,000 a year | ACS 2020 to 2024 PUMS |
| Married workers in the universe | 77,703,569 | ACS 2020 to 2024 PUMS |
| Divorces in the universe, weighted | 1,327,261 | ACS 2020 to 2024 PUMS |
| Census person records analyzed | 3,729,969 | ACS 2020 to 2024 PUMS |
| Occupations computed | 525 | Census occupation codes |
| Ranked in the tables above | 130 | floor of 100 unweighted divorces |
The Findings at a Glance
| Metric | Value | Source |
| Highest divorce rate | bartenders, 39.3 per 1,000 | Marriage Science analysis of Census ACS 2020 to 2024 PUMS |
| Lowest divorce rate | farmers and ranchers, 8.7 per 1,000 | Marriage Science analysis of Census ACS 2020 to 2024 PUMS |
| Gap between highest and lowest | 4.5 times | Marriage Science analysis of Census ACS 2020 to 2024 PUMS |
| Highest occupation group | healthcare support, 30.8 per 1,000 | Marriage Science analysis of Census ACS 2020 to 2024 PUMS |
| Lowest occupation group | architecture and engineering, 11.0 per 1,000 | Marriage Science analysis of Census ACS 2020 to 2024 PUMS |
| Correlation of median pay with divorce rate | Spearman -0.74 across 130 occupations | Marriage Science analysis of Census ACS 2020 to 2024 PUMS |
| Lowest-paid quarter of occupations | 24.1 per 1,000 | Marriage Science analysis of Census ACS 2020 to 2024 PUMS |
| Highest-paid quarter of occupations | 13.2 per 1,000 | Marriage Science analysis of Census ACS 2020 to 2024 PUMS |
| Women, all occupations | 19.9 per 1,000 | Marriage Science analysis of Census ACS 2020 to 2024 PUMS |
| Men, all occupations | 14.7 per 1,000 | Marriage Science analysis of Census ACS 2020 to 2024 PUMS |
| Occupations where women divorce more than men | 64 of 69 comparable occupations | Marriage Science analysis of Census ACS 2020 to 2024 PUMS |
| Median rank change after age standardization | 2 places out of 130 | Marriage Science analysis of Census ACS 2020 to 2024 PUMS |
| Highest rate among care occupations | nursing assistants, 35.4 per 1,000 | Marriage Science analysis of Census ACS 2020 to 2024 PUMS |
| Rate among registered nurses | 17.8 per 1,000 | Marriage Science analysis of Census ACS 2020 to 2024 PUMS |
| Rate among police officers | 19.5 per 1,000 | Marriage Science analysis of Census ACS 2020 to 2024 PUMS |
| Rate among physicians | 9.7 per 1,000 | Marriage Science analysis of Census ACS 2020 to 2024 PUMS |
Key Takeaways
- Bartenders divorce at 39.3 per 1,000 married workers a year and farmers and ranchers at 8.7, a 4.5-fold spread across American occupations.
- Pay is the strongest single predictor in the data, at a Spearman correlation of -0.74, with the lowest-paid quarter of occupations divorcing at nearly twice the rate of the highest-paid quarter.
- Age structure explains almost none of it. Standardizing every occupation to the same age distribution moves the median occupation two places out of 130.
- Care work is the outlier the pay story does not fully cover. Nursing assistants, personal care aides and licensed practical nurses all sit in the top five while registered nurses sit near the national average.
- Women divorce more than men in 64 of 69 comparable occupations, and the gap is widest in the occupations that employ the fewest women.
Methodology and Sources
Every figure on this page comes from one file, the American Community Survey 5-year public use microdata sample for 2020 to 2024, pulled from the Census Bureau API and aggregated by us. The code is a single script and the outputs are reproducible from the Census API without a license or a fee.
How We Built the Rate
- Universe: civilians aged 18 to 64, employed at the time of survey, who were married at some point in the preceding 12 months. That is everyone currently married plus everyone who divorced in the past year, which is the population at risk of divorcing.
- Numerator: MARHD, the ACS variable for a divorce in the past 12 months. Annulments and separations are not counted.
- Rate: divorces per 1,000 married workers per year, averaged across the five survey years in the file.
- Occupation: the Census OCCP code recorded at the time of survey, rolled up to the 24 Census occupation families for the group table. See the PUMS documentation and data dictionary.
- Age standardization: direct standardization onto the age distribution of the whole married-worker universe, in bands of 18 to 24, 25 to 34, 35 to 44, 45 to 54 and 55 to 64.
- Reliability floor: we rank an occupation only when it clears 100 unweighted divorces and 2,000 unweighted married workers. Sex-specific comparisons need 50 unweighted divorces on each side.
- Weighting: the ACS person weight PWGTP throughout. See ACS methodology.
- Supporting literature: Killewald, American Sociological Review 2016, McKinnish, Journal of Human Resources 2007, Amato, Journal of Marriage and Family 2010, Ly, Seabury and Jena, BMJ 2015, McCoy and Aamodt, Journal of Police and Criminal Psychology 2010.
Finally, we rerun this analysis whenever the Census Bureau releases the next 5-year PUMS file, which lands each December. More of our original data work sits on the statistics hub.



