


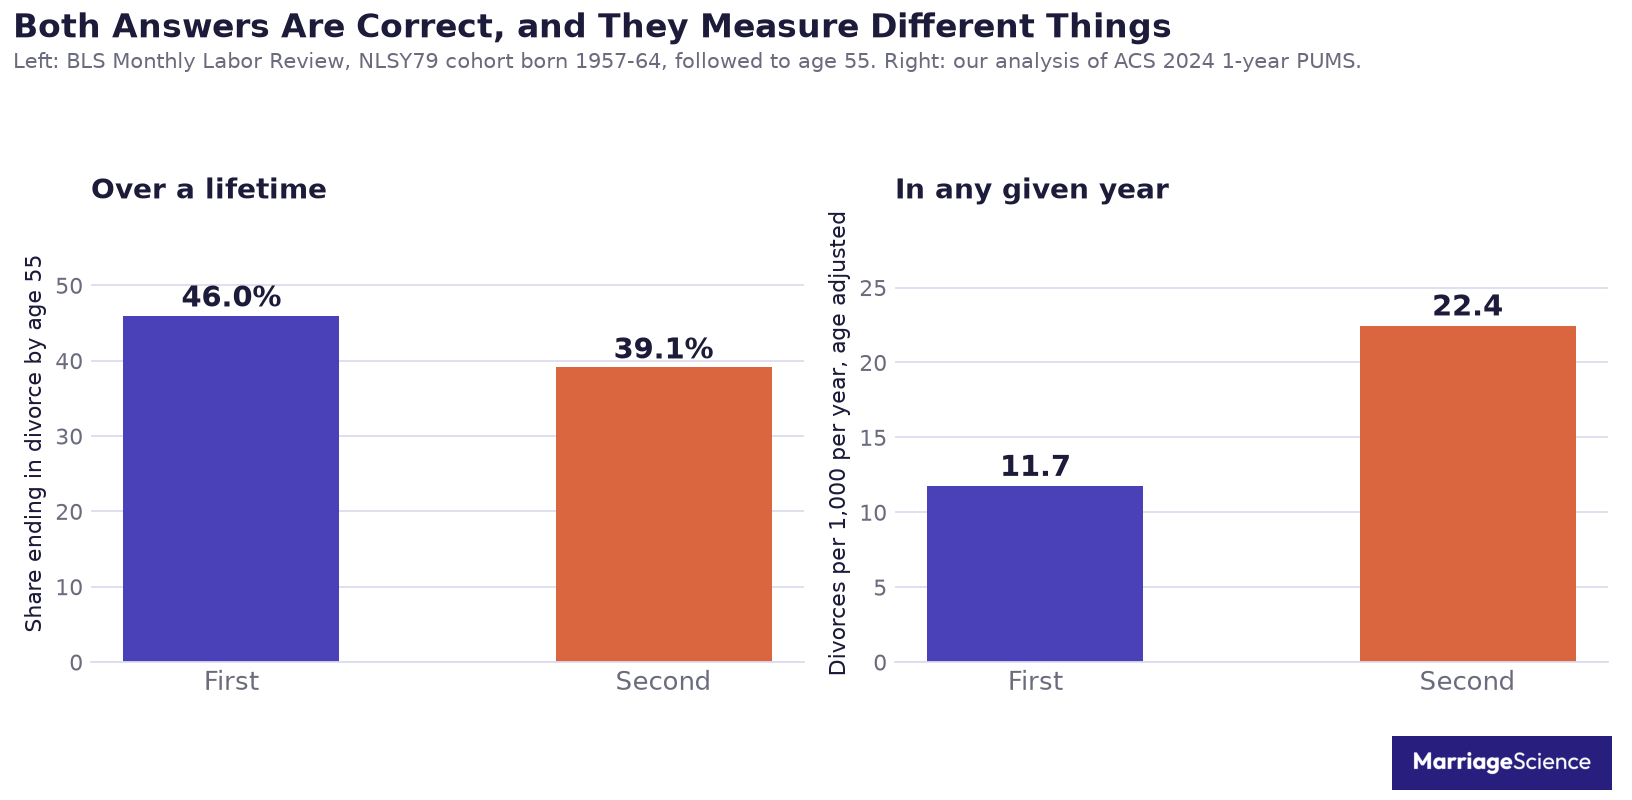
TL;DR: The famous claim that 67% of second marriages end in divorce has no study behind it. The best long-running federal survey puts the real lifetime figure at 39.1%, which is lower than for first marriages, and yet our own Census analysis shows that in any given year a person in a second marriage is about twice as likely to divorce as a person of the same age in a first marriage.
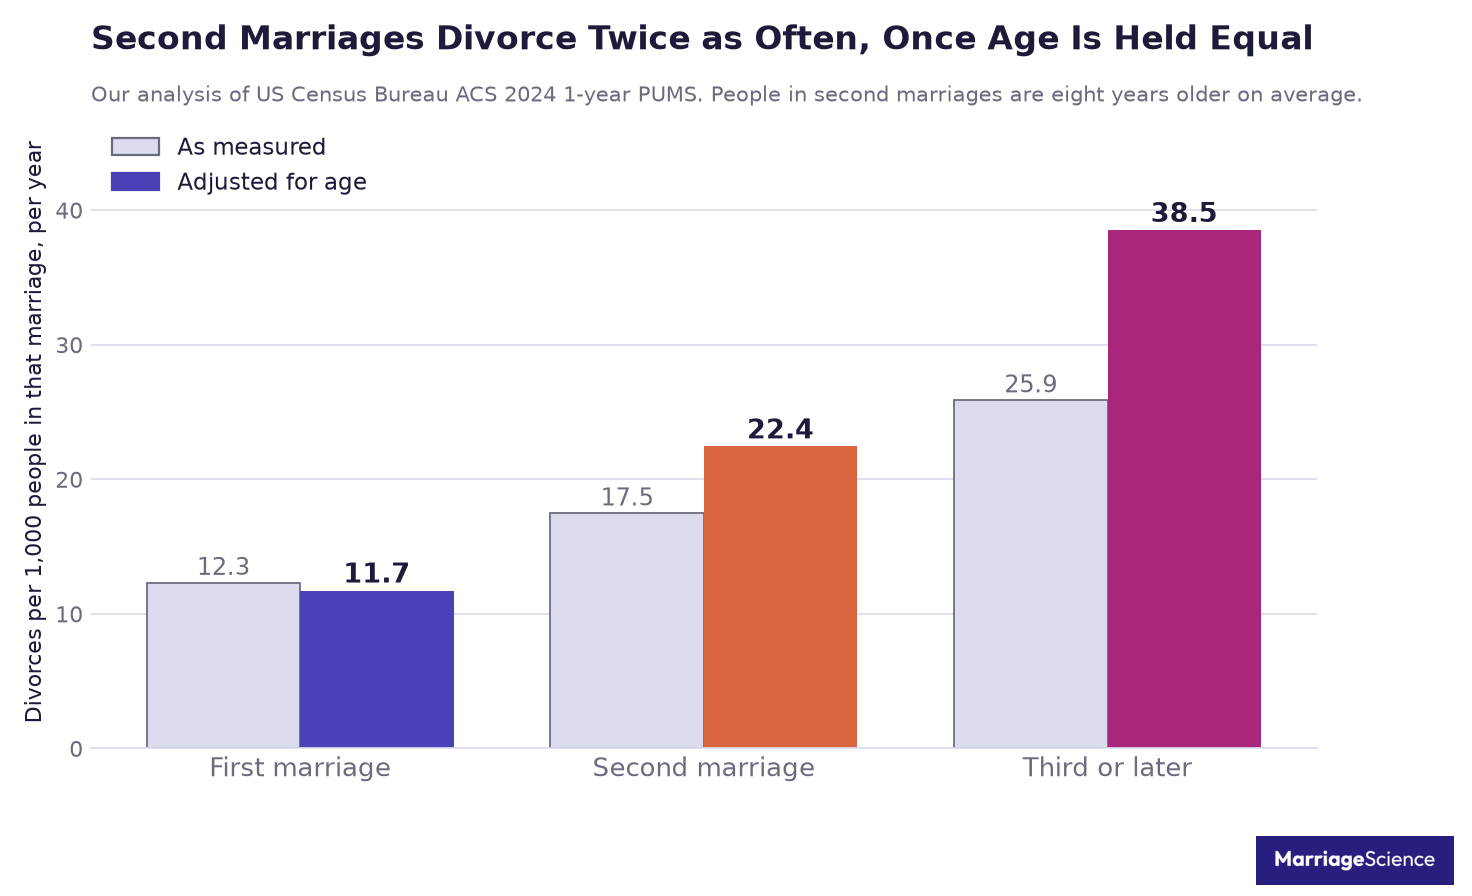
Second marriages end in divorce at 22.4 per 1,000 per year against 11.7 for first marriages, once the two groups are compared at the same ages (our analysis of US Census Bureau, American Community Survey PUMS, 2024).
Without that age adjustment the raw rates are 17.5 and 12.3. People in second marriages are 8.1 years older on average, and annual divorce risk falls steeply with age, so the unadjusted comparison flatters remarriage.
Almost every page you will find on this question quotes one of two numbers. One is 67%, which comes from a 2012 magazine column that cited nobody. The other is 39%, which is real, comes from a federal cohort study, and answers a different question from the one most people are asking.
This article gives you both, explains why they point in opposite directions, and adds a current measurement neither of them provides. We queried the Census Bureau’s microdata directly and computed the annual divorce rate separately for first, second and third marriages, by age, by how long the marriage had lasted, by sex and by education.
Key Second Marriage Statistics
These are the figures worth quoting. Each one names the source it came from, and anything labeled as our analysis was computed here from Census microdata. None of it comes from another site.
- 39.1% of second marriages ended in divorce among Americans born between 1957 and 1964, followed to age 55 (BLS Monthly Labor Review, 2024, Table 4).
- 46.0% of first marriages in the same cohort ended in divorce, so over a lifetime second marriages broke up less often (BLS Monthly Labor Review, 2024).
- Measured year by year it reverses. Second marriages divorce at 22.4 per 1,000 against 11.7 for first marriages at matched ages (our analysis, ACS 2024).
- Third and later marriages divorce at 38.5 per 1,000, roughly 3.3 times the first-marriage rate (our analysis, ACS 2024).
- 414,829 people in second marriages divorced in the past 12 months, out of 23,763,349 in a second marriage (our analysis, ACS 2024).
- 42,957,733 American adults have been married more than once, 23% of everyone who has ever married (our analysis, ACS 2024).
- 22% of people who married in the past year were marrying for at least the second time (our analysis, ACS 2024).
- Second marriages that end do so after a median of 11 years, against 14 years for first marriages (our analysis, ACS 2024).
- In the first five years, second marriages divorce at 41.6 per 1,000 against 11.0 for first marriages, so the gap is not a late-life effect (our analysis, ACS 2020-2024).
- At ages 25 to 34 the second-marriage rate is 43.4 per 1,000 against 18.6 for first marriages (our analysis, ACS 2020-2024).
- The remarriage rate is 34.4 per 1,000 previously married men and 18.5 per 1,000 previously married women, down from 48.9 and 25.2 in 2008 (NCFMR, FP-25-03, 2025).
- The first-marriage divorce rate is 11.5 per 1,000 married men and 13.4 per 1,000 married women (NCFMR, FP-25-02, 2025).
- 66.1% of people remarry after a first divorce, and 52.7% remarry after a second (BLS Monthly Labor Review, 2024, Table 4).
- 42 million Americans had married more than once by 2013, up from 14 million in 1960 (Pew Research Center, 2014).
- People in second marriages are 8.1 years older on average than people in first marriages, 58.6 against 50.5 (our analysis, ACS 2024).
- The 67% figure traces to a 2012 Psychology Today column that credits no study, agency or author for it (verified by reading the article).
Where the 67% Figure Actually Comes From
Search for the second marriage divorce rate and you will meet the same three numbers within the first few results. 50% of first marriages, 67% of second marriages and 73% of third marriages end in divorce.
They appear on therapy practice sites, on law firm blogs, in YouTube titles and in the AI summary Google prints above the results. Almost none of those pages says where the numbers came from.
We followed the trail. It ends at a Psychology Today column published on 6 February 2012 under the title “The High Failure Rate of Second and Third Marriages”. The relevant sentence reads: “Past statistics have shown that in the U.S. 50% of first marriages, 67% of second, and 73% of third marriages end in divorce.”
“Past statistics have shown” is the whole citation. No survey, no agency, no author, no year.
Downstream the numbers picked up a name, Jennifer Baker of the Forest Institute of Professional Psychology in Springfield, Missouri. Two things about that attribution are worth knowing.
The Forest Institute operated from 1979 until 2015 and no longer exists. Verification of its graduates now runs through the Association of State and Provincial Psychology Boards closed program service.
And when TIME asked Baker in 2010 about the divorce statistic attached to her name, she called it “a very murky statistic” and the magazine noted that she is “often erroneously credited” with it. Her comment was about the 50% figure, so it is not a direct disavowal of the 67% one, which makes the point in a different way. The person the internet names as the source of these numbers was on record fifteen years ago saying the number attached to her was murky and not really hers.
We searched for a published study reporting 67% and 73%. There is none.
| Claim | What we found | Source |
| 50% of first marriages end in divorce | Widely repeated, closest real figure is 46.0% for the 1957-64 cohort | BLS Monthly Labor Review, 2024 |
| 67% of second marriages end in divorce | No study found. Traces to an uncited 2012 column | Psychology Today, 2012 |
| 73% of third marriages end in divorce | No study found. Same source, same absence of a citation | Psychology Today, 2012 |
| Attributed to Jennifer Baker, Forest Institute | Institute closed in 2015. Baker called the statistic credited to her “murky” in 2010 | TIME, 24 May 2010 |
What the Best Lifetime Data Says
There is a real answer to the lifetime question, and it comes from the National Longitudinal Survey of Youth 1979. The survey has followed the same Americans, born between 1957 and 1964, since they were teenagers.
The Bureau of Labor Statistics published the marriage and divorce results in September 2024, covering ages 15 to 55 for a sample of 5,766 people.
Among those who remarried after a first divorce, 39.1% saw the second marriage end in divorce too. Among everyone who married at all, 46.0% of first marriages ended in divorce.
So on the measure the 67% claim pretends to use, second marriages did better than first marriages, by seven percentage points.
The same table holds several other figures that rarely make it into roundups. 58.1% of the remarried were still in that second marriage at the end of the study. Two thirds of people whose first marriage ended in divorce, 66.1%, went on to remarry, and they took an average of 4.8 years to do it.
After a second divorce, 52.7% married a third time.
One caveat belongs with all of this, and it is the reason the next section exists. A second marriage in this cohort had fewer years to fail in. It began on average almost five years after the first one ended, so by the time the study closed it had been observed for a shorter period than the first marriage was.
Comparing 39.1% with 46.0% compares two different lengths of exposure.
| Metric | Value | Source |
| First marriages ending in divorce | 46.0% | BLS Monthly Labor Review, 2024, Table 4 |
| Second marriages ending in divorce | 39.1% | BLS Monthly Labor Review, 2024, Table 4 |
| Still in the second marriage at the end of the study | 58.1% | BLS Monthly Labor Review, 2024, Table 4 |
| Remarried after a first divorce | 66.1% | BLS Monthly Labor Review, 2024, Table 4 |
| Average years from first divorce to remarriage | 4.8 | BLS Monthly Labor Review, 2024, Table 4 |
| Married a third time after a second divorce | 52.7% | BLS Monthly Labor Review, 2024, Table 4 |
| Average length of a first marriage that ended | 11.1 years | BLS Monthly Labor Review, 2024, Table 4 |
| Average length of a second marriage that ended | 8.6 years | BLS Monthly Labor Review, 2024, Table 4 |
The Second Marriage Divorce Rate Right Now
A lifetime percentage from a cohort born in the early 1960s tells you what happened to people who married in the 1980s. It cannot tell you the risk facing somebody who remarries this year.
For that you need an annual rate, and nobody publishes one split by marriage order. So we computed it.
The American Community Survey asks every respondent how many times they have been married and whether they divorced in the past 12 months. Put those two answers together across the whole microdata file and you can count, for each marriage order, how many people were in such a marriage and how many of them ended it.
In 2024 there were 106,283,095 Americans in a first marriage and 1,307,534 of them divorced, a rate of 12.3 per 1,000.
There were 23,763,349 in a second marriage and 414,829 divorced, a rate of 17.5.
Third and later marriages ran at 25.9 per 1,000, from 6,136,309 people.
Those raw rates understate the gap, because the three groups are not the same age. The average person in a first marriage is 50.5. In a second marriage it is 58.6, and in a third or later marriage 62.8.
Divorce is overwhelmingly a young and middle-aged event, so a group that skews older will look safer whatever else is true of it.
Standardizing all three to the same age distribution moves the first-marriage rate to 11.7, the second-marriage rate to 22.4 and the third-or-later rate to 38.5. The second-marriage rate is 1.9 times the first, and the third-or-later rate is 3.3 times it.
| Metric | Value | Source |
| People in a first marriage | 106,283,095 | Our analysis, ACS 2024 PUMS |
| People in a second marriage | 23,763,349 | Our analysis, ACS 2024 PUMS |
| People in a third or later marriage | 6,136,309 | Our analysis, ACS 2024 PUMS |
| First-marriage divorce rate, as measured | 12.3 per 1,000 | Our analysis, ACS 2024 PUMS |
| Second-marriage divorce rate, as measured | 17.5 per 1,000 | Our analysis, ACS 2024 PUMS |
| Third or later, as measured | 25.9 per 1,000 | Our analysis, ACS 2024 PUMS |
| First-marriage divorce rate, age adjusted | 11.7 per 1,000 | Our analysis, ACS 2024 PUMS |
| Second-marriage divorce rate, age adjusted | 22.4 per 1,000 | Our analysis, ACS 2024 PUMS |
| Third or later, age adjusted | 38.5 per 1,000 | Our analysis, ACS 2024 PUMS |
Why the Two Answers Point in Opposite Directions
Both findings are correct. They measure different things, and knowing which is which matters before you quote either one.
A lifetime percentage asks what share of marriages eventually break. An annual rate asks how likely a marriage is to break this year.
Second marriages start late. In the federal cohort study the average gap between a first divorce and a remarriage was 4.8 years, and the first marriage itself had usually run for about a decade before that.
Somebody who remarries at 42 has fewer decades of marriage ahead of them than somebody who married for the first time at 25. Fewer years at risk produces a lower lifetime failure percentage even when the yearly danger is higher.
That is the whole reconciliation. Second marriages are riskier per year and shorter in exposure, and those two effects push the lifetime number in opposite directions.
None of this is a discovery of ours. It is a known trap in the literature. The UK’s Marriage Foundation ran the same exercise on commissioned Office for National Statistics data in 2013 and found that British couples where one or both partners were remarrying faced a 31% lifetime divorce risk against 45% where both were marrying for the first time.
Its author, Harry Benson, then wrote the sentence most people quoting the headline have missed. “The present finding is thus an artefact of age. It is not that second marriages do better. It is that couples who marry later, whether first or second time round, do better.”
Our numbers say the same thing about the United States in 2024, with the age adjustment done explicitly instead of left as a caveat.
Second Marriage Divorce Rate by Age
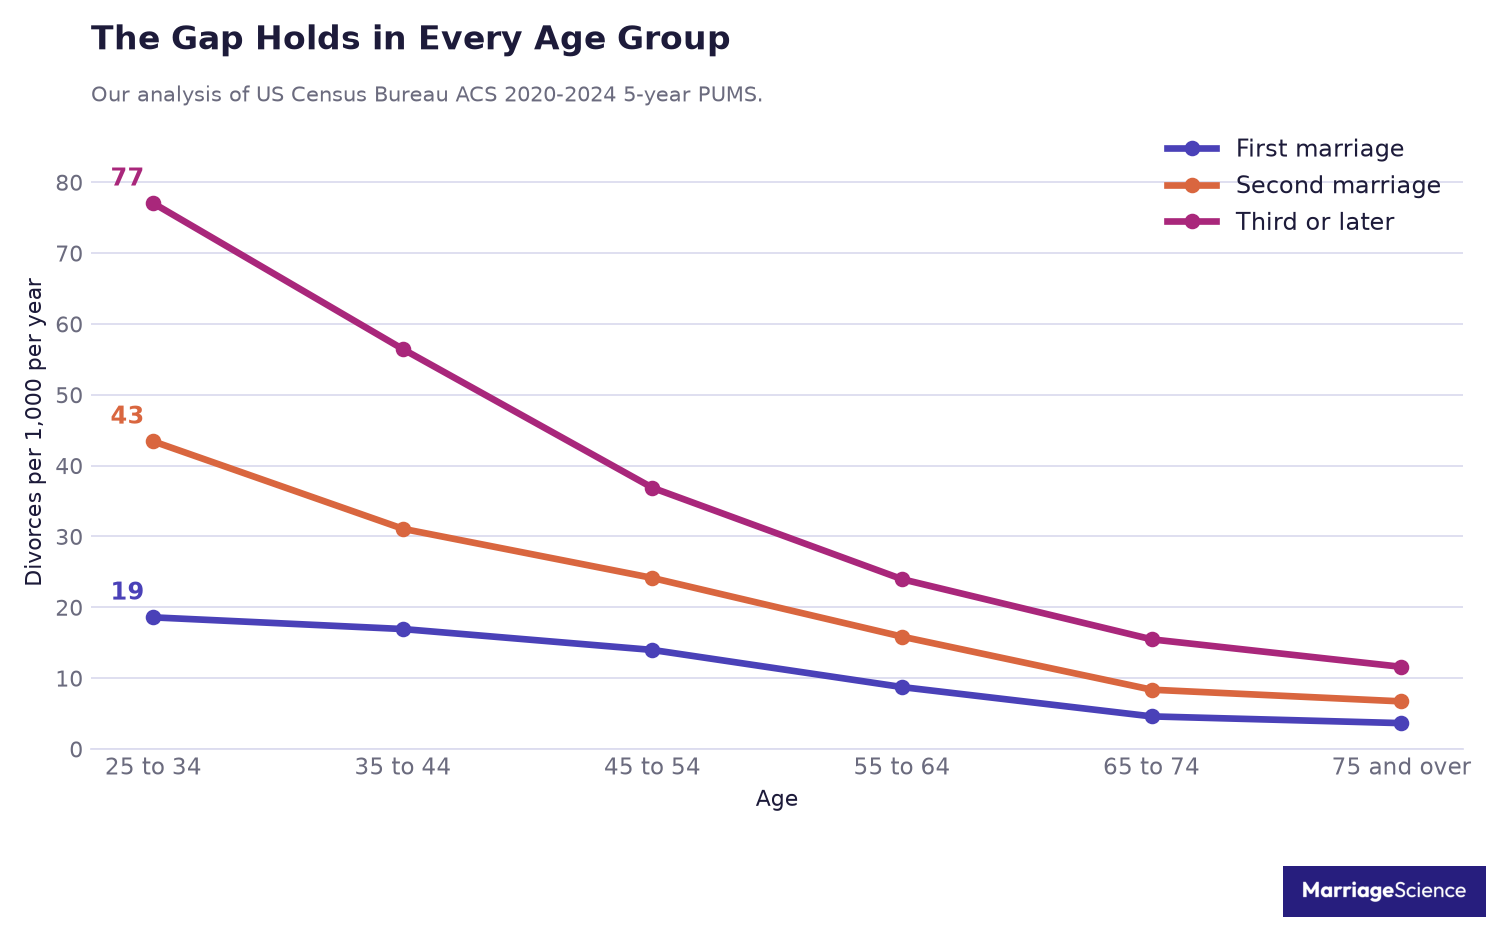
Age adjustment settles the headline. The age breakdown underneath it is more useful, because it tells you where you sit instead of where the average sits.
The pattern is the same in every band. At 25 to 34 the second-marriage rate is 43.4 per 1,000 against 18.6 for first marriages.
At 45 to 54 it is 24.1 against 14.0.
At 65 to 74 both have fallen a long way, to 8.4 and 4.6, and the ratio between them is still there.
Two things follow from that. The gap is not produced by one unusual age group, and it does not disappear among older remarried couples, which is the group most likely to be told that maturity will protect them.
The absolute numbers matter as much as the ratio. 43.4 per 1,000 means that of every hundred second marriages among people in their late twenties and early thirties, about 4 end in any given year. That is a real risk and it is nothing like two thirds of marriages failing.
| Age | First marriage | Second marriage | Third or later |
| 25 to 34 | 18.6 per 1,000 | 43.4 per 1,000 | 77.0 per 1,000 |
| 35 to 44 | 16.9 per 1,000 | 31.1 per 1,000 | 56.4 per 1,000 |
| 45 to 54 | 14.0 per 1,000 | 24.1 per 1,000 | 36.9 per 1,000 |
| 55 to 64 | 8.7 per 1,000 | 15.9 per 1,000 | 24.0 per 1,000 |
| 65 to 74 | 4.6 per 1,000 | 8.4 per 1,000 | 15.5 per 1,000 |
| 75 and over | 3.6 per 1,000 | 6.7 per 1,000 | 11.6 per 1,000 |
Every figure here is an annual risk. Someone who remarries at 30 and stays married will pass through several of these rows, and the danger in each one is lower than in the row above it.
How Long Second Marriages Last
The other question people ask alongside the rate is how long a second marriage runs before it ends. The survey gives the year of the most recent wedding, so for anyone who divorced in the past 12 months we can measure the marriage that just ended.
A first marriage that ended in the past year had lasted a median of 14 years. A second marriage had lasted 11, and a third or later marriage 7.
The people ending them were 43, 51 and 56 years old at the median.
Splitting the annual rate by how long the marriage has lasted is where first and second marriages separate most sharply.
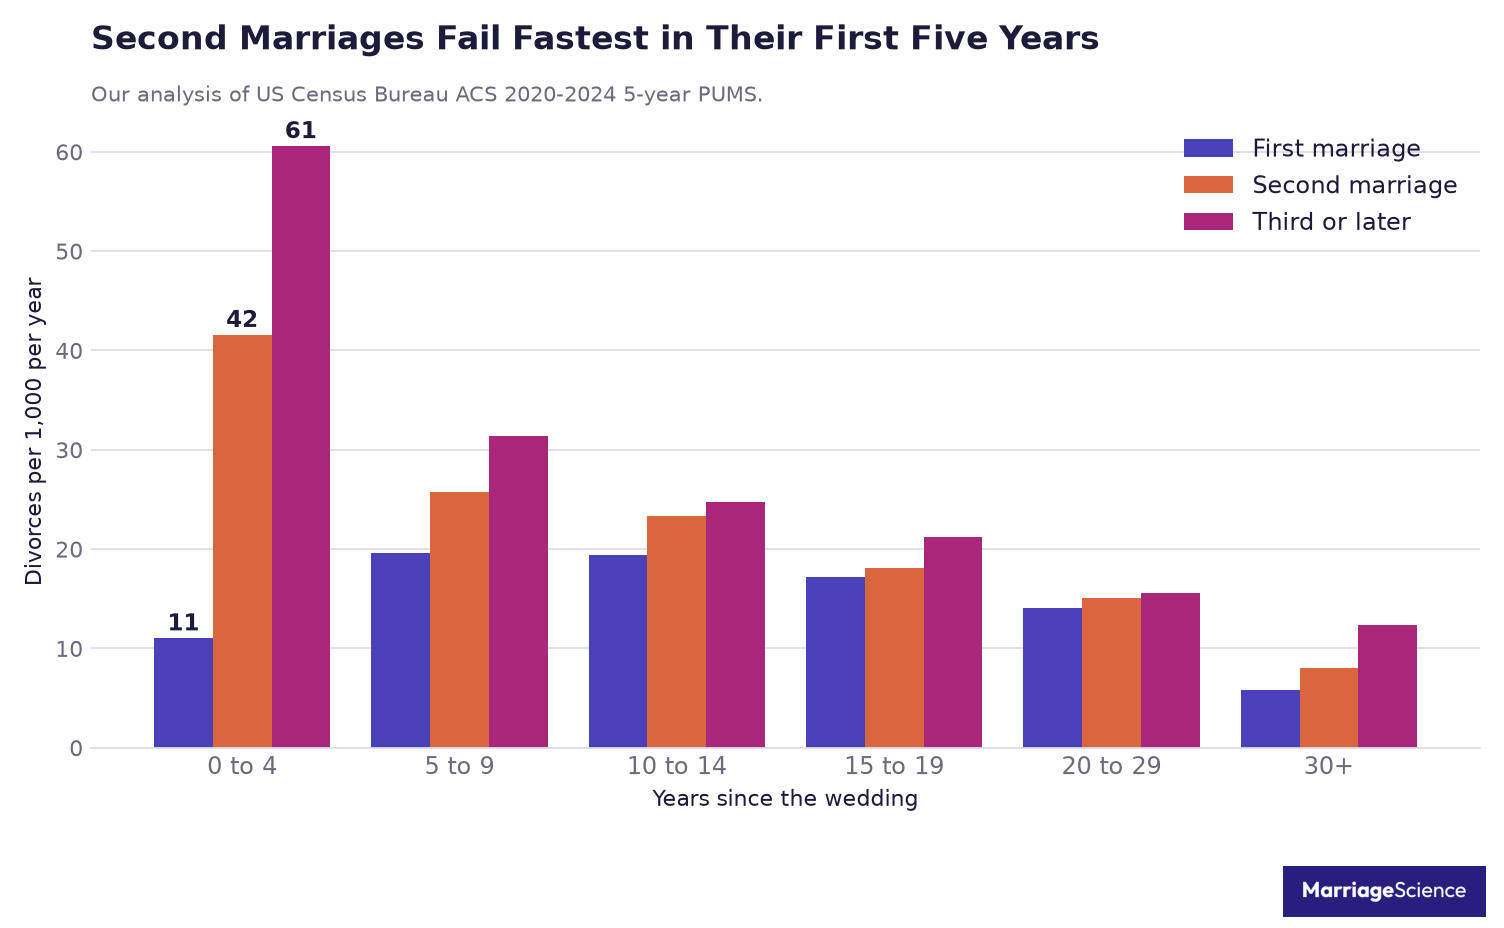
In the first five years, first marriages divorce at 11.0 per 1,000. Second marriages divorce at 41.6, and third or later marriages at 60.6.
The shapes are different, and that is the part worth noticing. A first marriage is at its safest in the opening years and does not peak until years five to nine, when it reaches 19.6.
A second marriage has no such opening. It starts at its most dangerous and falls from there. Whatever protection the first years of a marriage normally provide, a remarriage does not get it.
The early years of a remarriage are the dangerous part. By fifteen to twenty years in, first and second marriages are running at 17.2 and 18.1, less than a point apart.
Third marriages do not catch up in the same way. They are still at 21.3 at that point, and they stay above the other two in every band.
That shape argues against the usual explanation offered on advice pages, which is that remarried people carry unresolved habits from the first marriage and eventually repeat them. If that were the mechanism you would expect the gap to widen with time. It narrows.
| Years married | First | Second | Third or later |
| 0 to 4 years | 11.0 per 1,000 | 41.6 per 1,000 | 60.6 per 1,000 |
| 5 to 9 years | 19.6 per 1,000 | 25.8 per 1,000 | 31.4 per 1,000 |
| 10 to 14 years | 19.4 per 1,000 | 23.3 per 1,000 | 24.7 per 1,000 |
| 15 to 19 years | 17.2 per 1,000 | 18.1 per 1,000 | 21.3 per 1,000 |
| 20 to 29 years | 14.0 per 1,000 | 15.1 per 1,000 | 15.6 per 1,000 |
| 30 years or more | 5.8 per 1,000 | 8.0 per 1,000 | 12.4 per 1,000 |
For more on how long marriages run before they end, our average marriage length analysis covers first marriages in detail.
Third Marriage Divorce Rate
Third marriages get less attention because fewer people have one. They also carry the steepest risk of any group we measured.
6,136,309 Americans were in a third or later marriage in 2024, and 158,665 of them divorced in the year. Age adjusted, that is 38.5 per 1,000 against 11.7 for first marriages.
In the first five years of a third marriage the rate reaches 60.6 per 1,000, the highest of any duration band we measured.
The federal cohort study arrives at the same place from the other direction. Of the people whose second marriage ended in divorce, 52.7% married again, so the pool of third marriages is drawn from people who have already been through two divorces.
The often-quoted 73% for third marriages shares an origin with the 67% for second marriages and has no more evidence behind it. What is defensible is the direction. Each additional marriage carries a higher annual risk than the one before it, and by a wide margin.
| Metric | Value | Source |
| People in a third or later marriage | 6,136,309 | Our analysis, ACS 2024 PUMS |
| Divorces from third or later marriages, past 12 months | 158,665 | Our analysis, ACS 2024 PUMS |
| Age-adjusted annual rate | 38.5 per 1,000 | Our analysis, ACS 2024 PUMS |
| Rate in the first five years | 60.6 per 1,000 | Our analysis, ACS 2020-2024 PUMS |
| Median length of a third marriage that ended | 7 years | Our analysis, ACS 2024 PUMS |
| Share remarrying after a second divorce | 52.7% | BLS Monthly Labor Review, 2024, Table 4 |
| The circulating claim | 73%, no study found | Psychology Today, 2012 |
Men, Women and the Remarriage Gap
Women report more divorces than men in survey data, in first marriages and in remarriages equally. The pattern holds in our figures.
In first marriages the rate is 11.6 per 1,000 for men and 13.1 for women. In second marriages it is 16.4 and 18.6.
Some of that gap is measurement. Divorced men are harder for household surveys to reach, and men under-report a marriage that has ended. The published federal series carries the same asymmetry, with a first-divorce rate of 11.5 per 1,000 married men and 13.4 per 1,000 married women in 2023.
Remarriage runs the other way, and by a much wider margin. Men remarry at 34.4 per 1,000 previously married men, women at 18.5 per 1,000.
Both figures have fallen by close to 30% since 2008, from 48.9 and 25.2. Fewer divorced people are remarrying at all, and the men who do are still doing it at close to twice the rate of women.
Pew found the attitude behind that in survey data. Among divorced or widowed adults, 54% of women said they did not want to remarry against 30% of men.
| Metric | Value | Source |
| First-marriage divorce rate, men | 11.6 per 1,000 | Our analysis, ACS 2024 PUMS |
| First-marriage divorce rate, women | 13.1 per 1,000 | Our analysis, ACS 2024 PUMS |
| Second-marriage divorce rate, men | 16.4 per 1,000 | Our analysis, ACS 2024 PUMS |
| Second-marriage divorce rate, women | 18.6 per 1,000 | Our analysis, ACS 2024 PUMS |
| Remarriage rate, men | 34.4 per 1,000 previously married | NCFMR FP-25-03, 2025 |
| Remarriage rate, women | 18.5 per 1,000 previously married | NCFMR FP-25-03, 2025 |
| Say they do not want to remarry, women | 54% | Pew Research Center, 2014 |
| Say they do not want to remarry, men | 30% | Pew Research Center, 2014 |
A Degree Protects a First Marriage More Than a Second
Education is the strongest single predictor of divorce in a first marriage. It does much less work in a second one, which was the least expected result in this analysis.
Among people in first marriages, those with some college or an associate degree divorce at 15.4 per 1,000 and those with a bachelor’s degree at 9.7. The degree cuts the rate by about a third.
Among people in second marriages the same two groups run at 19.1 and 15.1. The degree still helps, and it helps far less.
Put differently, a graduate in a second marriage carries a higher annual divorce risk than somebody with no degree at all in a first marriage.
The published federal series shows the same gradient inside first marriages, with a first-divorce rate of 8.2 per 1,000 for men holding a master’s degree or more against 15.0 for men with a high school diploma or some college.
The cohort study extends it to remarriages. People with a bachelor’s degree or more saw about 25% of their second marriages end in divorce, against roughly 39% to 45% in every other education group.
That is measured over a lifetime and ours is measured per year, so the two results describe the same gradient from different angles.
| Education | First marriage | Second marriage |
| No high school diploma | 14.0 per 1,000 | 21.1 per 1,000 |
| High school graduate | 14.4 per 1,000 | 17.6 per 1,000 |
| Some college or associate degree | 15.4 per 1,000 | 19.1 per 1,000 |
| Bachelor’s degree | 9.7 per 1,000 | 15.1 per 1,000 |
| Graduate degree | 8.5 per 1,000 | 14.5 per 1,000 |
Our divorce rate by occupation study found the same relationship running through pay instead of schooling, with the lowest-paid quarter of occupations divorcing at nearly twice the rate of the highest-paid quarter.
How Many Americans Are on Their Second Marriage
The rates above describe risk. The counts below describe how large the group is, which is what makes this a mainstream question and no longer a niche one.
42,957,733 American adults have been married more than once. That is 23% of everyone who has ever married.
Of people currently in a marriage, 22% are in a second or later one.
Among people who married in the past 12 months, 22% were marrying for at least the second time, 799,188 for the second and 263,197 for the third or later.
Pew counted the same group a decade ago and found 42 million Americans who had married more than once, up from 22 million in 1980 and 14 million in 1960.
Our own count for 2024 is almost 43 million. The number has barely moved in eleven years while the adult population grew by more than twenty million, so the share of Americans who remarry has been falling even as the raw total held flat.
The rate data says the same thing. The remarriage rate has fallen by close to 30% since 2008, and the longer series is starker still. In 1950 previously married men remarried at 90.9 per 1,000. The rate peaked at 116.5 in 1970 and had fallen to 38.8 by 2017.
Fewer divorced people are trying again, and the ones who do are older when they do it.
| Metric | Value | Source |
| Adults who have married more than once | 42,957,733 | Our analysis, ACS 2024 PUMS |
| Share of ever-married adults | 23% | Our analysis, ACS 2024 PUMS |
| Share of currently married people in a second or later marriage | 22% | Our analysis, ACS 2024 PUMS |
| Share of last year’s weddings that were remarriages | 22% of individuals | Our analysis, ACS 2024 PUMS |
| Currently married adults in a remarriage, 2018 | 23% | NCFMR FP-20-19 |
| Americans married more than once, 2013 | 42 million | Pew Research Center, 2014 |
| Remarriage rate for men, 1970 peak | 116.5 per 1,000 | NCFMR FP-19-17 |
| Remarriage rate for men, 2017 | 38.8 per 1,000 | NCFMR FP-19-17 |
What the Research Says About Why Remarriages Break
Counting divorces is the easy part. Explaining them is where most pages on this topic stop citing anything and start guessing, so it is worth being clear about how much is actually known.
The best evidence comes from a 2013 study in the Journal of Marriage and Family by Sarah Whitton, Scott Stanley, Howard Markman and Christine Johnson, working from a random multistate sample of 1,931 married people.
Its central result is the one that gets left out of advice articles. Remarried adults reported marital quality equal to people in first marriages, on both happiness and conflict, whether or not they had brought children into the marriage.
They were no unhappier. What differed was what they did when they were unhappy.
Remarried people held more positive attitudes toward divorce, and those attitudes predicted divorce proneness, meaning thinking about and taking steps toward divorce. The link between low marital quality and divorce proneness was stronger for the remarried than for anyone else.
In the authors’ reading, remarried adults are more willing to end a marriage that has gone bad, possibly reflecting weaker commitment to the institution itself.
That fits the shape of our own duration data better than the alternative explanations do. Someone who has already been through a divorce knows the process, has survived it, and reaches for it sooner. It also fits the finding that the gap is widest in the first five years and narrows afterwards.
The instability finding itself is old. Booth and Edwards laid it out in the Journal of Family Issues in 1992 under the title “Starting Over: Why Remarriages Are More Unstable”, and the direction has held up across three decades of American data.
Anything more specific than that, including the popular claims about stepchildren, finances or unresolved patterns from the first marriage, is weaker than it sounds. Those factors appear in clinical writing far more often than they appear in a controlled comparison.
What These Numbers Cannot Tell You
A page like this is more useful with its limits stated than with them buried in a methodology note, so here they are.
The survey counts people, not couples. A divorce between two people in second marriages appears twice, once for each of them, which is correct for a per-person risk and wrong if you want to count events.
Marriage order is self-reported and refers to the person answering, so a marriage where one partner is remarrying and the other is not appears in different rows for each of them.
Someone who divorced and remarried inside the same twelve months carries the order of the new marriage, so a small number of divorces are counted one order too high. The group is small enough that removing it would not move the headline.
Age standardization removes the age gap between the groups and nothing else. People who remarry differ from people in first marriages on education, income, health and the simple fact of having divorced before, and none of that is held constant here.
This is a description of who divorces, not a finding about what causes it.
Two things we looked for and did not find are worth naming as well. There is no reliable figure for what share of second marriages that began as affairs end in divorce, despite the question being asked constantly. Every number circulating for it traces back to unsourced blog copy.
And the most-cited real study on remarriage stability, the 2002 National Center for Health Statistics report by Bramlett and Mosher, is built on women aged 15 to 44 interviewed in 1995. It is a serious piece of work and it cannot describe a marriage entered into today.
What This Means If You Are Thinking About Remarrying
Statistics describe groups. Nothing on this page tells you what will happen to a particular marriage, and the honest reading of the numbers is narrower than either the doom figure or the reassuring one.
Three things survive the analysis.
The first is that the 67% claim is not evidence of anything. If a page quotes it at you, that page did not check, and you can discount whatever else it says about the subject.
The second is that a remarriage carries a genuinely higher annual risk than a first marriage at the same age, roughly 1.9 times as high, and that risk is concentrated in the first five years.
Most of the advice literature treats the early period as the settling-in phase and the later years as the test. The data reverses that. A second marriage that reaches its tenth anniversary is running at close to first-marriage risk.
The third is that over a full lifetime, remarriages in the last cohort we can measure end in divorce less often than first marriages did, 39.1% against 46.0%. Both statements are true and they are not in conflict once you know which question each one answers.
If there is a practical reading, it is about timing more than about odds. The risk is front-loaded, and the research that explains it points at how quickly a remarried person moves toward divorce when the marriage goes wrong. Baseline happiness is the same in both groups.
Our wider divorce statistics page covers the national numbers across all marriage orders, and the statistics hub collects the rest of this series.
Methodology and Sources
Everything labeled as our analysis was computed from the Census Bureau’s Public Use Microdata Sample, queried through the Census API. The definitions are written out here so anyone can reproduce them.
Universe. People aged 15 and over who were in a marriage at some point during the 12 months before the survey. That is everyone currently married, plus everyone who divorced in the past 12 months.
Marriage order. The survey variable MARHT, the number of times a person has been married. First marriage, second marriage, third or later.
Rate. Divorces in the past 12 months, from the variable MARHD, per 1,000 people in a marriage of that order.
Age standardization. Direct, in seven age bands, onto the age distribution of the whole at-risk universe. Without it the comparison is biased in favor of remarriage, because people in second marriages are on average 8.1 years older.
Which file. National figures come from the 2024 one-year sample. Breakdowns by age, by marriage duration and by education use the 2020 to 2024 five-year sample, which pools five times as many records and is the only way to get stable numbers for third marriages.
Marriage duration is the survey year minus the year of the most recent marriage, from the variable MARHYP.
External figures come from the sources listed below. Law firm roundups, therapy practice blogs and content-marketing statistics pages were excluded, including every such page on the first results page for this search.
- BLS Monthly Labor Review, 2024. Alison Aughinbaugh and Donna S. Rothstein, “Patterns of marriage and divorce from ages 15 to 55: Evidence from the NLSY79”, September 2024. Cohort born 1957 to 1964, n = 5,766.
- NCFMR Family Profile FP-25-02. Natalie Bankey, “First Divorce Rate, 2023”, 2025.
- NCFMR Family Profile FP-25-03. Natalie Bankey, “Remarriage Rate, 2023”, 2025.
- NCFMR Family Profile FP-20-19. Valerie Schweizer, “First Marriage vs. Remarriage: Demographic Characteristics, 2018”, 2020.
- NCFMR Family Profile FP-19-17. Valerie Schweizer, “The Retreat from Remarriage, 1950-2017”, 2019.
- Pew Research Center. Gretchen Livingston, “Four-in-Ten Couples are Saying ‘I Do,’ Again”, 14 November 2014.
- Marriage Foundation. Harry Benson, “Second marriage. Triumph of decision over hope?”, May 2013. UK data commissioned from the Office for National Statistics.
- Whitton, Stanley, Markman and Johnson, “Attitudes Toward Divorce, Commitment, and Divorce Proneness in First Marriages and Remarriages”, Journal of Marriage and Family 75 (2013), 276 to 287.
- Booth and Edwards, “Starting Over: Why Remarriages Are More Unstable”, Journal of Family Issues 13 (1992), 179 to 194.
- Bramlett and Mosher, “Cohabitation, Marriage, Divorce, and Remarriage in the United States”, National Center for Health Statistics, Vital and Health Statistics Series 23, No. 22, 2002. Cited for context only, since the report itself could not be retrieved.



