

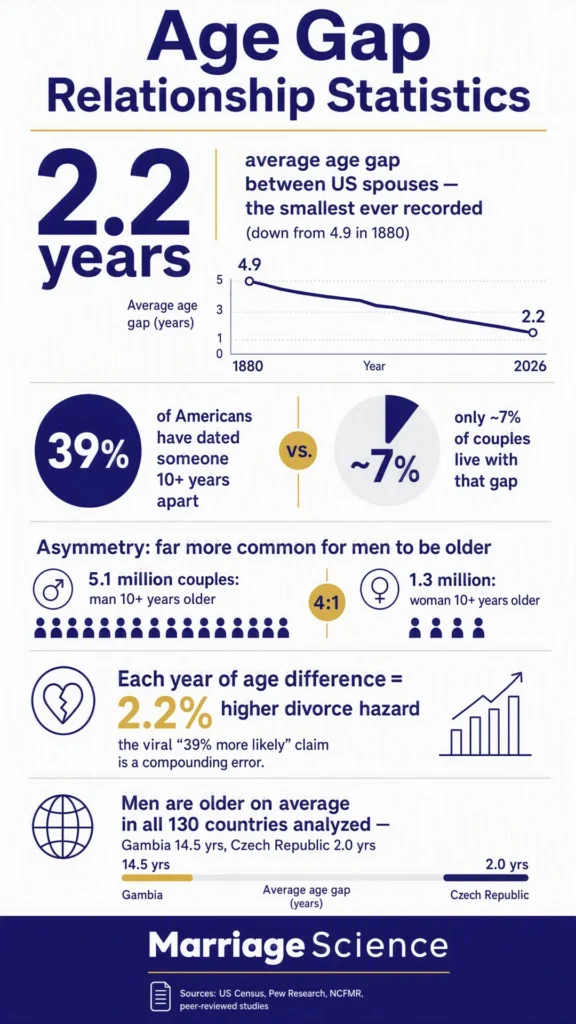
The average age gap between American husbands and wives is 2.2 years, the smallest ever recorded (Pew Research Center, analysis of census and American Community Survey data, August 2024). In 1880 it was 4.9 years.
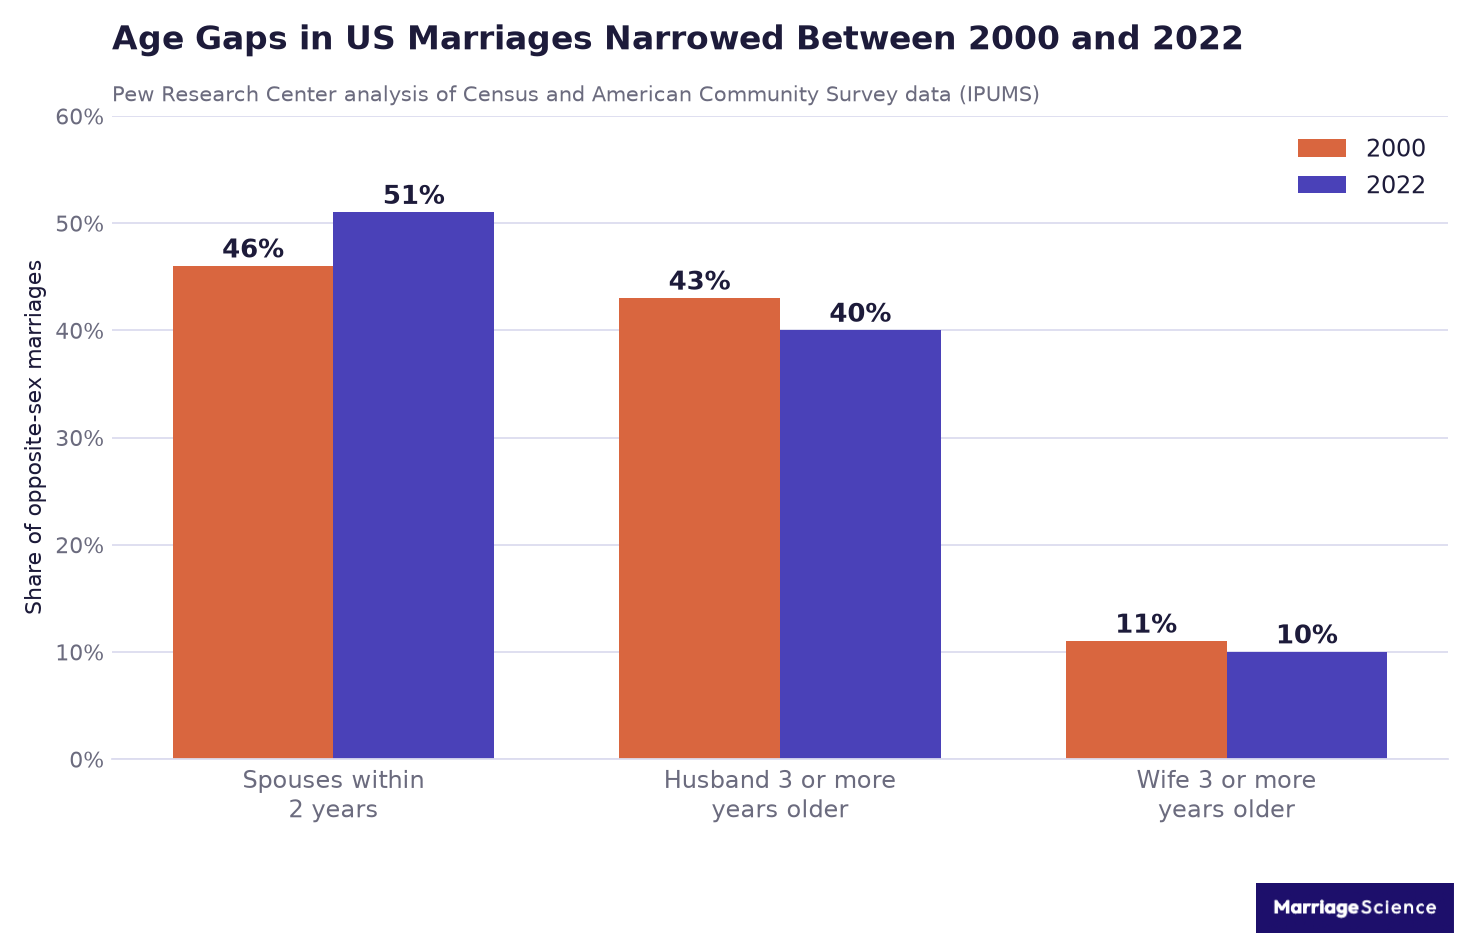
51% of opposite-sex marriages now pair spouses within two years of each other, up from 46% in 2000.
Large gaps stay rare inside marriage and common outside it. In roughly 7% of US opposite-sex couples the man is at least 10 years older, which works out to 5.1 million couples (U.S. Census Bureau, America Counts, April 2026). Yet 39% of American adults say they have dated someone with a 10-year-plus age difference (Ipsos, May 2022).
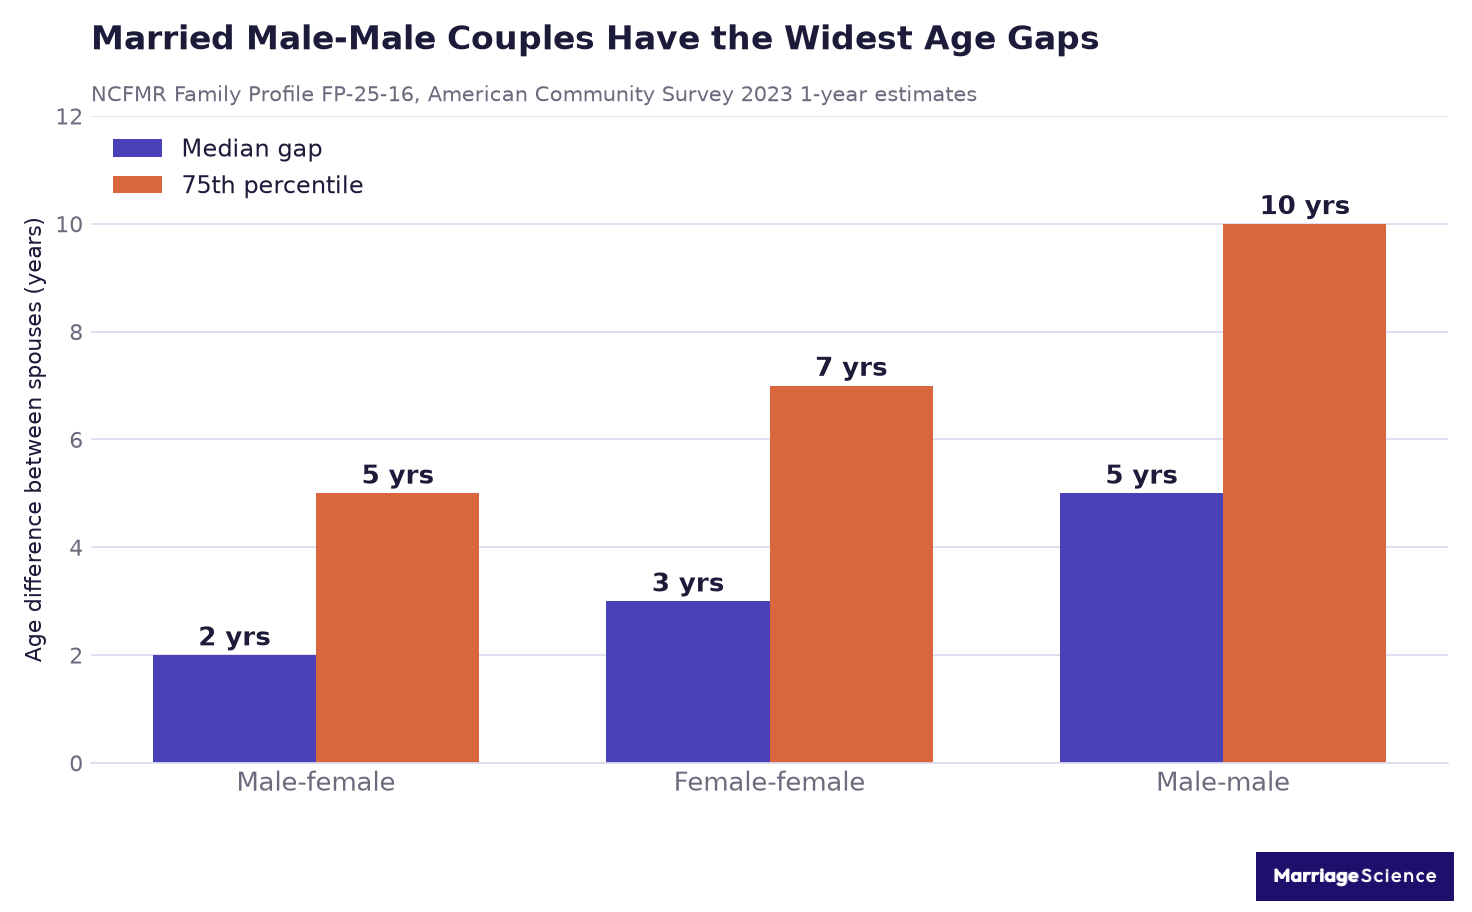
Male-male married couples run the widest gaps of any couple type at a median of 5 years, compared with 2 years for male-female couples (NCFMR, Family Profile FP-25-16, 2025).
We aggregated the age gap relationship statistics on this page from the U.S. Census Bureau, Pew Research Center, the National Center for Family and Marriage Research at Bowling Green State University, and peer-reviewed studies in Demography, Demographic Research, the Journal of Marriage and Family, Economic Inquiry, and the Journal of Population Economics. Where a figure only appears on aggregator pages without a traceable study behind it, we left it out and said so in the methodology.
Key Statistics
- US husbands and wives are 2.2 years apart on average, down from 2.4 years in 2000 and 4.9 years in 1880 (Pew Research Center, August 2024).
- 51% of opposite-sex marriages have spouses within two years of each other, up from 46% in 2000 (Pew Research Center, August 2024).
- The husband is three or more years older in 40% of marriages; the wife is three or more years older in 10% (Pew Research Center, August 2024).
- Partners in more than a third of US opposite-sex couples are within a year of the same age (U.S. Census Bureau, America Counts, April 2026).
- In 5.1 million US couples the man is 10 or more years older, versus 1.3 million where the woman is, a four-to-one asymmetry (U.S. Census Bureau, America Counts, April 2026).
- 13.45% of married man-woman couples have an age gap of eight years or more, compared with 18.54% of cohabiting man-woman couples (Silva and Percheski, Demographic Research, 2024).
- Among marriages where at least one partner had married before, 25.63% carry an eight-year-plus gap, nearly double the rate for all married man-woman couples (Silva and Percheski, Demographic Research, 2024).
- Nearly one in three man-man couples has an eight-year-plus age gap, with no difference between married and cohabiting couples (Silva and Percheski, Demographic Research, 2024).
- 56% of first marriages pair spouses of about the same age, against 32% of remarriages (Pew Research Center, August 2024).
- 39% of US adults have dated someone with an age difference of 10 years or more, and 57% of single adults would be open to dating someone 10-plus years older (Ipsos, May 2022).
- 71% of Americans call it socially acceptable for a man to date someone 10-plus years younger, against 60% for a woman (Ipsos, May 2022).
- Each year that a husband is older cuts the odds he initiates the divorce by 8% and raises the odds his wife does by 5% (England and Allison, Journal of Marriage and Family, 2016).
- Each additional year of spousal age difference carries a 2.2% higher hazard of divorce in a population-weighted model of 3,151 ever-married US adults (Francis and Mialon, Economic Inquiry, 2015).
- Men married to wives seven to nine years younger show 11% lower mortality; women married to husbands seven to nine years younger show 20% higher mortality (Drefahl, Demography, 2010).
- Men were older than their female partners on average in all 130 countries and territories analyzed, from 14.5 years in Gambia to 2.0 years in the Czech Republic (Pew Research Center, January 2020).
- Across 37 samples in 33 countries, men preferred wives 2.66 years younger and women preferred husbands 3.42 years older (Buss, Behavioral and Brain Sciences, 1989).
1. What Is the Average Age Gap Between Married Couples?
Three federal and academic sources report the average age gap between married couples, and none of them measures it the same way, so the headline number moves depending on who you read.
Pew reports the mean of husband’s age minus wife’s age, so wives who are older pull the average down. NCFMR reports the median absolute difference, which ignores direction. The Census Bureau’s 2026 release counts couples inside brackets.
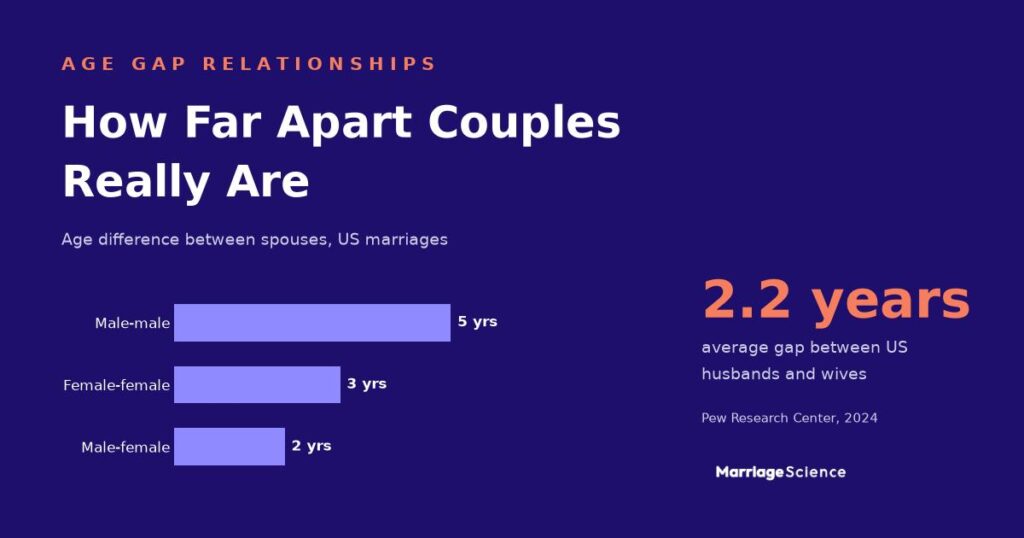
All three land in the same place. The median married male-female couple is two years apart, and 51% of marriages fall inside a two-year gap.
So the “age gap relationship” describes a minority of American unions.
There is also no agreed threshold for where a gap starts counting. Silva and Percheski draw the line at eight years, the Census Bureau publishes brackets at 10, and Ipsos asked its respondents about 10.
Any article quoting a single share for “age gap couples” without naming its threshold is quoting a number that could differ by a factor of two. Broader context on who marries whom is in our marriage statistics roundup.
| Metric | Value | Source |
| Average age gap, US opposite-sex marriages, 2022 | 2.2 years | Pew Research Center, 2024 |
| Marriages with spouses within two years of each other | 51% | Pew Research Center, 2024 |
| Marriages where the husband is three or more years older | 40% | Pew Research Center, 2024 |
| Marriages where the wife is three or more years older | 10% | Pew Research Center, 2024 |
| Opposite-sex couples within one year of the same age, 2025 | More than one third | Census Bureau, America Counts, April 2026 |
| Median absolute age gap, married male-female couples | 2 years | NCFMR FP-25-16, 2025 |
| 25th and 75th percentile gap, married male-female couples | 1 year and 5 years | NCFMR FP-25-16, 2025 |
| Typical gap in the NSFH marriage panel | Husband about 2 years older | England and Allison, JMF, 2016 |
| Marriages analyzed in the Pew estimate (ACS 2022) | About 680,000 | Pew Research Center, 2024 |
Work out your own gap. Enter two birthdays and see where the result sits in this distribution, calculated from Census microdata for 61.2 million married couples: Age Gap Calculator.
2. How US Age Gaps Have Narrowed Since 1880
The gap has been closing for 140 years, and almost all of the movement since 2000 happened in the middle of the distribution.
Marriages with a husband three or more years older fell three points between 2000 and 2022 while same-age marriages gained five. Marriages with an older wife did not grow at all over the same period. That share went from 11% to 10%.
Later marriage and closer educational parity compress the gap by putting couples at similar life stages when they meet. Neither force pushes couples toward older wives.
| Metric | Value | Source |
| Average spousal age gap, 1880 | 4.9 years | Pew Research Center, 2024 |
| Average spousal age gap, 2000 | 2.4 years | Pew Research Center, 2024 |
| Average spousal age gap, 2022 | 2.2 years | Pew Research Center, 2024 |
| Spouses within two years, 2000 to 2022 | 46% to 51% | Pew Research Center, 2024 |
| Husband three or more years older, 2000 to 2022 | 43% to 40% | Pew Research Center, 2024 |
| Wife three or more years older, 2000 to 2022 | 11% to 10% | Pew Research Center, 2024 |
| Marriages with husband eight or more years older, 1960 to 2000 | 12.8% to 9.3% | Mansour and McKinnish, cited in Silva and Percheski, 2024 |
| Marriages with wife eight or more years older, 1960 to 2000 | 1.4% to 2.0% | Mansour and McKinnish, cited in Silva and Percheski, 2024 |
| Median age at first marriage, 2024 | 30.8 years (men), 28.8 years (women) | NCFMR FP-26-01, 2026 |
3. How Common Are Large Age Gaps of 10 Years or More?
Marriage is the most age-matched relationship type Americans form, and every step away from it widens the gap.
Cohabiting man-woman couples are about 38% more likely than married ones to have an eight-year-plus gap (18.54% against 13.45%). Remarriages nearly double the married baseline at 25.63%.
The man is the older partner in four out of five large-gap couples. 5.1 million US couples have a man 10 or more years older, against 1.3 million with a woman 10 or more years older.
Self-reported dating history runs far above any of the household counts, because a decade-wide gap is something many people try once and few people marry into. That distinction gets lost whenever a survey number and a Census number appear in the same sentence.
Two mechanisms produce that asymmetry. Second and third marriages carry wide gaps at twice the rate of first marriages, and men remarry more often and later than women do.
The second mechanism is preference. Antfolk’s Finnish respondents and the 28-country SHARE sample both show men’s target partner age flattening in their twenties while their own age keeps rising. The gap opens one year at a time. You can work out your own gap against the same distribution.
| Metric | Value | Source |
| Opposite-sex couples where the man is 10 or more years older, 2025 | About 7% (5.1 million couples) | Census Bureau, America Counts, April 2026 |
| Couples where the woman is 10 or more years older, 2025 | 1.3 million couples | Census Bureau, America Counts, April 2026 |
| Married man-woman couples with an eight-year-plus gap | 13.45% | Silva and Percheski, Demographic Research, 2024 |
| Cohabiting man-woman couples with an eight-year-plus gap | 18.54% | Silva and Percheski, Demographic Research, 2024 |
| Married man-woman couples where the wife is eight or more years older | 2.14% | Silva and Percheski, Demographic Research, 2024 |
| Cohabiting man-woman couples where the woman is eight or more years older | 4.59% | Silva and Percheski, Demographic Research, 2024 |
| Marriages with at least one previously married partner, eight-year-plus gap | 25.63% | Silva and Percheski, Demographic Research, 2024 |
| US adults who have dated someone with a 10-year-plus age difference | 39% | Ipsos, May 2022 |
| Dated someone 10-plus years younger, men against women | 25% against 14% | Ipsos, May 2022 |
| Dated someone 10-plus years older, women against men | 28% against 21% | Ipsos, May 2022 |
4. Age Gaps in Same-Sex and Cohabiting Couples
Same-sex couples were left out of national age-gap statistics until the ACS began identifying them, and the numbers that came back broke the pattern that different-sex data had established.
Married male-male couples have a median age gap of 5 years and a 75th percentile of 10 years, so one married male-male couple in four is at least a decade apart. For married male-female couples that same 75th percentile is 5 years.
Marriage does not compress male-male gaps the way it compresses different-sex gaps. Silva and Percheski found no difference in age heterogamy between married and cohabiting man-man couples, while the married and cohabiting difference for man-woman couples ran five percentage points.
| Metric | Value | Source |
| Median age gap, married male-male couples | 5 years | NCFMR FP-25-16, 2025 |
| Median age gap, married female-female couples | 3 years | NCFMR FP-25-16, 2025 |
| 75th percentile age gap, married male-male couples | 10 years | NCFMR FP-25-16, 2025 |
| Median age gap, cohabiting male-male couples | 4 years | NCFMR FP-25-16, 2025 |
| Man-man couples with an eight-year-plus gap | Nearly one in three, married and cohabiting | Silva and Percheski, Demographic Research, 2024 |
| Married man-man couples, wed 2015 or later against pre-2015 | 35.77% against 30.04% age heterogamous | Silva and Percheski, Demographic Research, 2024 |
| Married and cohabiting woman-woman couples with an eight-year-plus gap | 23.23% and 22.15% | Silva and Percheski, Demographic Research, 2024 |
| Man-man marriages where one partner married before | 43.47% age heterogamous | Silva and Percheski, Demographic Research, 2024 |
| Same-sex couple households, 2023 | 1.3 million (774,000 married) | NCFMR FP-25-16, 2025 |
5. Age Disparity in Sexual Relationships and Dating Preferences
Research on age disparity in sexual relationships measures two separate things: the partner age people say they would consider, and the age of the partners they report having had.
What people say they want runs wider than who they actually pair with, and the distance between the two grows with age.
Buss found a preferred gap of under three years in both directions back in 1989, close to what married couples show today. The wider figures come from two later studies that tracked how preferences move as people age.
Men at 25 prefer a partner about 3 years younger, and men at 50 prefer one about 8 years younger. The preferred partner age barely moves while their own keeps rising (Gottfried and colleagues, Personal Relationships, 2024, from 35,996 SHARE respondents across 28 European countries).
Antfolk found the same pattern from the other direction in a Finnish sample of 2,655 adults: men of every age reported interest in women in their twenties, while women of every age reported interest in slightly older men.
Preference data has one hard limit. What people accept in a survey is wider than what they pursue, and what they pursue is wider than who they end up living with. Household data only sees that last stage.
Messaging behavior shows the same asymmetry from the demand side. Bruch and Newman found that women’s desirability on a dating site peaked at 18 and fell through age 60, while men’s peaked around 50. Platform-level behavior differences are covered in our guide to the best dating sites.
| Metric | Value | Source |
| Preferred age difference, men (37 samples, 33 countries, N = 10,047) | 2.66 years younger | Buss, Behavioral and Brain Sciences, 1989 |
| Preferred age difference, women | 3.42 years older | Buss, Behavioral and Brain Sciences, 1989 |
| Men’s preferred sexual partner age, all ages of respondent | Women in their twenties | Antfolk, Evolutionary Psychology, 2017 |
| Women’s preferred sexual partner age, all ages of respondent | Slightly older men | Antfolk, Evolutionary Psychology, 2017 |
| Preferred gap for men aged 25 and men aged 50 | 3 years younger and 8 years younger | Gottfried et al., Personal Relationships, 2024 |
| Preferred gap for women after age 60 | Narrows to roughly zero | Gottfried et al., Personal Relationships, 2024 |
| Online dating desirability peak, women and men | Age 18 and about age 50 | Bruch and Newman, Science Advances, 2018 |
| Single adults open to dating someone 10-plus years older or younger | 57% and 49% | Ipsos, May 2022 |
| Say it is acceptable for a man against a woman to date 10-plus years younger | 71% against 60% | Ipsos, May 2022 |
6. Age Gap Relationships Around the World
The direction of the gap has no exceptions in the published record. Men were older than their female partners on average in every one of the 130 countries and territories Pew analyzed, and in every one of the 89 countries Feng and Ren studied.
Gambia records 14.5 years and the Czech Republic 2.0, a sevenfold spread between the widest and narrowest national gaps. The United States is near the bottom of that range at 2.2.
Religion tracks the same gradient as income, and inside a single country it can outweigh the national average. Christian men in Nigeria are 9.2 years older than their partners on average, Muslim men 13.0 years.
Those numbers are moving. Sub-Saharan Africa still has the widest gaps on the planet, and it has closed two years of them since the early 1980s, from 9.3 to 7.3.
Women’s median age at first marriage across the region rose from 16.5 to 20.7 over the same period, while men’s rose 2.3 years.
Development narrows the gap without reversing it. No country in either data set has crossed over to wives who are older on average.
| Metric | Value | Source |
| Countries and territories where men are older on average | All 130 analyzed | Pew Research Center, January 2020 |
| Widest national gaps: Gambia, Guinea, Mali | 14.5, 13.5 and 12.9 years | Pew Research Center, January 2020 |
| Narrowest national gaps: Czech Republic, Slovakia, Estonia | 2.0, 2.1 and 2.2 years | Pew Research Center, January 2020 |
| United States and China | 2.2 years each | Pew Research Center, January 2020 |
| Gap by religion: Muslims, Hindus, Christians | 6.6, 5.6 and 3.8 years | Pew Research Center, January 2020 |
| Gap by religion: Buddhists, unaffiliated, Jews | 2.9, 2.3 and 2.1 years | Pew Research Center, January 2020 |
| Nigeria, Christian men against Muslim men | 9.2 against 13.0 years older | Pew Research Center, January 2020 |
| Sub-Saharan Africa, early 1980s to late 2010s | 9.3 years to 7.3 years | Kyei et al., Journal of Biosocial Science, 2025 |
| Relationship between national gap and GDP per capita, 89 countries | Negative and significant | Feng and Ren, Economics Letters, 2022 |
7. Divorce Risk, Satisfaction, and Mortality in Age Gap Relationships
Four bodies of research have tested age gaps against outcomes: divorce initiation, divorce hazard, marital satisfaction, and mortality.
England and Allison had the only US longitudinal data on which spouse wanted the breakup. In their models the younger partner is the one more likely to leave, whichever sex that partner happens to be.
Each year the husband is older cuts the odds he initiates by 8% and raises the odds his wife initiates by 5%.
Where a wife was more than three years older, the odds of a husband-initiated divorce ran 1.87 times the same-age reference group.
The claim that a 10-year gap makes divorce 39% more likely, repeated across blog and law-firm roundups, comes from compounding a per-year hazard ratio. Francis and Mialon reported 1.034 per year in their recently married subsample, and 1.034 raised to the power of 10 gives 1.40.
The honest version is the per-year figure, and in their full model that was 1.022.
Satisfaction data gets closer to the mechanism. Lee and McKinnish tracked Australian couples for 13 years, and husbands with younger wives started out more satisfied and then declined faster. The advantage was gone within 6 to 10 years of marriage.
Couples with a gap also absorbed negative income shocks worse than similarly aged couples did.
Mortality is the one outcome where the gap helps one partner and hurts the other. Our divorce statistics page covers the other risk factors these models control for.
| Metric | Value | Source |
| Odds husband initiates divorce, per year he is older | 8% lower (OR 0.92) | England and Allison, JMF, 2016 |
| Odds wife initiates divorce, per year her husband is older | 5% higher (OR 1.05) | England and Allison, JMF, 2016 |
| Husband-initiated divorce when the wife is more than three years older | 1.87 times the same-age reference | England and Allison, JMF, 2016 |
| Husband-initiated divorce when the wife is more than three years younger | 0.50 times the same-age reference | England and Allison, JMF, 2016 |
| Hazard of divorce per additional year of age difference, full model | 2.2% higher (HR 1.022) | Francis and Mialon, Economic Inquiry, 2015 |
| Same figure for men only, and for the recently married subsample | 4.1% and 3.4% per year | Francis and Mialon, Economic Inquiry, 2015 |
| Husband’s marital satisfaction, per year his wife is younger or older | +0.031 and -0.044 points | Lee and McKinnish, J Population Economics, 2018 |
| Years until the initial satisfaction advantage disappears | 6 to 10 | Lee and McKinnish, J Population Economics, 2018 |
| Mortality risk, husband seven to nine years older than his wife | 11% lower than same-age couples | Drefahl, Demography, 2010 |
| Mortality risk, woman married to a man seven to nine years younger | 20% higher than same-age couples | Drefahl, Demography, 2010 |
One caveat carries across all four literatures. Age-gap couples differ from same-age couples on remarriage rates, education gaps, and income gaps, and no observational model separates the gap itself from what tends to come with it.
Part of the effect looks cultural. Corti and colleagues found that couples with an older wife faced a higher separation risk in 1970s Italian marriages, and no measurable penalty by the 1990s cohort.
Age Gap Relationships by the Numbers
| Metric | Value | Source |
| Average US spousal age gap, 2022 | 2.2 years | Pew Research Center, 2024 |
| Average US spousal age gap, 1880 | 4.9 years | Pew Research Center, 2024 |
| Marriages with spouses within two years | 51% | Pew Research Center, 2024 |
| Husband three or more years older | 40% | Pew Research Center, 2024 |
| Wife three or more years older | 10% | Pew Research Center, 2024 |
| Same-age share, first marriages against remarriages | 56% against 32% | Pew Research Center, 2024 |
| Same-age share by education, bachelor’s degree or higher against some college or less | 55% against 48% | Pew Research Center, 2024 |
| Opposite-sex couples where the man is 10-plus years older | About 7% (5.1 million) | Census Bureau, April 2026 |
| Couples where the woman is 10-plus years older | 1.3 million | Census Bureau, April 2026 |
| Married man-woman couples with an eight-year-plus gap | 13.45% | Silva and Percheski, 2024 |
| Cohabiting man-woman couples with an eight-year-plus gap | 18.54% | Silva and Percheski, 2024 |
| Marriages with a previously married partner, eight-year-plus gap | 25.63% | Silva and Percheski, 2024 |
| Man-man couples with an eight-year-plus gap | Nearly one in three | Silva and Percheski, 2024 |
| Median age gap, married male-male couples | 5 years | NCFMR FP-25-16, 2025 |
| US adults who have dated someone 10-plus years apart in age | 39% | Ipsos, May 2022 |
| Acceptability of a 10-plus year gap, man older against woman older | 71% against 60% | Ipsos, May 2022 |
| Odds shift in divorce initiation, per year the husband is older | 8% lower for him, 5% higher for her | England and Allison, 2016 |
| Divorce hazard per additional year of age difference | 2.2% higher | Francis and Mialon, 2015 |
| Years until the satisfaction advantage of a younger spouse disappears | 6 to 10 | Lee and McKinnish, 2018 |
| Widest and narrowest national gaps | 14.5 years (Gambia), 2.0 years (Czech Republic) | Pew Research Center, 2020 |
Methodology and Sources
Every figure on this page comes from a government dataset, a peer-reviewed study, or a polling firm that publishes its methodology. Sources appear below with the exact report behind each number.
- Pew Research Center, “A growing share of U.S. husbands and wives are roughly the same age,” August 2024. Analysis of decennial census and ACS 2022 microdata via IPUMS for about 680,000 coresident opposite-sex marriages.
- U.S. Census Bureau, America Counts, “Over a Third of Partners in Opposite-Sex Couples Were the Same Age,” April 2026. Current Population Survey Annual Social and Economic Supplement, 2025.
- NCFMR at Bowling Green State University, Family Profile FP-25-16, “Age Composition of Same-sex and Different-sex Couples, 2023,” and FP-26-01 on age at first marriage. ACS 2023 1-year estimates via IPUMS.
- Silva, T. and Percheski, C. (2024). “Age-heterogamous partnerships: Prevalence and partner differences by marital status and gender composition.” Demographic Research 50(23): 625 to 642. ACS 2017 to 2021, 3.3 million couples.
- England, P. and Allison, P. D. (2016). “Is Your Spouse More Likely to Divorce You if You Are the Older Partner?” Journal of Marriage and Family 78(5). National Survey of Families and Households, 3,622 couples, 747 breakups.
- Francis-Tan, A. and Mialon, H. M. (2015). “A Diamond is Forever and Other Fairy Tales.” Economic Inquiry 53(4): 1919 to 1930. Population-weighted Cox models on 3,151 ever-married US adults.
- Lee, W. S. and McKinnish, T. (2018). “The marital satisfaction of differently aged couples.” Journal of Population Economics 31: 337 to 362. HILDA panel, 2001 to 2013.
- Drefahl, S. (2010). “How does the age gap between partners affect their survival?” Demography 47(2): 313 to 326. Danish register data on almost two million married people from 1990 onward.
- Corti, G., Bellani, D., Guarneri, A. and Rinesi, F. (2024). “Partners’ Age Difference and Marital Dissolution in Italy.” Comparative Population Studies 49: 337 to 370. Istat “Families, social subjects and life cycle” survey, 2016.
- Pew Research Center, “Globally, women are younger than their male partners, more likely to age alone,” January 2020, from the 2019 report on religion and living arrangements covering 130 countries and territories.
- Feng, S. and Ren, Y. (2022). “Within marriage age gap across countries.” Economics Letters 210. Micro data from 89 countries.
- Kyei, P., Agyei-Mensah, S., Casterline, J. and Bawah, A. (2025). Journal of Biosocial Science. 144 nationally representative surveys across 34 sub-Saharan African countries, 1980 to 2020.
- Buss, D. M. (1989). Behavioral and Brain Sciences 12: 1 to 14. 37 samples, 33 countries, N = 10,047.
- Antfolk, J. (2017). “Age Limits: Men’s and Women’s Youngest and Oldest Considered and Actual Sex Partners.” Evolutionary Psychology 15(1). Population-based sample of 2,655 adults aged 18 to 50.
- Gottfried, J. and colleagues (2024). Personal Relationships 31(4): 987 to 1000. 35,996 respondents in 28 countries from the Survey of Health, Ageing and Retirement in Europe.
- Bruch, E. E. and Newman, M. E. J. (2018). “Aspirational pursuit of mates in online dating markets.” Science Advances 4(8). Messaging data from four US cities, January 2014.
- Ipsos, poll conducted for Cougar Life, May 5 to 6, 2022. Online sample of 1,005 US adults aged 18 and over.
Three definitions of the age gap appear on this page and none of them is interchangeable with another. Pew reports a signed mean, so older wives offset older husbands. NCFMR reports a median absolute difference. Silva and Percheski define age heterogamy as a difference of eight years or more in either direction.
Household surveys count couples who live together, so they undercount dating relationships and any couple living apart. Poll figures on dating history come from self-report and cover a lifetime, so they run an order of magnitude above the household shares.
Two recency flags. The mortality evidence rests on Drefahl’s 2010 Danish register analysis, the most recent population-scale study of spousal age gaps and survival we could verify. The satisfaction evidence ends with HILDA wave 2013.
The Francis and Mialon sample was recruited online through Amazon Mechanical Turk and weighted to ever-married adults, so it is not a probability sample of US marriages. We report its per-year hazard ratios and avoid the compounded versions that circulate as standalone statistics.
Numbers we found only on aggregator and law-firm pages were dropped, including the widely repeated claim that 8% of US married couples have a gap of 10 years or more. The Census Bureau’s own figure for a 10-year-plus gap with the man older is about 7%, and no primary source we located reports the two-sided 8%.
NSFG data on age differences between adolescent girls and their sexual partners was excluded because the most-cited estimates come from the 1995 survey cycle and are 30 years old.
We update this page annually as new ACS vintages, NCFMR family profiles, and CPS supplements are released. More research is in our relationship and dating statistics hub.



