


TL;DR: Half of everyone who has ever used a dating app has been in a committed relationship with someone they met on one. That is the closest thing to an online dating success rate that a probability sample supports, and it is far higher than the figures that circulate on social media.
50% of US adults who have ever used a dating site or app say they have at some point been in a committed relationship with someone they met there (SSRS Opinion Panel Omnibus, January 2026, 2,012 adults, margin of error 2.5 percentage points).
Two years earlier the same poll put it at 42%. The measure is moving, and it is moving up.
What almost nobody agrees on is whether those relationships turn out well. Three serious studies have asked, and they reached three different answers, one of which was paid for by a dating company.
Everything below comes from probability-based polling, from peer-reviewed research, or from Match Group’s own filings with the SEC. Where a widely repeated number could not be traced to a primary source, it is not on this page, and we name it near the end so you can recognize it elsewhere.
Key Online Dating Success Rate Statistics
- 50% of ever-users have had a committed relationship with an app match (SSRS, January 2026, 2,012 US adults).
- That figure was 42% in January 2024, an eight point rise across two waves of the same poll (SSRS, January 2024, 2,011 adults).
- 37% of US adults have ever used a dating site or app and 6% are using one now (SSRS, January 2026).
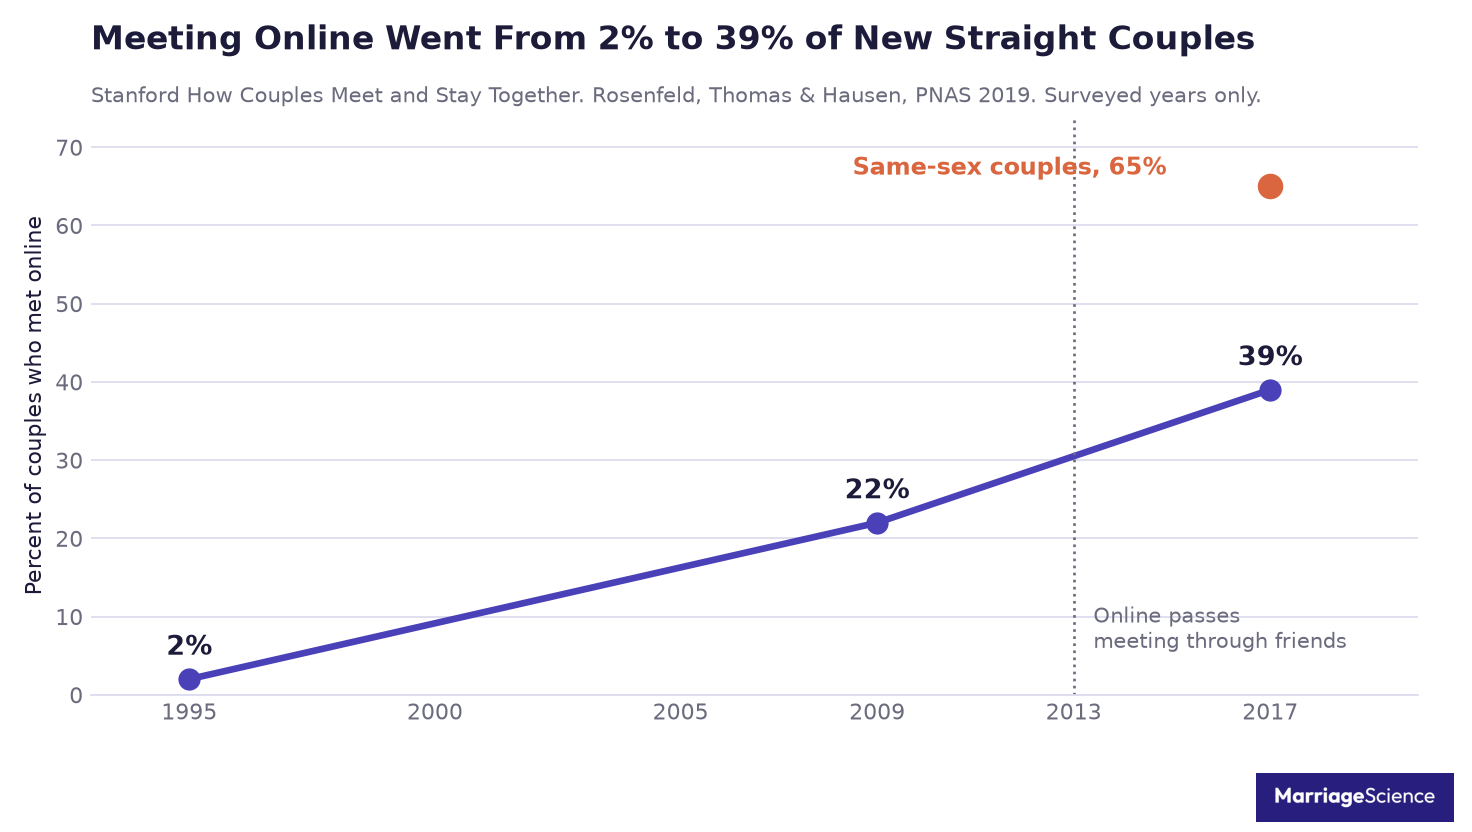
- 39% of heterosexual couples met online by the 2017 survey wave, up from 2% in 1995 (Rosenfeld, Thomas and Hausen, PNAS 2019).
- 65% of recently formed same-sex couples met online in the same data (Rosenfeld and colleagues, 2019).
- 10% of partnered US adults met their current partner on an app, rising to 20% of partnered adults under 30 (Pew Research Center, 2023, fielded July 2022, 6,034 adults).
- 58% of Americans think relationships that start online are just as successful as those that start in person, 37% think they are less successful and 5% think they are more (SSRS, January 2026).
- Reply rates never rise above 21% for messages sent to more desirable partners in a study of four US dating markets (Bruch and Newman, Science Advances 2018).
- Both men and women message people about 25% more desirable than themselves, which is the main reason those reply rates stay low (Bruch and Newman, 2018).
- Users earning $75,000 or more report a committed relationship 58% of the time, against 44% for users earning under $50,000 (SSRS, January 2026).
- 63% of LGBTQIA+ adults have used a dating app, against 34% of everyone else (SSRS, January 2026).
- 58% of people who have paid rate the experience positively, against 50% of those who never paid (Pew Research Center, 2023).
- More than one third of US marriages between 2005 and 2012 began online (Cacioppo and colleagues, PNAS 2013, 19,131 married respondents).
- A 2024 replication found the opposite of that paper, with online meeting marginally linked to less relationship success among married people (Hu, Zhu and Zhang, Cyberpsychology, Behavior, and Social Networking 2024).
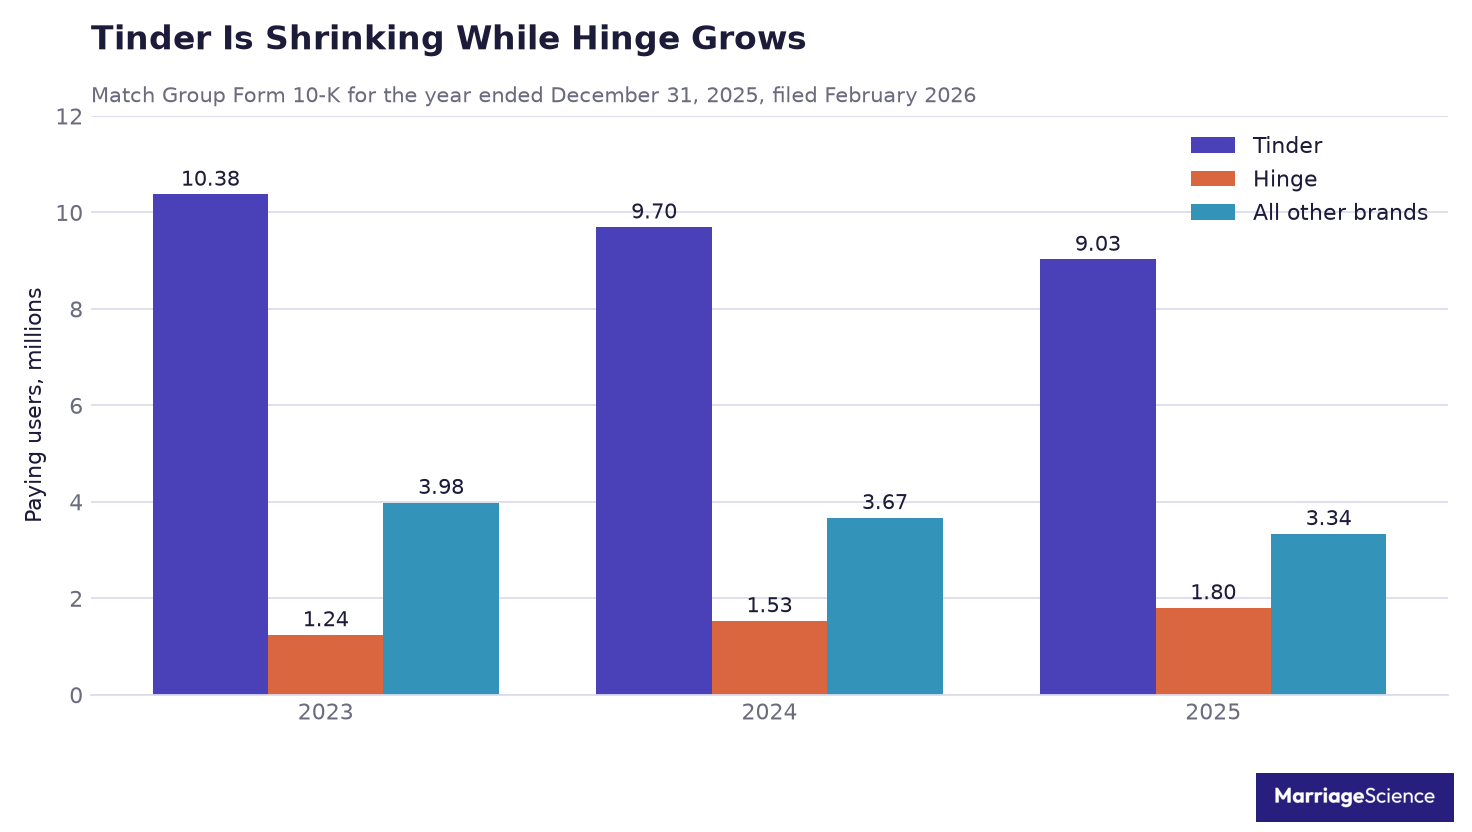
- Match Group lost 733,000 paying users in 2025 and now has 14.2 million, down from 15.6 million in 2023 (Match Group Form 10-K, February 2026).
- 48% of users have experienced at least one unwanted behavior on an app, rising to 66% of women under 50 (Pew Research Center, 2023).
What a Dating App Success Rate Actually Measures
There is no agreed definition, which is why published success rates range from about 2% to about 50% without anyone lying.
A swipe that becomes a match is one kind of success. A match that produces a reply is another. A reply that becomes a first date, a first date that becomes a relationship, and a relationship that lasts five years are four more, and each one filters out most of what came before it.
The denominator matters just as much. A rate calculated per message will always look catastrophic next to one calculated per person, because a single user sends hundreds of messages over the years they spend on an app.
The time window matters too. SSRS asks whether you have ever found a committed relationship through an app, which counts a whole dating life. A question about the last twelve months would return a fraction of that and describe the same people.
When you see a number quoted without its denominator, it is usually the per-message one, presented as though it described people.
| Measure | Typical value | Source |
| Ever-users who found a committed relationship | 50% | SSRS, January 2026 |
| Partnered adults who met their partner on an app | 10% | Pew Research Center, 2023 |
| Ceiling on reply rate when messaging up | 21% | Bruch and Newman, 2018 |
| Heterosexual couples who met online | 39% | Rosenfeld and colleagues, 2019 |
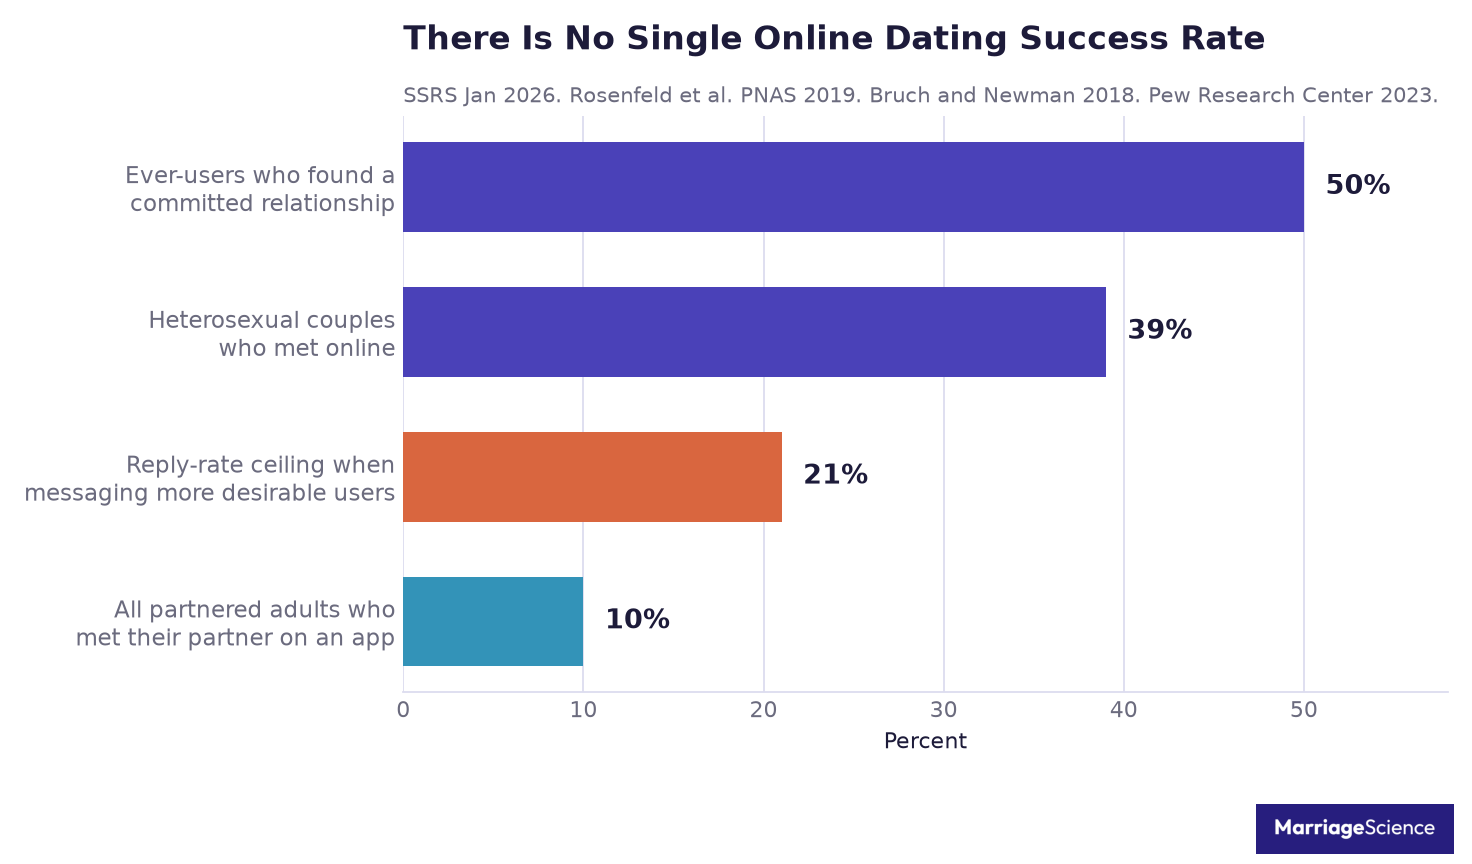
Half of Users Have Found a Committed Relationship
The single most defensible success figure available is the SSRS one, because it asks a clean question of a probability-based national panel and repeats it every January.
Half of everyone who has ever opened a dating app has, at some point, ended up in a committed relationship with someone from it. The question is lifetime, so a 45 year old who met a partner on Match in 2012 counts, and a 22 year old three weeks into their first app also counts as a user who has not.
That framing flatters older cohorts and understates the odds for anyone still early in their dating life. It is still the best measure on offer, because the alternatives come from company marketing or from surveys of people who were already planning a wedding.
Asked how online dating had affected their life overall, users split three ways in the same 2026 poll. 33% called the effect mostly positive, 20% called it mostly negative and 47% said it was neither.
Pew asked a sharper version of the question and got a similar shape. 42% of Americans said online dating has made finding a long-term partner easier, 22% said harder and 32% said it changed nothing either way.
So a clear plurality thinks the technology helps, a solid fifth thinks it hurts, and the largest single group cannot detect an effect either way. Those three answers are the reason a single success rate was never going to settle this.
The eight point rise between the 2024 and 2026 waves is the more interesting movement. It is larger than the sampling error on a subgroup that size, so it is probably real, but two waves is a short series and one more would tell you whether it is a trend.
| Metric | Value | Source |
| Ever-users reporting a committed relationship, 2026 | 50% | SSRS, January 2026 |
| Same measure, 2024 | 42% | SSRS, January 2024 |
| Users earning $75,000 or more | 58% | SSRS, January 2026 |
| Users earning under $50,000 | 44% | SSRS, January 2026 |
| Adults who have ever used an app | 37% | SSRS, January 2026 |
| Adults using an app right now | 6% | SSRS, January 2026 |
How Many Couples Now Meet Online
The other way to ask whether online dating works is to look at couples instead of users, and count how they met.
Stanford’s How Couples Meet and Stay Together survey has tracked this since the 1990s. By its 2017 wave, 39% of heterosexual couples had met online, against 2% in 1995.
Meeting online overtook meeting through friends around 2013 and has been the leading route since. For same-sex couples the shift happened earlier and went further, reaching 65%.
Pew’s number looks much smaller at 10%, and both are correct. Pew asks all partnered adults, including people who married in 1985, while Stanford asks about recently formed couples. Among partnered adults under 30, Pew’s figure doubles to 20%.
Current usage explains part of the gap. 51% of adults aged 18 to 29 and 53% of those aged 30 to 49 have used an app, against 20% of adults over 50. The age split runs through every measure on our dating app statistics page too.
The over-50 group is where most long-married couples sit, and four in five of them never used a dating app at all. Averaging them together with people who came of age after Tinder produces a number that describes nobody.
Read together, the two datasets agree. Online dating is now the default way new couples form, and the stock of existing couples has not caught up yet because most of them formed before the apps existed.
| Metric | Value | Source |
| Heterosexual couples who met online, 2017 wave | 39% | Rosenfeld and colleagues, 2019 |
| Same measure, 1995 | 2% | Rosenfeld and colleagues, 2019 |
| Same-sex couples who met online | 65% | Rosenfeld and colleagues, 2019 |
| All partnered adults who met on an app | 10% | Pew Research Center, 2023 |
| Partnered adults under 30 | 20% | Pew Research Center, 2023 |
| US marriages 2005 to 2012 that began online | More than one third | Cacioppo and colleagues, 2013 |
Where the Funnel Leaks Before a First Date
Half of users eventually find someone. Getting there takes a very large number of failed attempts, and the research on why is unusually clear.
Bruch and Newman studied messaging in four US cities on a free dating service and found that both men and women write to people roughly 25% more desirable than themselves.
The probability of a reply falls steeply as that gap widens. For messages sent up the hierarchy to more desirable women, the reply rate never rises above 21%, and that is the ceiling rather than the average.
This is worth stating plainly because the finding is regularly inverted in write-ups, which report 21% as the share of people who succeed at messaging above their level.
Bruch and Newman also tested whether a better written opening helps. Their own summary is that strategic behavior can improve the odds and that the effects are modest.
Put the two findings together and the funnel becomes readable. Most messages go up the ladder, most messages sent up the ladder go unanswered, and the volume of attempts is what eventually produces the half of users who find someone.
The practical reading is that low reply rates are a product of who people choose to contact. They are a market effect, and no amount of profile editing removes them.
| Metric | Value | Source |
| Desirability gap people aim for | About 25% above their own | Bruch and Newman, 2018 |
| Reply rate ceiling when messaging up | 21% | Bruch and Newman, 2018 |
| Cities analysed | New York, Boston, Chicago, Seattle | Bruch and Newman, 2018 |
| Effect of strategic message wording | Modest | Bruch and Newman, 2018 |
Do Relationships That Start Online Last?
This is where the evidence stops agreeing with itself, and where most articles quietly pick whichever study suits them.
The famous answer is Cacioppo and colleagues in 2013. Across 19,131 people married between 2005 and 2012, marriages that began online were slightly less likely to end in separation or divorce and came with slightly higher satisfaction.
That paper carries a conflict of interest statement most people quoting it have never read. The survey was commissioned by eHarmony, the lead author was a paid scientific advisor to eHarmony, and a co-author was the former Director of eHarmony Labs.
Independent statisticians were brought in to verify the analysis and the appendix data were published, which is the correct response to that problem. It does not make the finding wrong. It does mean the study should never be quoted as neutral evidence, which is exactly how it is usually quoted.
Rosenfeld landed somewhere milder in 2017 using the Stanford panel. Meeting online did not predict breakup at all, and it predicted a faster move into marriage for heterosexual couples. He was careful to disclaim any causal reading.
Then a 2024 replication using Pew data went the other way. Hu, Zhu and Zhang found that meeting through online dating was marginally associated with less relationship success among married people, with no such gap for couples who were together but unmarried.
Three credible teams, three answers, spread across eleven years and different samples. The honest summary is that meeting online has no large effect on whether a relationship lasts, in either direction, and anyone claiming a clear result is choosing their study.
| Study | Finding on outcomes | Source |
| Cacioppo and colleagues, 2013 | Slightly better, eHarmony commissioned | PNAS 110(25) |
| Rosenfeld, 2017 | No effect on breakup, faster to marriage | Sociological Science |
| Hu, Zhu and Zhang, 2024 | Marginally worse, married couples only | Cyberpsychol Behav Soc Netw 27(9) |
| Public belief | 58% say just as successful | SSRS, January 2026 |
Which Dating App Has the Highest Success Rate?
No independent study has ever measured this, and no platform publishes it.
Match Group reports revenue, paying users and monthly active users to the SEC every quarter. It has never reported a relationship formation rate for Tinder or Hinge, and it is under no obligation to.
The per-app shares that circulate come from wedding-industry surveys of couples who were already engaged, which cannot produce a success rate because everyone in the sample already succeeded. They tell you which apps engaged couples used. They cannot tell you which app improves a given user’s odds.
What the filings do show is where the money and the people are going. Hinge added 269,000 payers in 2025 while Tinder lost 670,000, and the group as a whole shrank for a third year running while revenue stayed flat at $3.49 billion. Our Hinge statistics page tracks that brand on its own.
Flat revenue on a falling user base means the surviving users are paying more each. That is a pricing result, and it says nothing about anyone’s chance of meeting a partner. If cost is your constraint, our guide to the best free dating sites covers which platforms let you message without paying.
| Metric | Value | Source |
| Match Group payers, 2025 | 14.17 million, down 5% | Match Group 10-K, February 2026 |
| Match Group payers, 2023 | 15.60 million | Match Group 10-K, February 2026 |
| Tinder payers, 2025 | 9.03 million, down 7% | Match Group 10-K, February 2026 |
| Hinge payers, 2025 | 1.80 million, up 18% | Match Group 10-K, February 2026 |
| Total revenue, 2025 | $3.49 billion, flat | Match Group 10-K, February 2026 |
| Published per-app success rate | None exists | SEC filings, 2026 |
What Paying Changes
Pew found that 35% of users have paid for a dating app, and that payers report better experiences. 58% of them rate online dating positively, against 50% of people who never paid.
An eight point gap is real but small, and the direction of causation is unknown. People who are enjoying an app are more willing to pay for it, which would produce the same gap with no benefit from paying at all.
Match Group’s filings point the same way from the other side. Revenue held at $3.49 billion in 2025 while the paying base fell 5%, which means average spend per payer rose.
A company can grow revenue per user by improving the product or by charging more for the same one. The filings do not separate the two, and no disclosure anywhere ties a paid tier to a measured relationship outcome.
Nothing in the Pew data links paying to finding a partner. It links paying to liking the process.
| Metric | Value | Source |
| Users who have paid | 35% | Pew Research Center, 2023 |
| Payers rating experience positive | 58% | Pew Research Center, 2023 |
| Never-payers rating experience positive | 50% | Pew Research Center, 2023 |
| Evidence that paying improves outcomes | None reported | Pew Research Center, 2023 |
Who the Apps Work Best For, and Who They Fail
Success is distributed unevenly, and the splits are large enough to matter more than any choice of platform.
Income shows the widest gap in the SSRS data. Users earning $75,000 or more report a committed relationship 58% of the time, against 44% for users under $50,000.
LGBTQIA+ adults use dating apps at nearly twice the rate of everyone else, 63% against 34%, and Stanford’s couple data shows the same pattern in outcomes with 65% of same-sex couples meeting online.
The cost falls unevenly too. 48% of users have run into at least one unwanted behavior on an app, and among women under 50 that reaches 66%. Pew also found women far more likely to call the platforms unsafe.
SSRS asked separately whether meeting an online match in person is generally safe. 57% said yes and 43% said no, but the split by gender was wide, with 55% of women calling it unsafe against 30% of men.
Any honest success rate has to sit next to that number. A platform where half the users meet something unwanted is not delivering the same experience to everyone on it.
| Group | Value | Source |
| Users earning $75,000 or more with a committed relationship | 58% | SSRS, January 2026 |
| Users earning under $50,000 | 44% | SSRS, January 2026 |
| LGBTQIA+ adults who have used an app | 63% | SSRS, January 2026 |
| Non-LGBTQIA+ adults | 34% | SSRS, January 2026 |
| Users who met an unwanted behavior | 48% | Pew Research Center, 2023 |
| Women under 50 who did | 66% | Pew Research Center, 2023 |
The Success Rate Numbers You Should Not Trust
Three figures dominate this topic online and none of them survives a check.
The first is a 2.5% dating app success rate. We could not trace it to any study, dataset or company disclosure. It appears on professional networking posts and on marketing blogs for competing products, always without a citation.
The second is the claim that men match on 1% to 3% of right swipes and women on about 50%. No platform has released swipe-level data that would support it, and the figure lives entirely on forums and content-marketing pages.
The third is the set of per-app shares taken from wedding-planning surveys. Those samples consist of couples who already got engaged, so they cannot measure anyone’s odds.
We left all three out. For adoption, revenue and safety, our online dating statistics page covers the market side, and the full set of research summaries sits on our statistics hub.
Methodology and Sources
Survey figures come from two probability-based national panels. SSRS fielded its Opinion Panel Omnibus on January 2 to 4 and January 16 to 20, 2026, among 2,012 US adults, with a margin of error of 2.5 percentage points. Pew Research Center fielded its online dating survey from July 5 to 17, 2022, among 6,034 US adults.
Couple formation figures come from Stanford’s How Couples Meet and Stay Together panel, reported in PNAS in 2019 and in Sociological Science in 2017. Outcome research comes from PNAS in 2013 and from Cyberpsychology, Behavior, and Social Networking in 2024. Messaging behavior comes from Science Advances in 2018.
Company figures are taken from Match Group’s Form 10-K for the year ended December 31, 2025, filed with the SEC on February 26, 2026. Payer counts are company-defined and count a person twice if they pay for two brands.
We excluded law firm roundups, aggregator statistics pages and company marketing claims. Where a number could only be found on those, we left it out and said so.



