


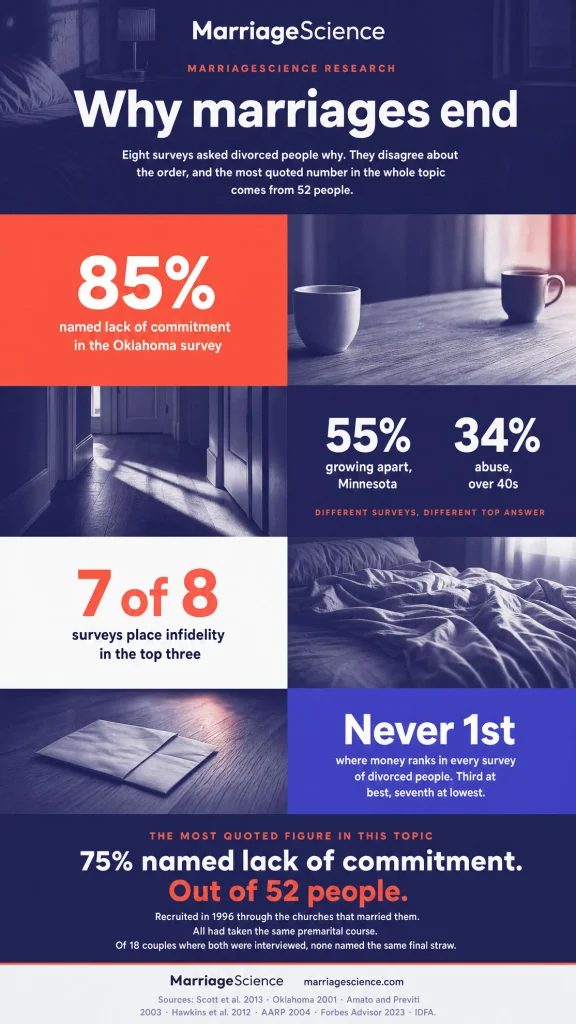
The reasons divorced people name most often are lack of commitment, infidelity, and too much conflict and arguing. That same top three appears in a 2001 Oklahoma statewide survey and in a 2013 University of Denver study.
The most quoted version is 75% lack of commitment, 59.6% infidelity, and 57.7% conflict. Those figures come from one study of 52 divorced people, although one widely shared chart credits the numbers to the CDC.
Other surveys put different reasons first. A 2012 Minnesota study put growing apart on top, AARP put abuse first among people who divorced after 40, and divorce financial analysts put basic incompatibility first.
Money is never first in any survey of divorced people we found. Money still matters, and the section on it shows where the claim that it ranks first came from.
This page compares eight surveys side by side, traces where the famous figures came from, and checks the money claim. It also covers infidelity and marriage age in our analysis of federal survey data, then looks at what these surveys say about whether these marriages could have been saved.
Key Statistics on Reasons for Divorce
Each figure names its survey. The last two are our own analysis of federal survey data.
- 75% of divorced people named lack of commitment as a major reason in the study behind the most quoted list, Scott et al. 2013. The study had 52 participants.
- Infidelity was named by 59.6% and too much conflict and arguing by 57.7% in the same study.
- When one ex-spouse named infidelity, the other agreed only 31.3% of the time (Scott et al. 2013, 18 couples).
- 0% of those couples named the same “final straw” for their marriage.
- In a 2001 Oklahoma statewide survey, divorced adults named lack of commitment (85%) and too much conflict and arguing (61%) most often.
- Asked in their own words, divorced Americans named infidelity (21.6%) and incompatibility (19.2%) most often (Amato and Previti, 2003).
- Among 886 divorcing parents in Minnesota, 55% named growing apart and 53% said they were not able to talk together (Hawkins, Willoughby and Doherty, 2012).
- For people who divorced after 40, abuse led the list at 34%, followed by different values and lifestyles at 29% (AARP, 2004).
- Money was the single most significant reason for just 4% of people who divorced after 40 (AARP, 2004).
- Divorce financial analysts said 44.1% of their clients cite basic incompatibility and 18.0% money (IDFA, 2026).
- 42% of divorced or divorcing Americans said seeing a therapist or couples counselor could have saved their marriage. Only 5% said nothing could have (Forbes Advisor, 2023).
- About 1 in 4 divorcing parents believed their marriage could still be saved with hard work (Doherty, Willoughby and Peterson, 2011).
- A widely shared “CDC” chart of divorce reasons reuses four figures from the 52-person study and relabels its 18.2% health-problems figure as “weight gain”.
- In our analysis of the General Social Survey, 25.5% of Americans with a divorce or separation behind them have had sex outside a marriage, against 9.1% of people still in their first marriage.
- In our analysis of Census data, people who married before 20 divorce at 31.3 per 1,000 a year in the first 10 years, about 2.1 times the rate for people who married at 25 to 29 (14.7).
The Most Common Reasons for Divorce, Survey by Survey
Eight surveys asked divorced people, divorcing parents, or divorce professionals why marriages ended. The answers cluster around a few themes, but the rank order changes because the surveys used different samples and different question wording.

Some surveys asked respondents to choose from a list. Amato and Previti 2003 used the open question, “What do you think caused the divorce?”
The Institute for Divorce Financial Analysts surveys asked financial analysts to report what clients told them, so those rows are professional reports of client explanations.
The table keeps the wording from each survey. “Lack of commitment,” “growing apart,” “basic incompatibility,” and “different values and lifestyles” are separate survey labels, so we keep them separate instead of forcing them into a single category.
| Survey | Who answered | Top three reasons |
|---|---|---|
| Oklahoma statewide survey, 2001 | Phone survey of over 2,000 adults | Lack of commitment 85%, too much conflict and arguing 61%, infidelity 58% |
| Scott et al. 2013 | 52 people from a premarital-program study | Lack of commitment 75.0%, infidelity 59.6%, too much conflict and arguing 57.7% |
| Amato and Previti 2003 | National panel | Infidelity 21.6%, incompatibility 19.2%, drinking or drug use 10.6% |
| Hawkins, Willoughby and Doherty 2012 | 886 divorcing parents in Hennepin County, Minnesota | Growing apart 55%, not able to talk together 53%, how a spouse handled money 40% |
| AARP 2004 | 1,147 people aged 40 to 79 | Verbal, physical or emotional abuse 34%, different values and lifestyles 29%, cheating 27% |
| Forbes Advisor and OnePoll 2023 | Online survey of 1,000 divorced or divorcing Americans | Lack of family support 43%, infidelity 34%, lack of compatibility 31%, lack of intimacy 31%, too much conflict 31% |
| IDFA 2013 | 191 divorce financial analysts | Basic incompatibility 43%, infidelity 28%, money issues 22% |
| IDFA 2026 survey | 161 respondents | Basic incompatibility 44.1%, infidelity or sexual issues 22.4%, money issues or arguments 18.0% |
Taken survey by survey, the leading answer changes. Lack of commitment leads in Oklahoma and Scott et al., infidelity leads in Amato and Previti, growing apart leads in the Minnesota sample, abuse leads in AARP, lack of family support leads in Forbes Advisor and OnePoll, and basic incompatibility leads in the IDFA rows.
Infidelity, or cheating in the AARP wording, appears in the top three in seven of the eight surveys. Only the Hennepin County, Minnesota, survey leaves it out of the top three.
Percentages do not add to 100 because most surveys let people pick several reasons. Amato and Previti’s numbers are lower because respondents had to come up with reasons themselves, a point we return to further down.
Where the 75% Lack of Commitment Figure Comes From
The famous 75.0% lack of commitment figure comes from Scott, Rhoades, Stanley, Allen and Markman, a 2013 University of Denver study published in Couple and Family Psychology: Research and Practice.
The study interviewed 52 people who had taken a premarital program called PREP before their weddings and later divorced within the following 14 years. The couples were recruited from 1996 through the religious organizations that performed their weddings.
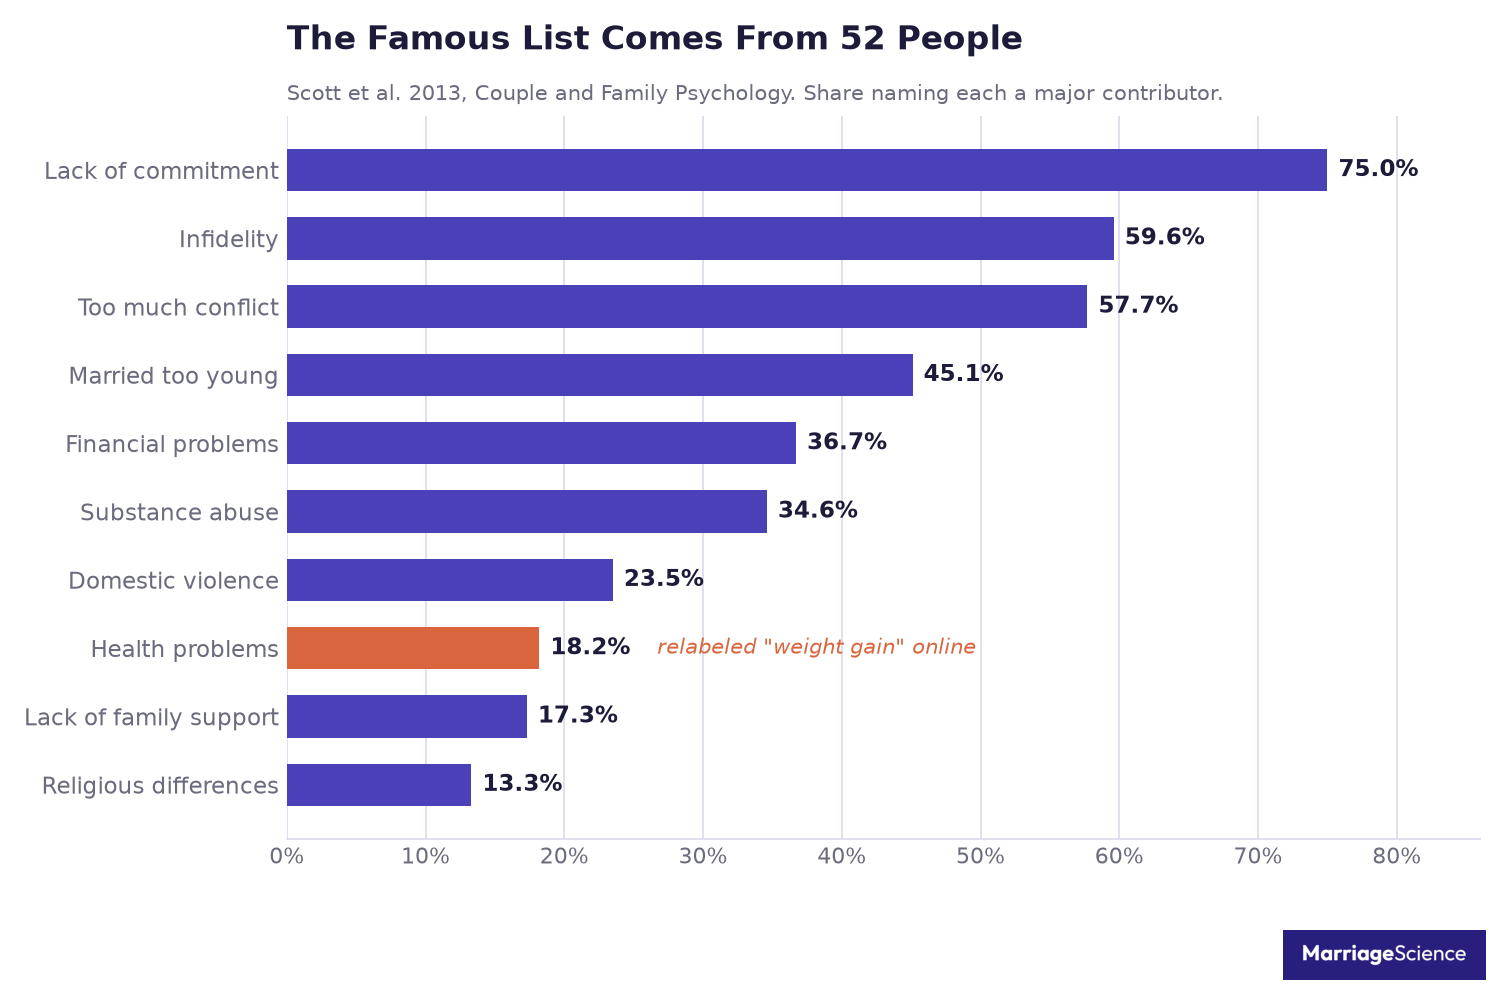
Participants marked each item yes or no as a “major contributor” to their divorce. That design matters, because it records reasons people cited while looking back.
| Reason | Individuals (52) | Ex-spouse agreed, when one named it |
|---|---|---|
| Lack of commitment | 75.0% | 70.6% |
| Infidelity | 59.6% | 31.3% |
| Too much conflict | 57.7% | 53.8% |
| Married too young | 45.1% | 27.3% |
| Financial problems | 36.7% | 50.0% |
| Substance abuse | 34.6% | 33.3% |
The second column comes from the 18 couples where both ex-spouses were interviewed. When one partner named infidelity, the other agreed 31.3% of the time.
For lack of commitment, they agreed 70.6% of the time.
That contrast is a warning about how personal these answers can be. Some reasons were shared stories inside the former couple, while others were named by one person far more often than by the other.
The checklist also included domestic violence at 23.5%. Read that figure as a reason to leave.
It is a different kind of problem from the others in the table.
The “married too young” row is often distorted. In Scott, Rhoades, Stanley, Allen and Markman, 45.1% of individuals marked that item, and people who said they married too young had married at 23.3 on average.
Those who did not had married at 29.2.
A law-firm page credits the figures to “Business Insider” and “the University of Denver” survey, then changes “45.1% said they married too young” into “45% of divorced couples married at 23.” That changes the unit, the wording, and the meaning.
The original study measured individuals. The age figure was an average among the subgroup who selected “married too young,” and it was compared with the average for people who did not select that reason.
The paper also discloses that two of the authors own a business that sells PREP. Readers should see that next to the figure when it is repeated.
Our reading is that the study is careful and useful, and also small, local, and drawn from religious couples who took a premarital course. It was never meant as a national estimate.
The safest way to read 75.0% is “three in four of 52 people.”
How a Chart Credited to the CDC Turned Health Problems Into Weight Gain
One source in this topic looks official at a glance. A chart titled “Common Reasons for Divorce in the United States,” made with the charting tool Datawrapper and embedded on a family-law website, says it shows “findings from CDC interviews with divorced men and women.”
That claim does not match what the CDC publishes. The CDC publishes counts and rates of divorce from state records.
It does not survey people about why they divorced.
The chart credited to the CDC gives eight bars: incompatibility 65, infidelity 60, constant quarrels 57.7, financial troubles 45, unrealistic expectations 40, addiction 34.6, domestic violence 23.5, and weight gain 18.2. Four of those figures trace somewhere else.
Four of the numbers line up with the 52-person Scott 2013 study: conflict and arguing 57.7%, substance abuse 34.6%, domestic violence 23.5%, and health problems 18.2%. In Scott 2013, the 18.2% item is health problems.
Nothing in the study is about weight.
That label change matters because it has been copied and expanded. Statistics aggregator sites have since gone further: one lists 18.2% as “lack of support from family,” although the Scott 2013 figure for that item is 17.3%.
Two list a “weight gain” share of 33% or 34% as a verified statistic.
We found no study behind any weight-gain percentage. The safest reading is simple: if a reasons for divorce figure is credited to the CDC, it did not come from the CDC.
It may be copied from a small interview study, relabeled by a chart, or repeated by statistics aggregator sites after the source trail has already broken.
Why the Ranking Changes With the Question
The rankings move because surveys do not ask divorced people the same way. A checklist lets people tick every reason that applied.
An open-ended question asks people to say the reasons in their own words, and the answers are coded afterwards.
The checklist format rewards broad labels. The open-ended format puts more weight on the reason a person names most plainly, often a specific event or problem.
In Oklahoma 2001, a checklist survey found lack of commitment at 85% and conflict at 61%. In Scott 2013, another checklist survey found lack of commitment at 75.0% and conflict at 57.7%.
Those results line up because lack of commitment is wide enough for many people to recognize in their own story.
The open-ended Amato and Previti 2003 study in the Journal of Family Issues used a national panel from the Marital Instability Over the Life Course study. In that study, infidelity was cited by 21.6%, incompatibility by 19.2%, and drinking or drug use by 10.6%, then growing apart came next in the ordering.
When the interview gives people prepared boxes, broad relationship labels rise. When people must name a reason without a prompt, specific events like an affair can come first, and the shares attached to each coded answer are much smaller.
Hawkins, Willoughby and Doherty 2012 is the only study here that asked people while the divorce was still going on. It used a checklist.
Growing apart was listed by 55% and not being able to talk together by 53%. Those sit close to what other surveys call commitment and conflict.
Question wording also affects blame. In Amato and Previti, more people blamed their ex at 33% than themselves at 5%, according to a summary by Scott Stanley of the University of Denver for the Institute for Family Studies.
In Oklahoma, 74% said the ex should have worked harder.
Those blame findings are about how people describe a divorce looking back. They also help explain why a single ranked list can be misleading without the question beside it.
Checklist studies tend to put broad relationship labels at the top, while open-ended studies tend to put named events and concrete problems higher.
The Final Straw Is Usually a Different Problem
In Scott 2013, the pattern changed when the question moved from broad reasons to the single “final straw.” The same interviews that put lack of commitment and too much conflict near the top also showed a different ending story.

The survey asked whether there was a single final straw, and 68.6% of the 52 said there was one. Among them, the listed final straws included infidelity 24%, domestic violence 21.2%, and substance abuse 12.1%.
That distinction matters because long-running problems and the event that ends the marriage are different lists. A marriage can be described as worn down by commitment, conflict, or distance, while the remembered ending is an affair, violence, or substance abuse.
Scott 2013 also included 18 couples where both ex-spouses were interviewed. Not one of those couples (0%) named the same final straw.
Two people who lived through the same divorce can tell different stories about its ending. One person may remember the last breach of trust.
The other may remember the long decline that made the breach feel final.
AARP 2004 framed the issue through a single most significant reason. Abuse and cheating were each 16%, alcohol or drugs and fell out of love were each 12%, different lifestyles was 11%, and money was 4%.
| Single Most Significant Reason (AARP 2004) | Share |
|---|---|
| Abuse | 16% |
| Cheating | 16% |
| Alcohol or drugs | 12% |
| Fell out of love | 12% |
| Different lifestyles | 11% |
| Money | 4% |
Read with Scott 2013, the AARP list points to the same split between background and ending. Abuse, cheating, alcohol or drugs, and falling out of love are concrete answers people can give when asked for one reason.
We read final straw answers as the story of the ending. They show what people remember as the break point.
They should not be used to erase the slower problems that came before, or to force both ex-spouses into the same story.
Is Money the Leading Cause of Divorce
The sentence “money fights are the second leading cause of divorce, behind infidelity” comes from a 2018 Ramsey Solutions press release, “Money Ruining Marriages in America.” The study behind it surveyed 1,072 U.S. adults in 2017, but the release published no question about why anyone divorced and no percentage behind the ranking.
Its published figure was about debt and arguments: 41% of couples with consumer debt say they argue about money. That is useful for understanding financial pressure inside marriages.
It does not make money the second leading divorce reason in a survey of divorced people.
The strongest research finding behind the money claim is different. Dew, Britt and Huston 2012, published in Family Relations, used the National Survey of Families and Households and followed 4,574 couples over time.
Financial disagreements were the strongest type of disagreement for predicting later divorce, for wives and husbands.
The paper’s wording is that money disagreements are “stronger predictors of divorce relative to other common marital disagreements.” Once disagreements were counted, a couple’s actual financial well-being was not linked to divorce.
Press coverage turned that into “by far the top predictor,” a phrase that is easier to share but less careful than the finding itself.
This matters here because we are comparing reasons people gave after divorce. A rank based on disagreements inside marriage is not the same thing as a rank based on divorced people naming why the marriage ended.
Money can be part of the strain without being the reason most often cited later.
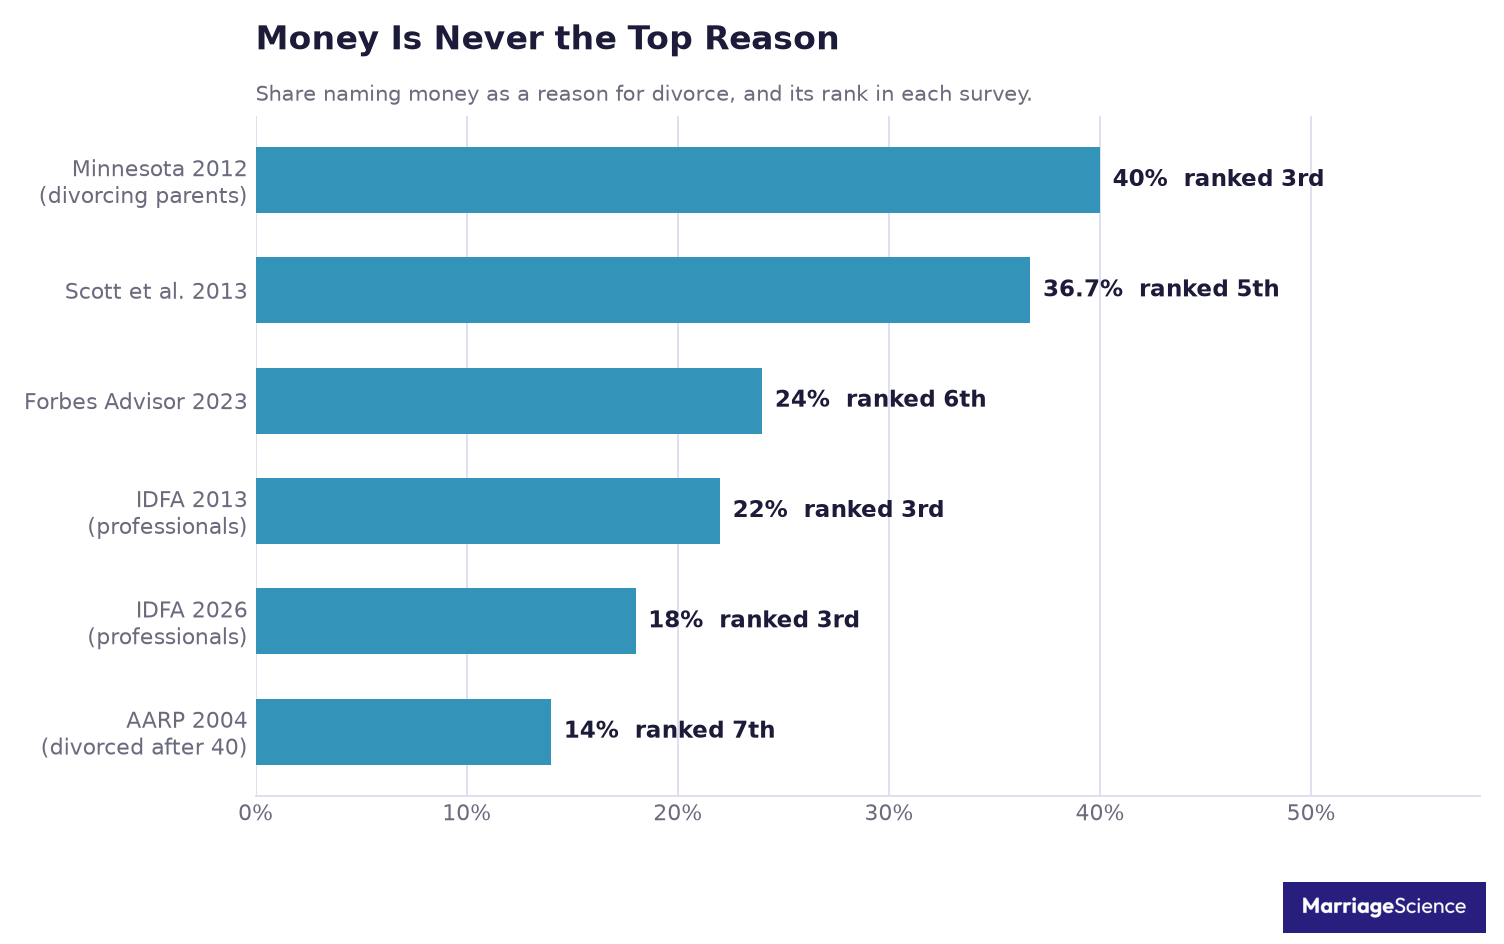
When divorced people are asked to name reasons after the marriage ends, money appears as a common reason, never the first one in this set. The rankings below keep each survey separate, because each one used its own wording and sample.
| Survey | Money’s Share | Rank |
|---|---|---|
| Hawkins and Doherty 2012 | 40% | third |
| Scott 2013 | 36.7% | fifth |
| Forbes Advisor 2023 | 24% | sixth |
| IDFA 2013 | 22% | third |
| IDFA 2026 | 18.0% | third |
| AARP 2004 | 14% (4% as top reason) | seventh |
In Hawkins, Willoughby and Doherty 2012, how a spouse handled money was cited by 40% and ranked third. Scott 2013 put financial problems at 36.7%, fifth.
Forbes Advisor 2023 put financial stress at 24%, sixth, and in the same survey only 10% saw financial stress as a warning sign.
The IDFA surveys of divorce financial analysts also put money third. Its share fell from 22% in 2013 to 18.0% in 2026.
AARP 2004 was lower, with money problems at 14%, seventh, and 4% as the single most significant reason. That survey is a useful check on the stronger versions of the money claim.
It found money on the list, but not near the top.
The practical reading is narrow. Arguing about money is a warning sign worth taking seriously, especially when the arguments are repeated or unresolved.
Being short of money alone looks weaker than the conflict around money, since Dew, Britt and Huston 2012 found that once disagreements were counted, actual financial well-being was not linked to divorce.
Money belongs in any serious list of divorce reasons. It should not be promoted to the top of the list without survey support.
No survey of divorced people we found puts money first.
Infidelity Among Divorced Americans: Our Analysis
Infidelity appears in the reason surveys as one of the recurring answers people give after a marriage has ended. It is in the top three of seven of the eight reason surveys compared above.
To look at the same issue from another angle, our analysis uses the General Social Survey, run by NORC at the University of Chicago. Since 1991, the GSS has asked ever-married adults, “Have you ever had sex with someone other than your husband or wife while you were married?”
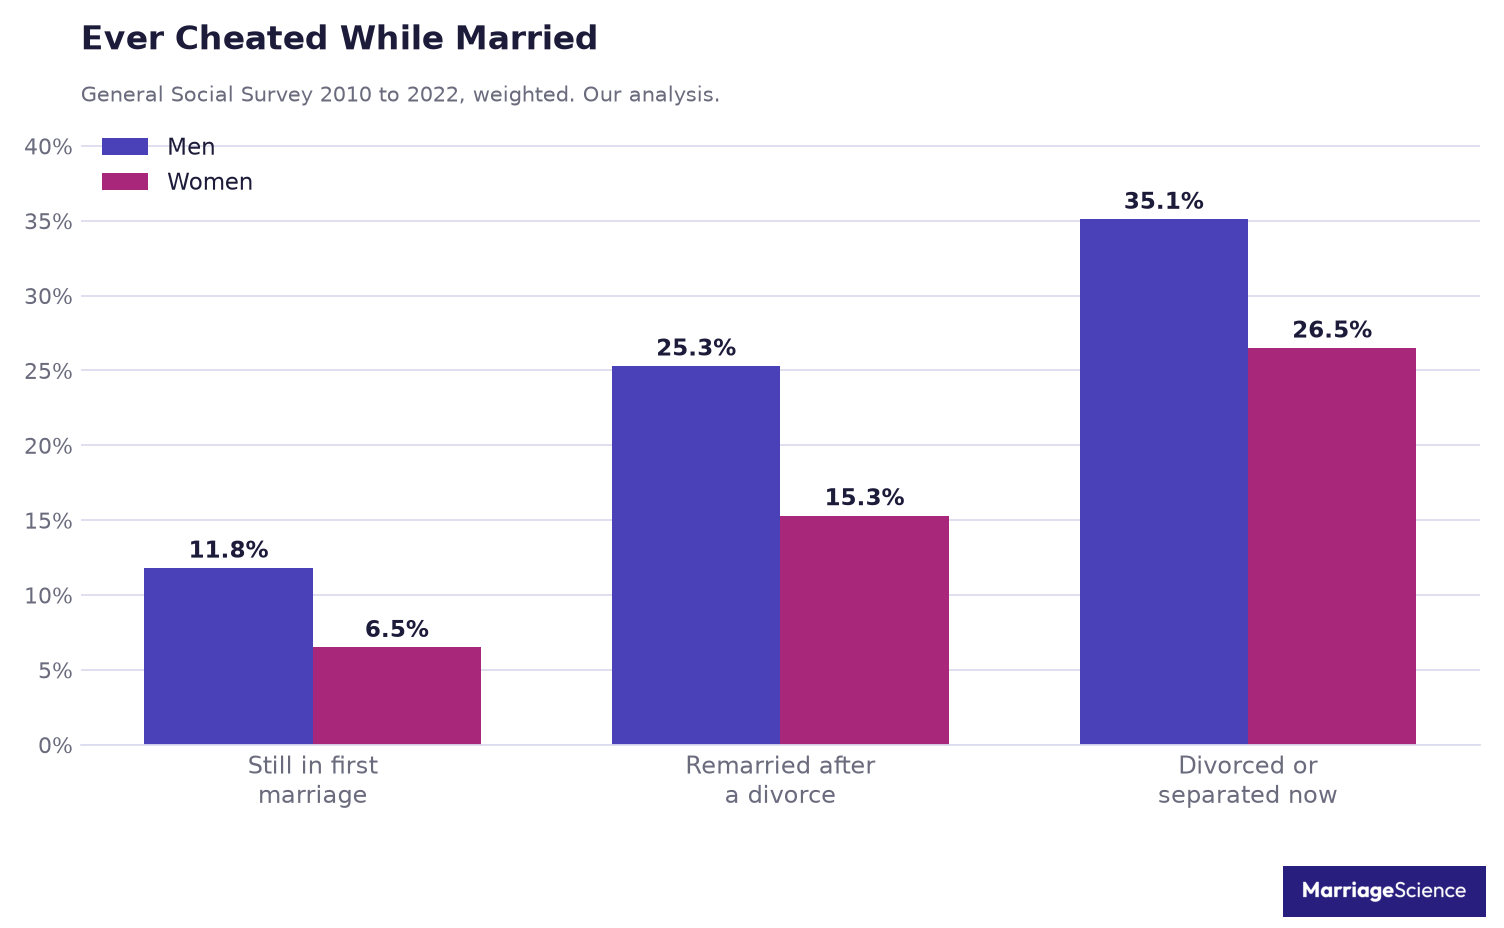
We pooled 2010 to 2022, the years the question is on the current file, and used the survey weights. As a check, our method for 2010 to 2016 gives 19.7% of ever-married men and 13.2% of ever-married women saying yes, matching the 20% and 13% the Institute for Family Studies published from those years.
The split by marital history is large. In our GSS analysis, 9.1% of people still in their first marriage said yes, compared with 20.1% of people remarried after a divorce or separation and 29.8% of people who were divorced or separated at the time of the survey.
Sex differences also appear inside those groups. Among people still in a first marriage, the GSS figures are 11.8% for men and 6.5% for women.
Among people divorced or separated now, they are 35.1% for men and 26.5% for women.
| Group | All | Men | Women |
|---|---|---|---|
| Still in first marriage | 9.1% | 11.8% | 6.5% |
| Remarried after divorce | 20.1% | 25.3% | 15.3% |
| Divorced or separated now | 29.8% | 35.1% | 26.5% |
Another way to read the GSS is to group everyone who has a divorce or separation in their history. In our analysis, 25.5% of that group said yes, about 2.8 times the rate among people still in a first marriage.
The comparison rests on 4,305 first-marriage respondents and 2,453 divorced or separated respondents.
The limits matter. The GSS question does not say which marriage the affair was in, whether it came before the breakup, or whether both spouses knew about it.
People also under-report affairs in surveys.
For that reason, the GSS cannot show that the affair caused the divorce. What it can show is that people with divorce or separation in their marital history report extramarital sex more often than people still in a first marriage, which fits the reason surveys where infidelity is often cited near the top.
Who cheats more, and how the rates differ by age, is covered in our infidelity statistics.
Does Marrying Young Raise the Risk of Divorce
Marrying young appears in two different places in the reasons people give for divorce. “Getting married too young” was named by 45.1% in Scott 2013 and 10% in the Forbes Advisor survey.
Those are retrospective answers, so they tell us that some divorced people look back on timing as part of the story.
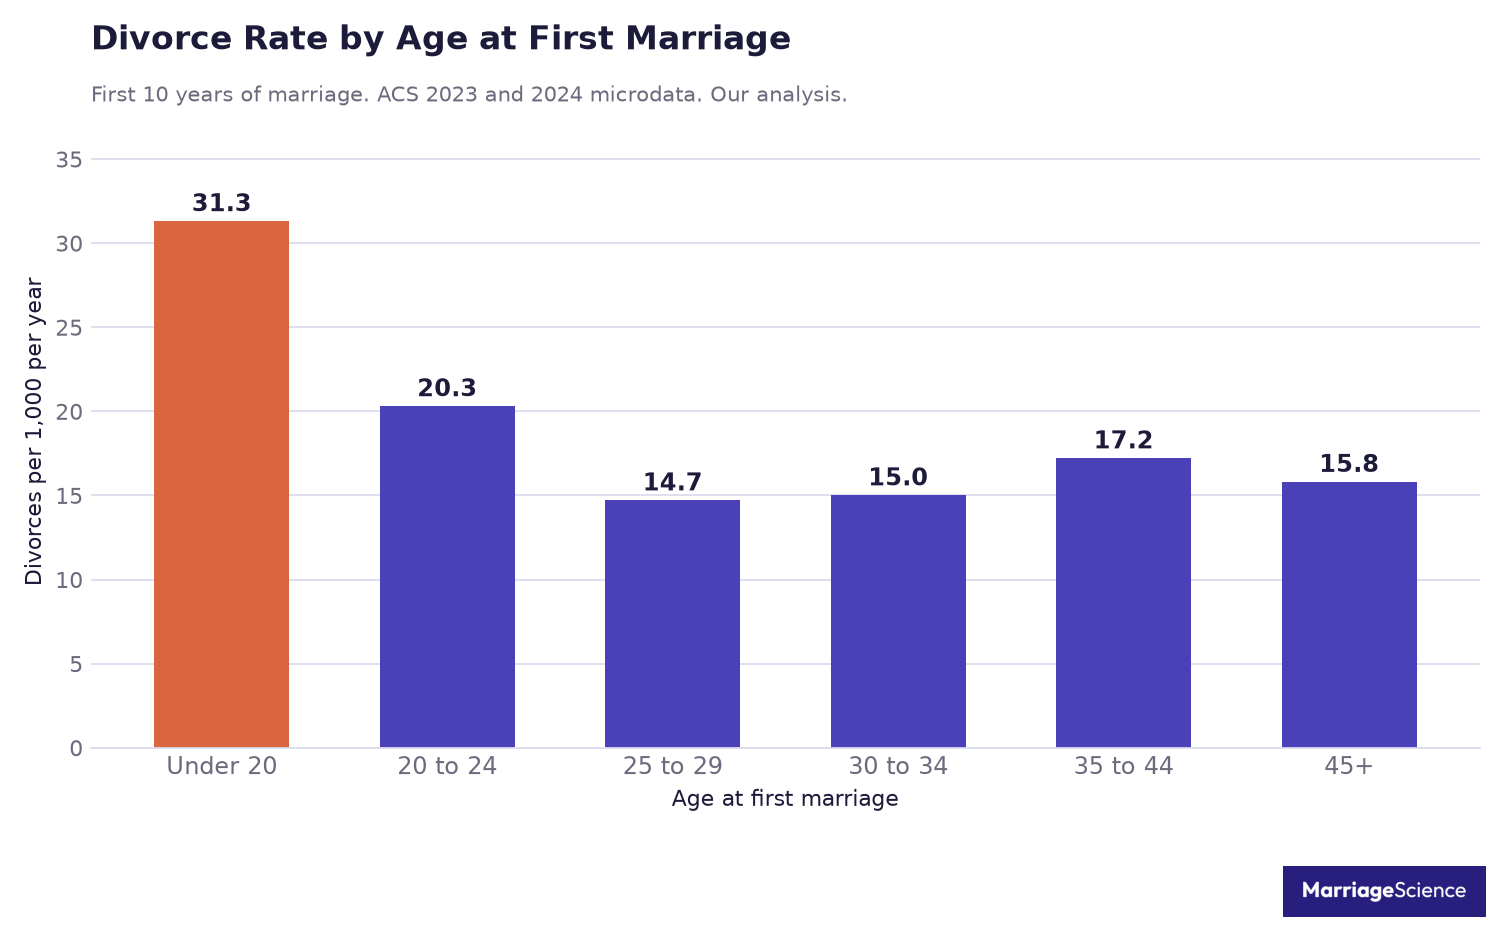
To test timing against current population data, our analysis used the American Community Survey 2023 and 2024 one-year files, public-use microdata from all 50 states and DC. The survey asks whether a person divorced in the past 12 months and the year they last married.
We counted people in a first marriage of up to 10 years, plus people whose first marriage of up to 10 years ended in divorce in the past 12 months, and grouped them by age at the wedding.
The pattern is clearest at the youngest ages. People who married under 20 had 31.3 divorces per 1,000 first marriages per year during the first 10 years.
People who married at 25 to 29 had 14.7, so people who married before 20 divorced at about 2.1 times the yearly rate of that comparison group.
The drop flattens after 25. The rate was 15.0 for ages 30 to 34, 17.2 for ages 35 to 44, and 15.8 for ages 45 and older.
In this cut of the data, the largest separation is between marrying before 20 and marrying in the late twenties.
| Age at first marriage | Divorces per 1,000 per year |
|---|---|
| under 20 | 31.3 |
| 20 to 24 | 20.3 |
| 25 to 29 | 14.7 |
| 30 to 34 | 15.0 |
| 35 to 44 | 17.2 |
| 45 and older | 15.8 |
There are limits to this measure. It uses one year of divorces, people who remarried within the year are not counted, and age at marriage is worked out from the year of marriage, so it can be off by one year.
It is a snapshot of reported recent divorces among people early in a first marriage, grouped by the age when that marriage began.
So the short answer is yes, with a narrow meaning. Marrying before 20 is associated with a higher recent divorce rate in our analysis.
For marriages beginning at 25 or later, age at the wedding is a weaker separator, though the rate rises again a little for first marriages at 35 to 44.
Reasons for Divorce After 40
The clearest detailed source on divorce after 40 is AARP‘s 2004 report, The Divorce Experience: A Study of Divorce at Midlife and Beyond. It surveyed 1,147 people, including 581 men and 566 women, aged 40 to 79 who had divorced at least once in their 40s, 50s or 60s, and asked them to choose up to three major reasons from a list.

Among those respondents, verbal, physical or emotional abuse was cited by 34%, followed by different values and lifestyles at 29%, cheating at 27%, simply fell out of love or no obvious problems at 24%, alcohol or drug abuse at 21%, control freak at 16%, money problems at 14%, not carrying their weight at 14%, fell in love with someone else at 10%, and abandonment at 10%.
That ordering matters because later-life divorce is sometimes described as a quiet drift apart. The midlife survey does show drift, since simply fell out of love or no obvious problems was named by 24%.
It also shows abuse at the top of the list, with alcohol or drug abuse close behind the first few reasons.
Cheating had a specific pattern in the same survey. Of the respondents who named cheating, 86% said it was the ex-spouse who cheated.
The survey also found an imbalance in who reported asking for the divorce, with 66% of women saying they asked for it, compared with 41% of men.
The decision often was not described as a process that lasted many years. Only 17% said they took five years or more to decide.
Some people live with a long-standing problem, while others reach a decision after a clearer break, such as cheating, abuse, abandonment, or a new relationship.
This is still a survey from 2004. Divorce after 50 has grown since then, so we treat it as the best detailed survey available on reasons named after midlife, with limits attached to its age and sample.
Use it for the mix of reasons people reported. It does not count today’s later-life divorces.
How common divorce after 50 has become since then is in our gray divorce statistics.
What Predicts Divorce Before It Happens
Reason surveys ask divorced people to look back. A different kind of evidence follows couples while they are still married, then asks which problems show up before a later divorce.
That research is useful because it separates hindsight from patterns that were already visible inside the marriage.
Amato and Rogers 1997, in the Journal of Marriage and the Family, used a national sample of married people interviewed in 1980 and followed to 1992. Problems reported in 1980 predicted divorce up to 12 years later.
The problems that mattered were infidelity, spending money foolishly, drinking or drug use, jealousy, moodiness, and irritating habits.
That study also found a reporting gap inside marriage itself. Wives reported more problems than husbands.
Two spouses can describe the same marriage very differently.
Dew, Britt and Huston 2012 found that money disagreements predicted divorce more strongly than other disagreements. That finding also comes from couples followed while still married.
Gottman and Levenson 2000, The Timing of Divorce, followed couples in a 14-year study. Negative emotion during arguments predicted early divorce.
A lack of positive emotion predicted later divorce.
The famous number from that paper needs careful wording. Gottman and Levenson 2000 reported that its model “predicted divorce with 93% accuracy”.
The model was built on 79 couples, 21 of whom divorced, and was scored on those same couples.
That makes the 93% a fit to one small sample. It is not a test anyone can take, and it should not be read as a promise that an outside observer can watch a couple argue and forecast their future with that accuracy.
Heyman and Slep 2001, The Hazards of Predicting Divorce Without Crossvalidation, made the caution explicit in the Journal of Marriage and Family. When this kind of model is tested on couples it was not built on, “accuracy and predictive value drops precipitously”.
The shared lesson is narrower and more useful than the headline number. How couples argue, how money conflicts are handled, and whether warmth is still present can appear years before divorce.
That is why conflict patterns and the loss of warmth keep returning across the research.
Could These Marriages Have Been Saved
The answer depends on what kind of trouble a marriage was in, who was asked, and when they were asked. Some divorced people look back and name things that might have changed the outcome.

Others were facing harm, coercion, or fear, where the safer answer was to leave.
Forbes Advisor and OnePoll 2023 asked 1,000 divorced or divorcing Americans what could have saved their marriage. The most common answer was a better understanding of the commitment of marriage, cited by 63%.
In the same Forbes Advisor and OnePoll 2023 survey, 56% named a better understanding of the partner’s values and morals. Another 44% named waiting longer to start a family, 42% named getting professional help from a therapist or couples counselor, and 40% named waiting longer to marry.
Only 5% in Forbes Advisor and OnePoll 2023 said the marriage could not have been saved. That does not mean every marriage should have continued.
It means that, in hindsight, most respondents could name some condition, knowledge, timing, or help that they believed might have mattered.
Doherty, Willoughby and Peterson 2011, in Family Court Review, studied 2,484 divorcing parents in Minnesota. About 1 in 4 believed the marriage could still be saved with hard work, about 3 in 10 were open to reconciliation services, and in about 1 in 10 couples both partners were.
Those figures are more cautious than the hindsight answers in Forbes Advisor and OnePoll 2023. They came from people already in the divorce process, and they separated one partner’s hope from both partners being open at the same time.
A marriage cannot be repaired by one person’s hope alone.
Oklahoma 2001 offers a different view, from married respondents. It found that 34% had at some point thought their marriage was in serious trouble.
Of those respondents, 92% said they were glad they were still together.
Scott 2013 adds another kind of regret. In that study, 42.3% wished they had known more about their ex before marrying.
That fits with the Forbes Advisor and OnePoll 2023 answers about commitment, values and morals, timing, and professional help.
The practical pattern is narrow but clear. Commitment problems, conflict, not being able to talk, and growing apart are the kinds of problems couples therapy works on.
Therapy cannot promise a saved marriage, and these are the problems it is built for.
Abuse is different. Leaving is the right answer when safety is at stake, and safety comes first.
Therapy language should never be used to pressure someone to stay in a dangerous home.
If the trouble is conflict or distance, help can start small. Our comparison of online couples therapy platforms covers prices, insurance and whether one partner can start alone.
Whether it works is a fair question, and our review of marriage counseling success rates shows what the trials found.
Methodology and Sources
We treated each reason survey as a record of what respondents cited after a divorce or after serious marital distress. Most surveys are of people looking back, and reasons people give are not the same as causes.
For how many marriages end, by state and over time, see our divorce statistics.
For that reason, this article uses words such as cited, named, listed, and reported.
Where a primary paper or report was available, we read that source instead of relying on reposted summaries. The reason surveys came from Scott et al.
2013, the AARP 2004 full report, the Oklahoma 2001 executive summary, the IDFA 2026 page, Forbes Advisor 2023 article and chart data, and a Ramsey Solutions press release.
Amato and Previti 2003 and Hawkins, Willoughby and Doherty 2012 were handled differently because the full texts are paywalled. For those surveys, our figures came from the abstract or from peer-reviewed papers that cite them.
We kept those limits visible because a paywalled source gives less room to check wording, tables, and context.
For our infidelity figures, our analysis used the General Social Survey cumulative file 1972 to 2024. We used question EVSTRAY for years 2010 to 2022, with WTSSALL to 2018 and WTSSPS from 2021.
As a check, we reproduced the Institute for Family Studies’ published 20% and 13% before extending the cut.
For marriage age, our analysis used American Community Survey public-use microdata, pooling the 2023 and 2024 one-year files. We used MARHD, MARHT, MARHYP, and person weights.
Those variables identify people divorced in the past 12 months, times married, and year last married.
We also left out claims that appeared often enough to check but did not trace to a usable source. That included a weight gain percentage with no source, a widely repeated claim that 65% of divorces are due to miscommunication with no source found, and a claim that fewer than a third of divorcing couples try therapy, because we could not find the study.