


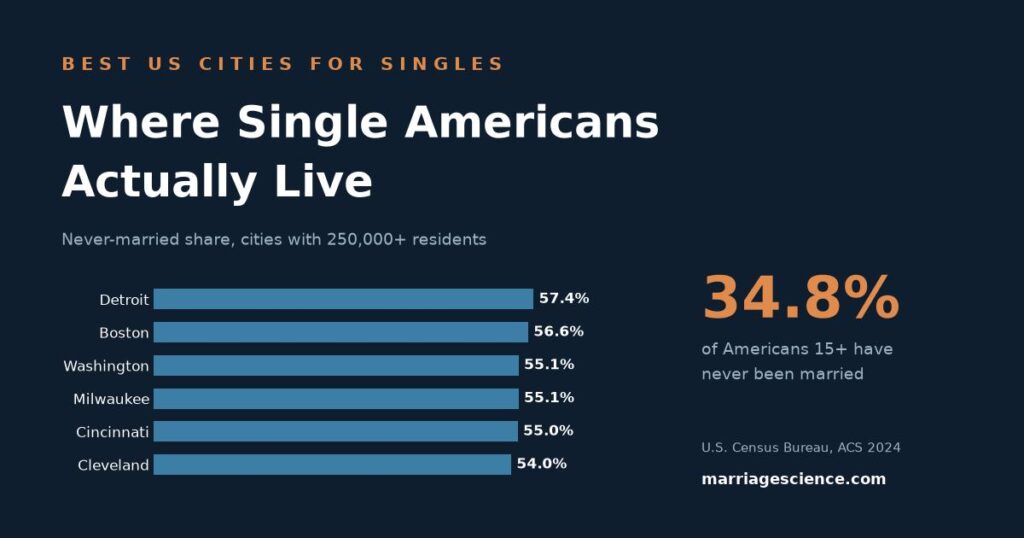
57.4% of Detroit residents aged 15 and over have never been married, the highest share of any US city with at least 250,000 people (U.S. Census Bureau, ACS 1-Year Estimates Table B12001, 2024). The national figure is 34.8%. At the bottom of the same list Port St. Lucie, Florida records 27.1%, which puts 30.3 percentage points between the top and bottom large city.
A count of single people tells you less about anyone’s chances than it looks like it does, and Detroit is the clearest case. The same city has 81.6 unmarried men for every 100 unmarried women, the 14th most female-skewed of the 92 cities ranked here.
Salt Lake City is the only metro above one million people where unmarried men outnumber unmarried women at all.
Conversion rates diverge just as hard. Utah recorded 51.7 marriages per 1,000 unmarried women in 2024 against 20.1 in Delaware (NCFMR, Family Profile FP-25-30, 2025).
We aggregated data from the U.S. Census Bureau, Pew Research Center, NCFMR at Bowling Green State University, the Bureau of Labor Statistics, and dozens of other primary sources. Every city and metro ranking below was calculated from the ACS estimate tables themselves, because the pages that currently rank for this term are content studies from rental and personal-finance brands recycling a single variable.
Key Takeaways
- 34.8% of Americans aged 15 and over have never been married, and 50.5% are unmarried once widowed and divorced people are counted (U.S. Census Bureau, ACS Table B12001, 2024).
- 42% of US adults were unpartnered in 2023, down from the 44% peak in 2019 (Pew Research Center, Fry, January 2025).
- Detroit leads all large US cities at 57.4% never married, followed by Boston at 56.6% and Washington, DC at 55.1% (U.S. Census Bureau, ACS Table B12001, 2024).
- Port St. Lucie, Florida has the lowest never-married share of any large city at 27.1% (U.S. Census Bureau, ACS Table B12001, 2024).
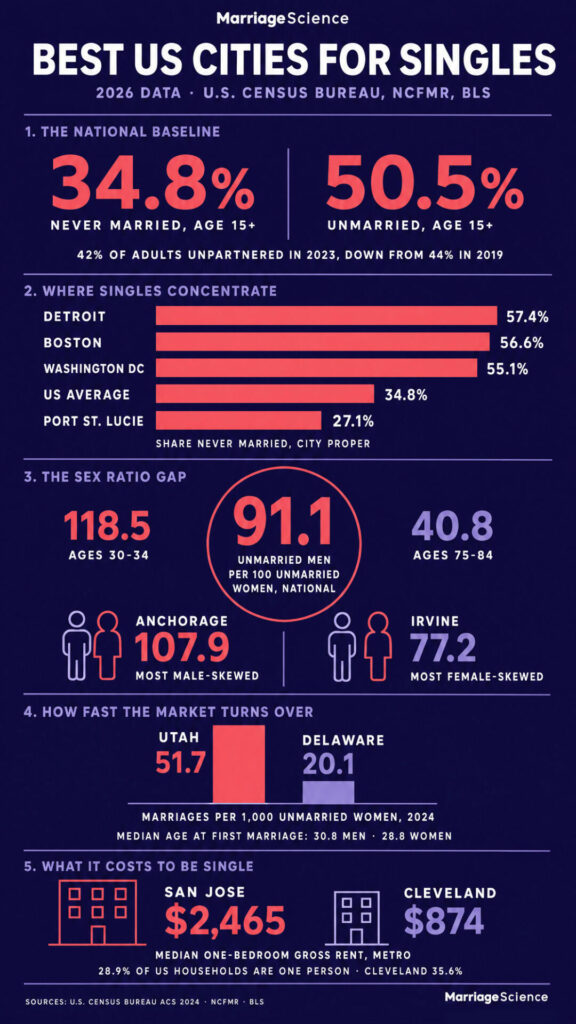
- There are 91.1 unmarried men for every 100 unmarried women nationally, but 118.5 per 100 in the 30 to 34 age band (U.S. Census Bureau, ACS Table B12002, 2024).
- Anchorage has 107.9 unmarried men per 100 unmarried women, the highest of any large city; Irvine, California has the lowest at 77.2 (U.S. Census Bureau, ACS Table B12001, 2024).
- The US refined marriage rate was 31.2 per 1,000 unmarried women in 2024, down from 76.5 in 1970 (NCFMR, Family Profile FP-25-30, 2025).
- Median age at first marriage reached 30.8 for men and 28.8 for women in 2024, the highest since the ACS began collecting marriage data in 2008 (NCFMR, Family Profile FP-26-01, 2026).
- 28.9% of US households contain one person, rising to 35.6% in the Cleveland metro area (U.S. Census Bureau, ACS Table B11001, 2024).
- A single-person household spent $19,052 on housing in 2024, 30% more than each half of a two-person household spent (Bureau of Labor Statistics, Consumer Expenditure Survey, 2024).
- 37% of US adults have ever used an online dating site or app, and 6% are current users (SSRS Opinion Panel Omnibus, January 2026).
- The Milwaukee metro has 30.9 drinking places per 100,000 residents, the densest of any metro above one million people (Bureau of Labor Statistics, QCEW, NAICS 7224, 2024).
1. How Many Americans Are Single Right Now
Three different numbers get reported as the share of single Americans. The Census never-married share counts people who have not legally married, which leaves out divorced and widowed people who are back on the market. Pew’s unpartnered measure counts adults who do not live with a spouse or partner, so it picks those people up but misses anyone in a committed relationship who keeps a separate address.
Pew’s third measure asks people outright whether they are single, and returns the smallest number of the three.
Only the ACS measures work for city comparisons. Pew’s surveys carry no place-level sample, so a city ranking built on a Pew figure has no underlying geography behind it.
| Metric | Value | Source |
| Never married, US population 15 and over | 34.8% (97,616,928 people) | Census ACS Table B12001, 2024 |
| Unmarried (never married, widowed, or divorced), 15 and over | 50.5% (141,797,417 people) | Census ACS Table B12001, 2024 |
| Unpartnered adults, 2023 | 42% | Pew Research Center, January 2025 |
| Unpartnered adults, 2019 peak | 44% | Pew Research Center, January 2025 |
| Self-reported single (not married, cohabiting, or in a committed relationship) | 30% | Pew Research Center, February 2023 |
| Never married, ages 25 to 29 | 68.7% | Census ACS Table B12002, 2024 |
| Never married, ages 30 to 34 | 47.2% | Census ACS Table B12002, 2024 |
| Never married, ages 40 to 44 | 24.0% | Census ACS Table B12002, 2024 |
| Singles looking for a relationship or dates | 42%, down from 49% in 2019 | Pew Research Center, February 2023 |
The unpartnered share fell from 44% to 42% between 2019 and 2023, which cuts against the usual account of a collapsing dating market. Marriage rose from 50% to 51% of adults over the same period and cohabitation from 6% to 7% (Pew Research Center, Fry, January 2025).
Age moves the number far more than any of this. Never-married status covers 90.5% of people aged 20 to 24 and 47.2% of those aged 30 to 34, then flattens near a quarter through the early forties.
2. Where Singles Concentrate: City and Metro Variation
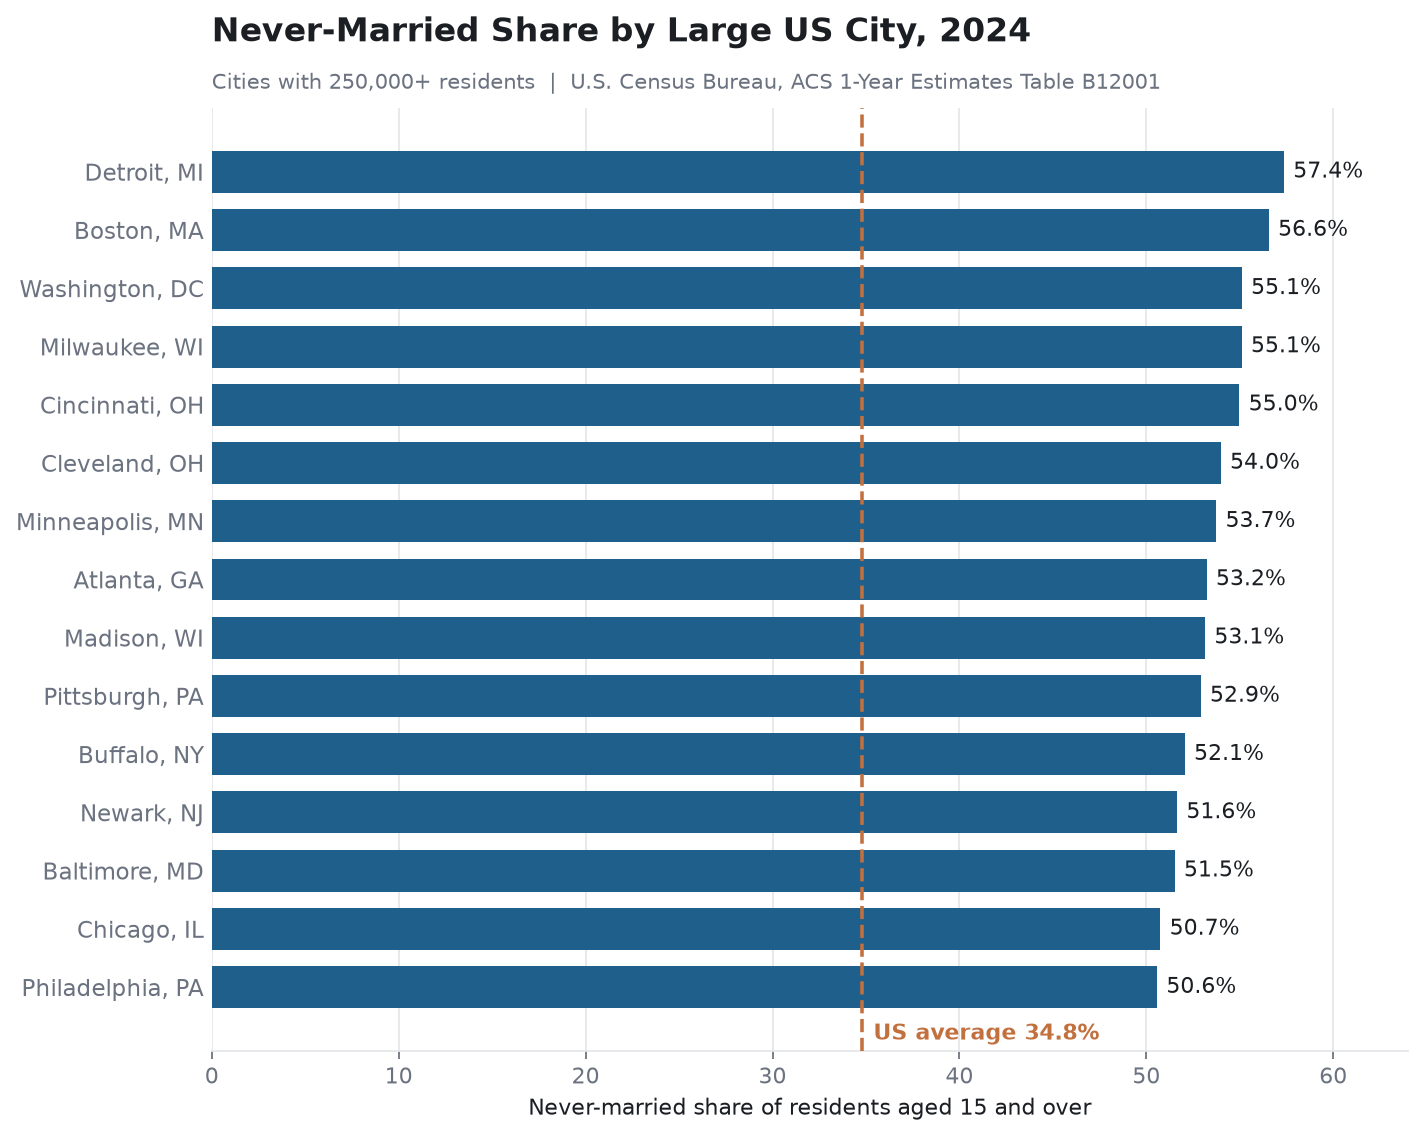
The 30.3-point gap between Detroit at 57.4% and Port St. Lucie at 27.1% dwarfs the 2-point national move Pew recorded across four years.
Two unrelated city types produce that top group. Older industrial cores such as Detroit, Milwaukee, Cleveland, and Buffalo score high partly because marriage rates in their populations are low. College and knowledge-work centers such as Boston, Madison, Minneapolis, and Washington, DC get there through in-migration of people in their twenties who marry later.
Both mechanisms land on the same percentage.
Metro figures always run below city-proper figures, because suburbs pull the average toward married households. Detroit city is 57.4% never married; the Detroit-Warren-Dearborn metro is 36.4%. Comparing one against the other is the most common error in this topic.
| Metric | Value | Source |
| Detroit, MI (city proper) | 57.4% never married | Census ACS Table B12001, 2024 |
| Boston, MA (city proper) | 56.6% never married | Census ACS Table B12001, 2024 |
| Washington, DC (city proper) | 55.1% never married | Census ACS Table B12001, 2024 |
| Milwaukee, WI (city proper) | 55.1% never married | Census ACS Table B12001, 2024 |
| Cincinnati, OH (city proper) | 55.0% never married | Census ACS Table B12001, 2024 |
| Cleveland, OH (city proper) | 54.0% never married | Census ACS Table B12001, 2024 |
| Atlanta, GA (city proper) | 53.2% never married | Census ACS Table B12001, 2024 |
| Madison, WI (city proper) | 53.1% never married | Census ACS Table B12001, 2024 |
| Chesapeake, VA (city proper) | 30.2% never married | Census ACS Table B12001, 2024 |
| Port St. Lucie, FL (city proper) | 27.1% never married | Census ACS Table B12001, 2024 |
| United States (all geographies) | 34.8% never married | Census ACS Table B12001, 2024 |
| Los Angeles-Long Beach-Anaheim, CA (metro area) | 41.3% never married, highest US metro above 1M | Census ACS Table B12001, 2024 |
Every figure above covers people aged 15 and over, which is the ACS universe for marital status. That is a real nuisance for this particular question. Fifteen to nineteen year olds are single by default, so a city with a large student population carries a structural bump that has nothing to do with its adult dating pool, and Madison and Boston both collect one.

There is a larger limit sitting underneath all of it. The ACS records marital history. Whether someone is actually looking, and who they are looking for, falls outside what the survey asks.
No agency publishes a place-level count of single adults by orientation, so a gay or bisexual reader gets considerably less out of these tables than the row labels suggest. We have not found a workaround for that and are not going to pretend otherwise.
Detroit tops the ranking on singles share and sits in the bottom sixth on sex ratio, at 81.6 men per 100 women. Those are opposite signals for a man and a woman reading the same row.
Platform choice usually matters more than city choice by that point, which is where our testing of the best dating sites is more use than a ranking.
3. Sex Ratios: Which Cities Have More Single Men Than Single Women
Nationally there are 91.1 unmarried men for every 100 unmarried women, which reads as a shortage of men. Longevity produces that gap.
Among people aged 30 to 34 there are 118.5 unmarried men per 100 unmarried women, and the ratio does not drop below 100 until the late forties. By ages 75 to 84 it reaches 40.8, at which point the figure is largely a record of who has been widowed.
City ratios swing by more than 30 points. Anchorage, Fresno, and Anaheim run male-heavy, while Irvine, Washington, DC, and Baltimore run the other way.
| Metric | Value | Source |
| US unmarried men per 100 unmarried women, 15 and over | 91.1 | Census ACS Table B12001, 2024 |
| Ages 25 to 29 | 115.6 | Census ACS Table B12002, 2024 |
| Ages 30 to 34 (peak) | 118.5 | Census ACS Table B12002, 2024 |
| Ages 45 to 49 (crossover) | 94.9 | Census ACS Table B12002, 2024 |
| Ages 75 to 84 | 40.8 | Census ACS Table B12002, 2024 |
| Anchorage, AK (city proper, highest) | 107.9 | Census ACS Table B12001, 2024 |
| Fresno, CA (city proper) | 105.2 | Census ACS Table B12001, 2024 |
| San Francisco, CA (city proper) | 103.8 | Census ACS Table B12001, 2024 |
| Washington, DC (city proper) | 77.4 | Census ACS Table B12001, 2024 |
| Irvine, CA (city proper, lowest) | 77.2 | Census ACS Table B12001, 2024 |
| Salt Lake City-Murray, UT (metro area, highest above 1M) | 103.1 | Census ACS Table B12001, 2024 |
| Baltimore-Columbia-Towson, MD (metro area, lowest above 1M) | 81.3 | Census ACS Table B12001, 2024 |
Salt Lake City is the only metro above one million people where unmarried men outnumber unmarried women. Utah, the state around it, also records the country’s lowest median age at first marriage for women and its highest marriage rate.
Read the city column with some care. It counts everyone aged 15 and over, of every orientation and every stage of life, so a 30-something in Anchorage faces nothing like the citywide 107.9. Age-banded ratios are not published below the national level, which is why the age table above stops at the US.

4. Marriage and Divorce Rates by State: How Fast the Market Turns Over
A large singles pool means little if nobody in it marries. The refined marriage rate, marriages per 1,000 unmarried women aged 15 and over, measures how fast a market converts.
Utah recorded 51.7 marriages per 1,000 unmarried women in 2024, its fifth consecutive year in first place, against 20.1 in Delaware. An unmarried woman in Utah is roughly two and a half times as likely to marry in a given year as one in Delaware.
The regional pattern is stark. Over three-quarters of Northeastern states fall in the bottom quartile for marriage rates, while 42% of Midwestern states and 38% of Western states sit in the top quartile (NCFMR, Family Profile FP-25-30, 2025).
| Metric | Value | Source |
| US refined marriage rate, 2024 | 31.2 per 1,000 unmarried women | NCFMR FP-25-30, 2025 |
| US refined marriage rate, 1970 | 76.5 per 1,000 | NCFMR FP-25-30, 2025 |
| Highest state: Utah | 51.7 per 1,000 | NCFMR FP-25-30, 2025 |
| Next highest: Idaho, Colorado, Wyoming, South Dakota | 44.3, 43.0, 42.9, 41.4 | NCFMR FP-25-30, 2025 |
| Lowest state: Delaware | 20.1 per 1,000 | NCFMR FP-25-30, 2025 |
| Women who married in 2024 | 2,390,482 | NCFMR FP-25-30, 2025 |
| US refined divorce rate, 2024 | 14.2 per 1,000 married women | NCFMR FP-25-31, 2025 |
| Highest divorce rate: Oklahoma | 20.7 per 1,000 | NCFMR FP-25-31, 2025 |
| Lowest divorce rate: Maine | 10.0 per 1,000 | NCFMR FP-25-31, 2025 |
| Median age at first marriage, men | 30.8 years | NCFMR FP-26-01, 2026 |
| Median age at first marriage, women | 28.8 years | NCFMR FP-26-01, 2026 |
| Highest median age, men: CT, MA, NH | 32.4 years | NCFMR FP-26-01, 2026 |
| Lowest median age, women: Utah | 25.2 years | NCFMR FP-26-01, 2026 |
The state range in median age at first marriage runs 5.2 years for men and 7.1 years for women (NCFMR, Westrick-Payne, FP-26-01, 2026). A 27-year-old in Utah and a 27-year-old in Massachusetts sit at opposite ends of their local timeline.
Turnover and stability are separate things. Oklahoma ranks 10th of 51 on the marriage rate and 1st of 51 on the divorce rate, so the state that forms couples fastest also dissolves them fastest. Nevada does something close to the same, at 19th and 2nd.
Utah breaks the pattern, with a record marriage rate alongside a divorce rate of 13.7, below the national 14.2.
State law follows roughly the same map. Property division, spousal support, and the enforceability of premarital agreements differ enough that a marriage in Oklahoma is not on the same terms as one in Maine, which our prenup by state guides cover jurisdiction by jurisdiction.
5. What It Costs to Be Single in Each Metro
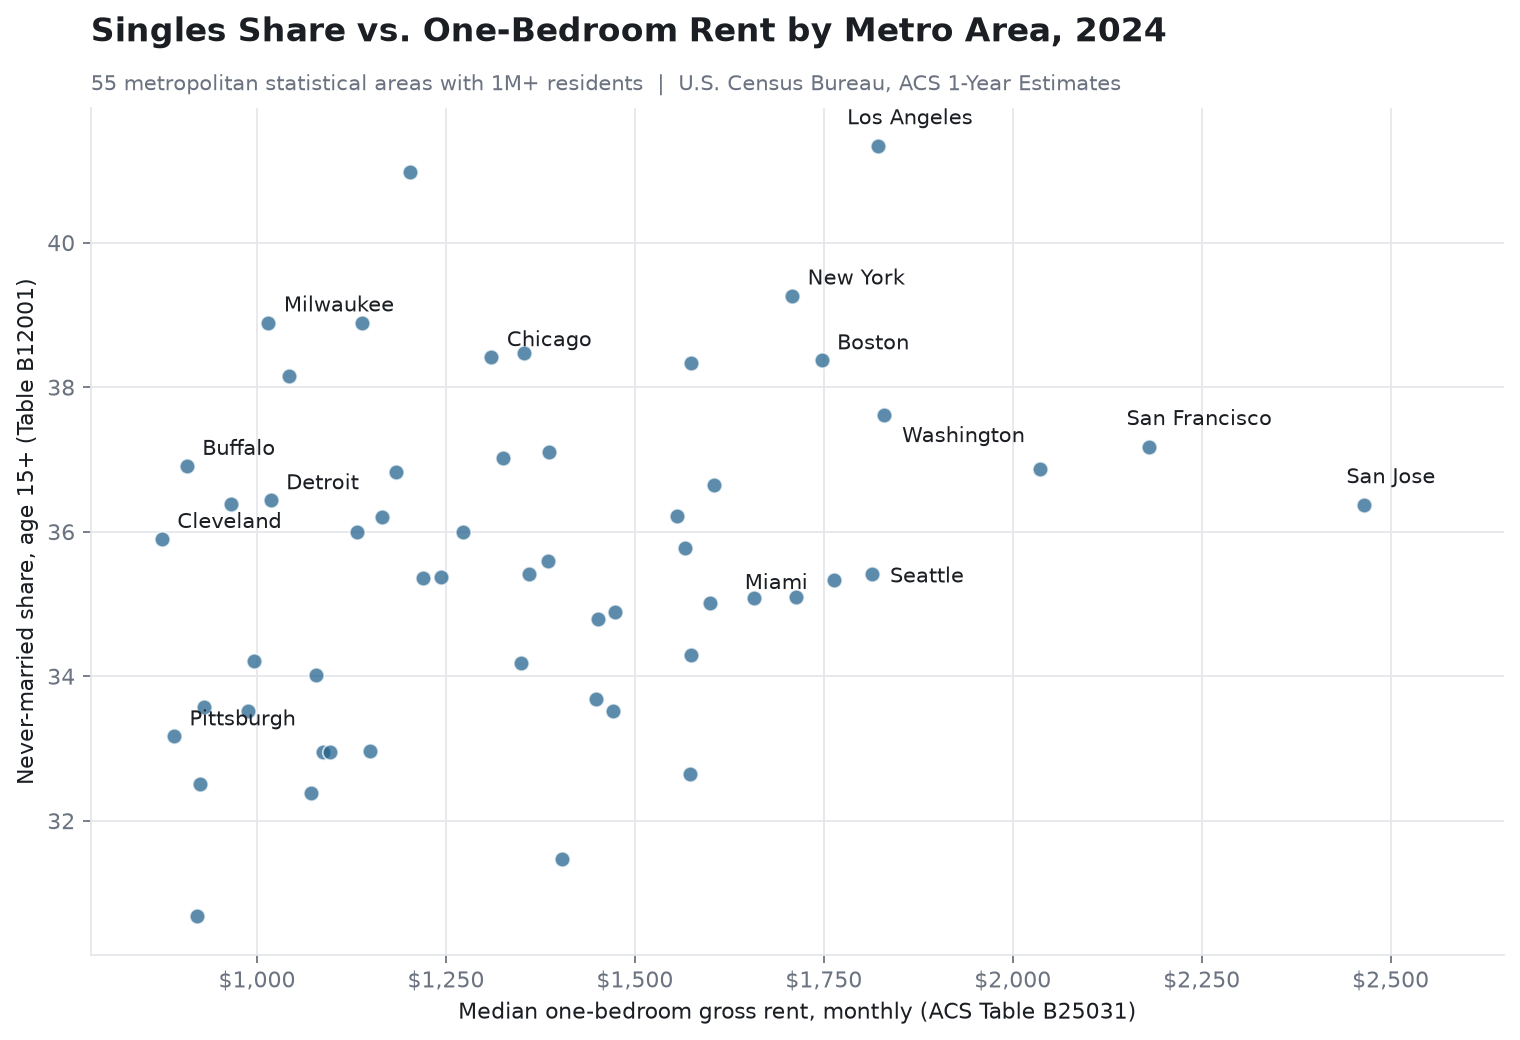
Singles carry the full housing cost that couples split, which reorders any ranking built on singles share alone.
A single-person household spent $19,052 on housing in 2024, while a two-person household spent $29,368, or $14,684 each. The person living alone pays 30% more, and housing absorbs 39.0% of their total spending against 33.4% for the average household.
Rent makes that penalty local. San Jose’s median one-bedroom gross rent is $2,465 against $874 in Cleveland.
| Metric | Value | Source |
| US one-person households | 28.9% of all households | Census ACS Table B11001, 2024 |
| Cleveland, OH metro (highest above 1M) | 35.6% one-person households | Census ACS Table B11001, 2024 |
| Milwaukee-Waukesha, WI metro | 34.2% one-person households | Census ACS Table B11001, 2024 |
| Pittsburgh, PA metro | 34.1% one-person households | Census ACS Table B11001, 2024 |
| US median gross rent, one bedroom | $1,301 per month | Census ACS Table B25031, 2024 |
| San Jose-Sunnyvale-Santa Clara, CA metro | $2,465 per month, one bedroom | Census ACS Table B25031, 2024 |
| San Francisco-Oakland-Fremont, CA metro | $2,180 per month, one bedroom | Census ACS Table B25031, 2024 |
| Boston-Cambridge-Newton, MA-NH metro | $1,747 per month, one bedroom | Census ACS Table B25031, 2024 |
| Cleveland, OH metro | $874 per month, one bedroom | Census ACS Table B25031, 2024 |
| Annual expenditures, single-person household | $48,794 | BLS Consumer Expenditure Survey, 2024 |
| Housing spending, single-person household | $19,052, or 39.0% of expenditures | BLS Consumer Expenditure Survey, 2024 |
| Housing as share of pre-tax income, single person | 37.4% of $50,990 | BLS Consumer Expenditure Survey, 2024 |
The metros where the most people live alone are the cheap ones: Cleveland, Milwaukee, Pittsburgh, and Buffalo all sit below $1,020 for a one-bedroom.
This is the trade-off the rental-brand rankings tend to leave out. Boston city has the second-highest never-married share in the country, and a one-bedroom in the Boston metro runs $1,747 against $874 in Cleveland. Cleveland has more people living alone than any large metro and half the rent, on a smaller and lower-earning pool.
One caveat on the rent column. Gross rent includes utilities and covers occupied units of every age and condition, so it sits well below the advertised rent on new listings that rental-market reports quote.
6. Where Singles Actually Meet: Apps and Venue Density
App adoption is a national number that barely moves. Venue density varies by an order of magnitude between metros, which is the one input to a dating market that is genuinely local.
37% of US adults have ever used an online dating site or app and 6% are current users (SSRS Opinion Panel Omnibus, January 2026). Pew put ever-use at 30% in both 2019 and 2022, so the measure has shifted 7 points in about seven years.
The Milwaukee metro has 30.9 drinking places per 100,000 residents against 5.0 in the Washington, DC metro.
| Metric | Value | Source |
| US adults who have ever used a dating site or app | 37% | SSRS Opinion Panel Omnibus, January 2026 |
| Current users | 6% | SSRS Opinion Panel Omnibus, January 2026 |
| Ever used, ages 30 to 49 | 53% | SSRS Opinion Panel Omnibus, January 2026 |
| Ever used, ages 50 and over | 20% | SSRS Opinion Panel Omnibus, January 2026 |
| Ever used, never-married adults | 52% | Pew Research Center, February 2023 |
| Partnered adults who met on a dating site or app | 10%, rising to 20% among partnered adults under 30 | Pew Research Center, February 2023 |
| Milwaukee-Waukesha, WI metro (densest above 1M) | 30.9 drinking places per 100,000 | BLS QCEW, NAICS 7224, 2024 |
| Omaha, NE-IA metro | 27.4 per 100,000 | BLS QCEW, NAICS 7224, 2024 |
| Portland-Vancouver-Hillsboro, OR-WA metro | 24.9 per 100,000 | BLS QCEW, NAICS 7224, 2024 |
| Boston-Cambridge-Newton, MA-NH metro | 4.6 per 100,000 | BLS QCEW, NAICS 7224, 2024 |
| US drinking places, private sector | 42,624 establishments | BLS QCEW, NAICS 7224, 2024 |
The low end of that column needs care. State liquor licensing pushes venues between two industry codes, so Richmond records 0.6 drinking places per 100,000 while its full-service restaurant density, 80.9 per 100,000, runs above Cleveland’s 72.6.
Adding full-service restaurants (NAICS 722511) reorders the list. Portland leads at 121.5 venues per 100,000, then San Francisco at 120.6 and New York at 110.6, with Fresno last at 52.4 (BLS Quarterly Census of Employment and Wages, 2024). The 2.3-fold spread on that combined measure is the one worth trusting; the 50-fold spread on bars alone is mostly regulation.
Neither number tells you what share of those venues serve singles rather than families, or what happens once anyone is inside. Establishment counts are the best place-level proxy that exists, which is a low bar.
The platform side is covered in more depth in our online dating statistics report.

Summary: Best US Cities for Singles by the Numbers
| Metric | Value | Source |
| Never married, US 15 and over | 34.8% | Census ACS B12001, 2024 |
| Unmarried, US 15 and over | 50.5% | Census ACS B12001, 2024 |
| Unpartnered US adults, 2023 | 42% | Pew Research Center, 2025 |
| Self-reported single | 30% | Pew Research Center, 2023 |
| Highest never-married city: Detroit | 57.4% | Census ACS B12001, 2024 |
| Second: Boston | 56.6% | Census ACS B12001, 2024 |
| Third: Washington, DC | 55.1% | Census ACS B12001, 2024 |
| Lowest never-married city: Port St. Lucie | 27.1% | Census ACS B12001, 2024 |
| Highest never-married metro: Los Angeles | 41.3% | Census ACS B12001, 2024 |
| US unmarried sex ratio | 91.1 men per 100 women | Census ACS B12001, 2024 |
| Peak age-band ratio, 30 to 34 | 118.5 per 100 | Census ACS B12002, 2024 |
| Most male-skewed city: Anchorage | 107.9 per 100 | Census ACS B12001, 2024 |
| Most female-skewed city: Irvine | 77.2 per 100 | Census ACS B12001, 2024 |
| US refined marriage rate | 31.2 per 1,000 unmarried women | NCFMR FP-25-30, 2025 |
| Highest state marriage rate: Utah | 51.7 per 1,000 | NCFMR FP-25-30, 2025 |
| Lowest state marriage rate: Delaware | 20.1 per 1,000 | NCFMR FP-25-30, 2025 |
| US refined divorce rate | 14.2 per 1,000 married women | NCFMR FP-25-31, 2025 |
| Median age at first marriage | 30.8 men, 28.8 women | NCFMR FP-26-01, 2026 |
| US one-person households | 28.9% | Census ACS B11001, 2024 |
| Highest one-person metro: Cleveland | 35.6% | Census ACS B11001, 2024 |
| US median one-bedroom gross rent | $1,301 | Census ACS B25031, 2024 |
| Most expensive metro: San Jose | $2,465 | Census ACS B25031, 2024 |
| Single-person annual expenditures | $48,794 | BLS CE Survey, 2024 |
| Ever used a dating app | 37% | SSRS Opinion Panel, 2026 |
| Densest bar metro: Milwaukee | 30.9 per 100,000 | BLS QCEW, 2024 |
Where a couple settles decides which prenuptial agreement rules apply to them, and those rules are not the same everywhere. Our prenup guides cover California, Florida, Massachusetts, Colorado, Delaware, Maine and Idaho.
Methodology and Sources
- U.S. Census Bureau, American Community Survey 1-Year Estimates, Table B12001 (Sex by Marital Status for the Population 15 Years and Over), 2024. Never-married shares and unmarried sex ratios for the United States, all places with 65,000 or more residents, and all metropolitan statistical areas.
- U.S. Census Bureau, American Community Survey 1-Year Estimates, Table B12002 (Sex by Marital Status by Age for the Population 15 Years and Over), 2024. National never-married shares and unmarried sex ratios by age band.
- U.S. Census Bureau, American Community Survey 1-Year Estimates, Tables B11001 (Household Type) and B25031 (Median Gross Rent by Bedrooms), 2024. One-person household shares and median one-bedroom rents.
- National Center for Family and Marriage Research, Bowling Green State University. Westrick-Payne, K. K., “Refined Marriage Rate in the U.S.: Geographic Variation, 2024,” Family Profile No. 30, 2025.
- National Center for Family and Marriage Research. Westrick-Payne, K. K., “Refined Divorce Rate in the U.S.: Geographic Variation, 2024,” Family Profile No. 31, 2025.
- National Center for Family and Marriage Research. Westrick-Payne, K. K., “Median Age at First Marriage: Geographic Variation, 2024,” Family Profile No. 1, 2026.
- Pew Research Center. Fry, R., “Share of U.S. adults living without a romantic partner has ticked down in recent years,” January 2025. Unpartnered shares for 2019 and 2023.
- Pew Research Center. Vogels, E. A. and McClain, C., “Key findings about online dating in the U.S.,” February 2023, from a survey of 6,034 US adults conducted 5 to 17 July 2022. App adoption by age and marital status, and how partnered adults met.
- Pew Research Center. Gelles-Watnick, R., “For Valentine’s Day, 5 facts about single Americans,” February 2023. Self-reported single share and the share of singles looking.
- SSRS, Opinion Panel Omnibus, fielded 2 to 4 and 16 to 20 January 2026 among 2,012 US adults, margin of error 2.5 percentage points. Current dating app adoption.
- Bureau of Labor Statistics, Consumer Expenditure Survey, 2024. Expenditures, housing costs, and pre-tax income for single-person and two-person consumer units.
- Bureau of Labor Statistics, Quarterly Census of Employment and Wages, annual 2024, private ownership, NAICS 7224 (drinking places) and 722511 (full-service restaurants), metropolitan statistical area level.
Rankings on this page were calculated from the ACS estimate tables listed above rather than taken from another publisher.
The city ranking covers the 92 incorporated places with 250,000 or more residents in the 50 states and the District of Columbia. Census-designated places that are not incorporated cities, among them Urban Honolulu and Enterprise, Nevada, were dropped, along with all Puerto Rico geographies. Metro rankings cover the 55 metropolitan statistical areas with one million or more residents on the same footprint.
City-proper and metro figures are reported separately throughout and are not interchangeable.

Three denominators appear on this page and none can be compared with the others. The ACS never-married share counts people aged 15 and over who have never legally married. Pew’s unpartnered share counts adults 18 and over who do not live with a spouse or partner, and Pew’s self-reported single share counts adults who describe themselves as not married, cohabiting, or in a committed relationship.
ACS 2024 1-year estimates are the newest place-level vintage; the 2025 release is scheduled for autumn 2026.
Pew’s core online dating dataset comes from a July 2022 survey and is the most recent available from that source, which is why it appears alongside the January 2026 SSRS poll.
Every ACS estimate carries a margin of error, and those widen for smaller places. A gap of under one percentage point between two similarly sized cities is not a ranking, and we would not read Washington, DC at 55.10% and Milwaukee at 55.10% as a tie so much as a coin toss.
We update this page annually when new ACS and NCFMR vintages are released. More research is collected in our relationship and dating statistics hub.



