


17% of U.S. newlyweds married someone of a different race or ethnicity in 2015, while 10% of all married Americans were intermarried (Pew Research Center, Intermarriage in the U.S. 50 Years After Loving v. Virginia, 2017). Those two figures describe the same country at the same moment. The newlywed rate measures who is marrying now; the all-married rate is dragged down by decades of earlier marriages.
In 1967, the year the Supreme Court struck down state bans on interracial marriage in Loving v. Virginia, the newlywed figure was 3%.
Approval moved further than behavior. Gallup recorded 4% approval of marriage between Black and White Americans in 1958 and 94% in 2021, one of the largest opinion shifts in its 63-year trend.
We aggregated data from the Pew Research Center, the U.S. Census Bureau’s American Community Survey and decennial census, Gallup, the CDC’s National Survey of Family Growth, and peer-reviewed analyses in Family Relations and Demographic Research.
Key Takeaways
- 17% of U.S. newlyweds intermarried in 2015, up from 3% in 1967 and 7% in 1980 (Pew Research Center, 2017).
- 10% of all married Americans were intermarried in 2015, about 11 million people, against 3% and 3 million in 1980 (Pew Research Center, 2017).
- 29% of Asian newlyweds and 27% of Hispanic newlyweds intermarried, against 18% of Black and 11% of White newlyweds (Pew Research Center, 2015 newlyweds).
- 36% of Asian women who married in 2015 intermarried, against 21% of Asian men; among Black newlyweds the split runs the other way, 24% of men and 12% of women (Pew Research Center, 2017).
- 42% of intermarried newlyweds were one Hispanic and one White spouse, the single largest combination (Pew Research Center, 2017).
- Honolulu recorded the highest metro intermarriage rate at 42%, followed by Las Vegas at 31% (Pew Research Center analysis of ACS data, 2017).
- Interracial and interethnic married-couple households rose from 7.4% to 10.2% of all married-couple households between 2000 and 2012 to 2016, and every state increased (U.S. Census Bureau, SEHSD Working Paper 2018-11).
- 31% of married same-sex couples were interracial in 2022, against 19% of married opposite-sex couples (U.S. Census Bureau, American Community Survey 2022).
- Gallup approval of Black-White marriage reached 94% in 2021, up from 4% in 1958 and 87% in 2013 (Gallup, 2021).
- There is no single interracial divorce rate. Compared with White/White couples, Black husband and White wife marriages were about twice as likely to divorce by year 10, while White husband and Black wife marriages were 44% less likely (Bratter and King, Family Relations 2008).
- 14% of U.S. infants were multiracial or multiethnic in 2015, nearly triple the 5% share in 1980 (Pew Research Center, 2017).
- The population identifying with two or more races grew from 9 million in 2010 to 33.8 million in 2020, an increase driven partly by a redesigned census question (U.S. Census Bureau, 2020 Census).
1. How Common Interracial Marriage Is
Two numbers get quoted for this and they are both right. The newlywed rate counts marriages formed in a single year; the all-married rate counts every marriage still standing, including couples who married in the 1970s when intermarriage was rare.
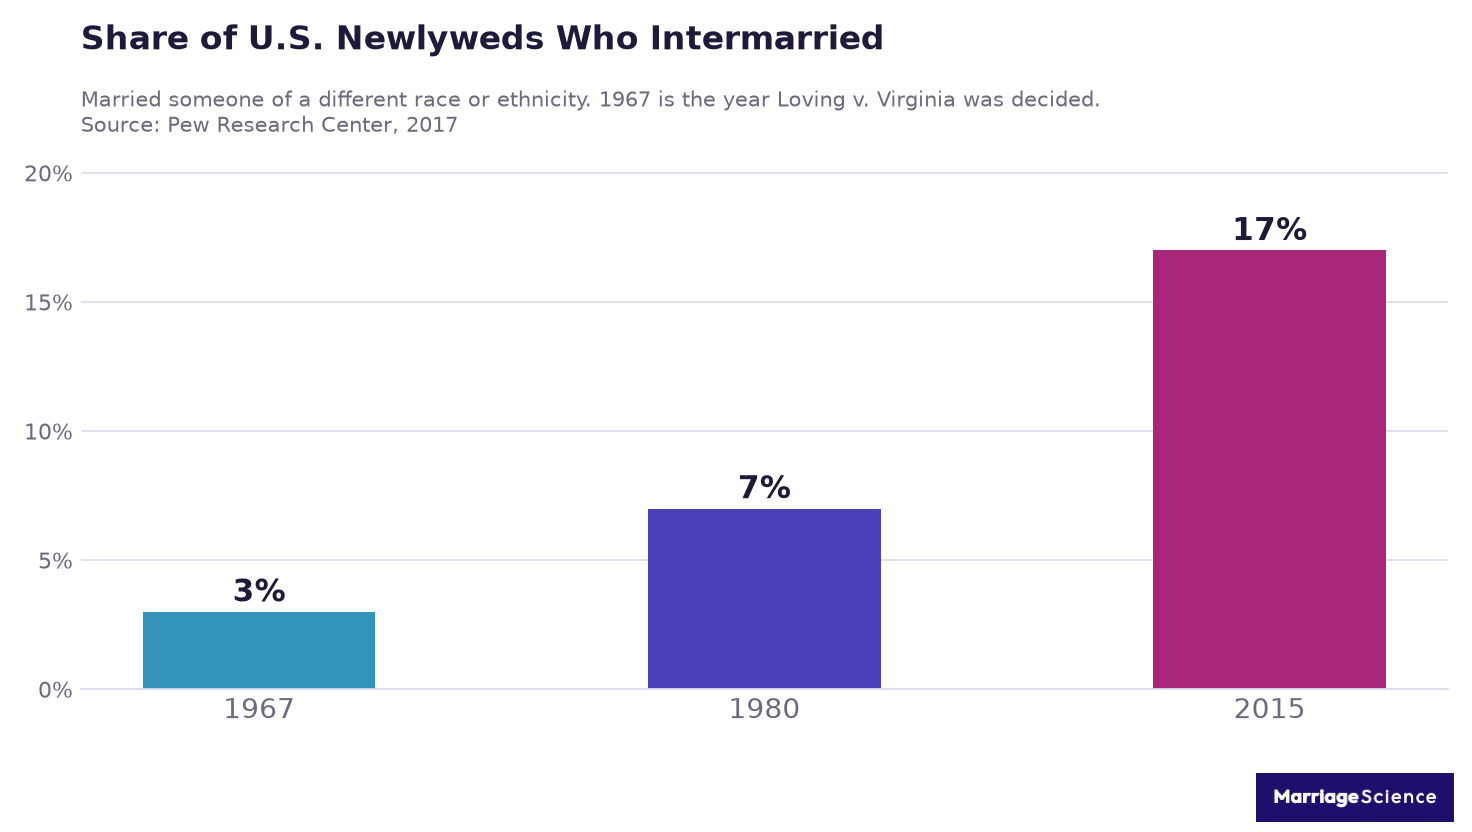
The newlywed rate has risen more than fivefold since 1967, while the all-married rate has roughly tripled. The gap between the two is the clearest measure of how recent the change is.
| Metric | Value | Source |
| Newlyweds intermarried, 2015 | 17%, about 670,000 people | Pew Research Center, 2017 |
| Newlyweds intermarried, 1980 | 7%, about 230,000 people | Pew Research Center, 2017 |
| Newlyweds intermarried, 1967 | 3% | Pew Research Center, 2017 |
| All married people intermarried, 2015 | 10%, about 11 million | Pew Research Center, 2017 |
| All married people intermarried, 1980 | 3%, about 3 million | Pew Research Center, 2017 |
| Interracial or interethnic married-couple households, 2000 and 2012 to 2016 | 7.4% and 10.2% | U.S. Census Bureau, SEHSD Working Paper 2018-11 |
| States that increased between those periods | all 50 | U.S. Census Bureau, SEHSD 2018-11 |
| Married same-sex couples who were interracial, 2022 | 31%, against 19% of opposite-sex couples | U.S. Census Bureau, ACS 2022 |
The household measure and the newlywed measure are counting different things and land three percentage points apart in the same period, which is worth remembering before comparing figures across sources (U.S. Census Bureau, SEHSD Working Paper 2018-11). Our marriage statistics roundup covers the overall marriage trend these shares sit inside.
2. Who Intermarries: Race, Gender and Education
The aggregate rate hides two things that matter more than the headline. Rates differ by a factor of nearly three across racial groups, and inside two of those groups men and women behave very differently.
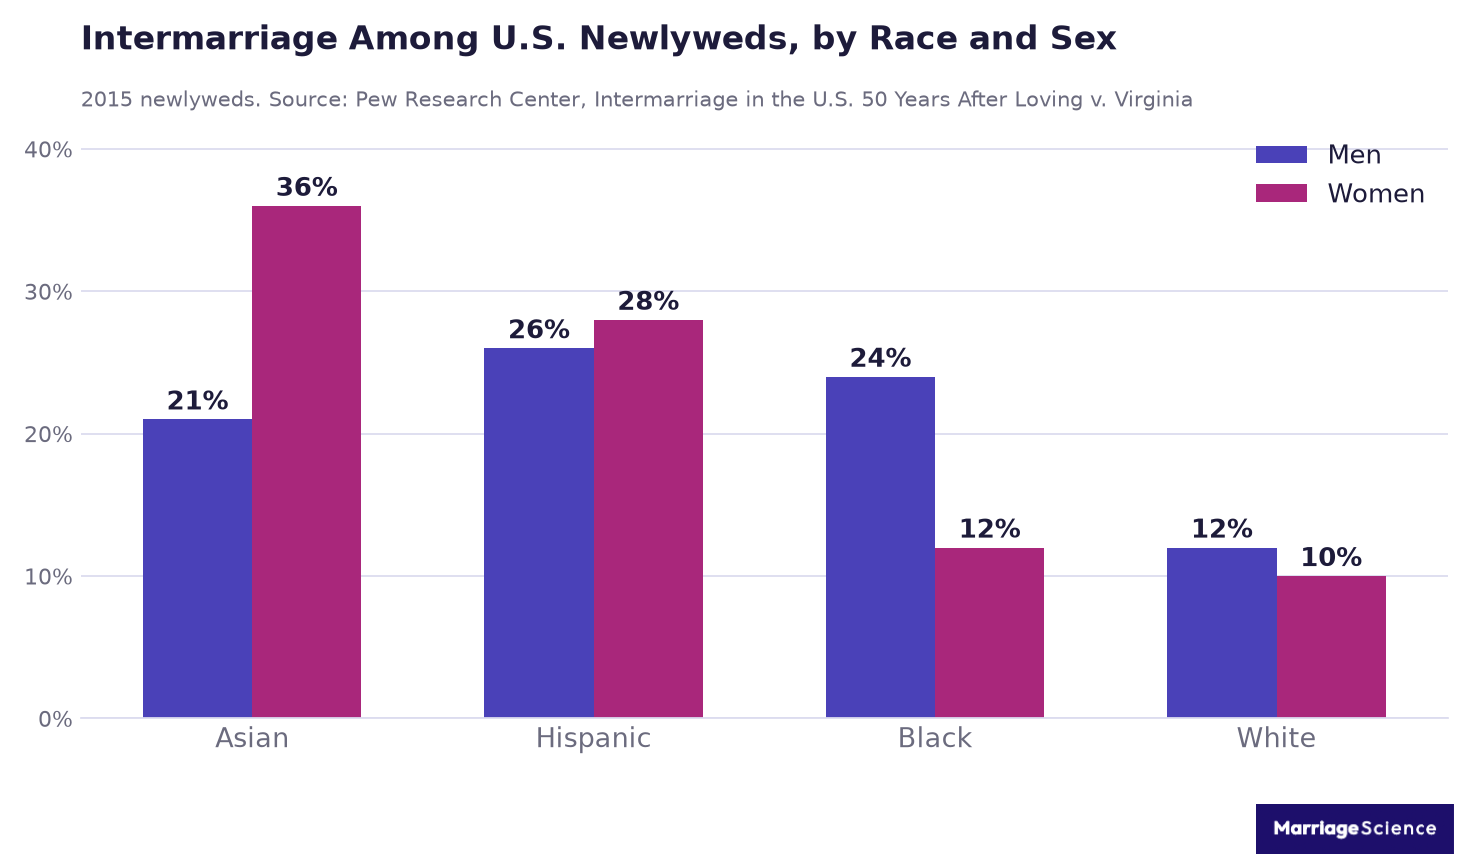
Asian women intermarried at 36% and Asian men at 21%; Black men at 24% and Black women at 12%. The two gaps run in opposite directions and are the largest in the data.
| Metric | Value | Source |
| Asian newlyweds intermarried | 29% overall, 36% of women and 21% of men | Pew Research Center, 2015 newlyweds |
| Hispanic newlyweds intermarried | 27% overall, 28% of women and 26% of men | Pew Research Center, 2017 |
| Black newlyweds intermarried | 18% overall, 24% of men and 12% of women | Pew Research Center, 2017 |
| White newlyweds intermarried | 11% overall, 12% of men and 10% of women | Pew Research Center, 2017 |
| Black newlyweds intermarried, 1980 | 5% | Pew Research Center, 2017 |
| U.S.-born Hispanic and U.S.-born Asian newlyweds | 39% and 46% | Pew Research Center, 2017 |
| Intermarried by education, high school or less | 14% | Pew Research Center, 2017 |
| Intermarried by education, bachelor’s degree or higher | 19% | Pew Research Center, 2017 |
Nativity does more work than education here. U.S.-born Asian newlyweds intermarried at 46% against 29% for the group as a whole, and U.S.-born Hispanics at 39% against 27%, because immigrants are far more likely to arrive already married or to marry within an immigrant community (Pew Research Center, 2017).
The education gradient is real but modest, five percentage points across the whole range. It is smaller than the gap between any two racial groups in the table above.
3. The Most Common Pairings
Public discussion of interracial marriage is dominated by Black-White couples, who are the smallest of the three main combinations.
42% of intermarried newlyweds were one Hispanic and one White spouse, against 11% who were Black and White.
| Metric | Value | Source |
| Hispanic and White | 42% of intermarried newlyweds | Pew Research Center, 2017 |
| Asian and White | 15% | Pew Research Center, 2017 |
| Black and White | 11% | Pew Research Center, 2017 |
| White husband and Hispanic wife | 22% | Pew Research Center, 2017 |
| White wife and Hispanic husband | 20% | Pew Research Center, 2017 |
| White husband and Asian wife | 11% | Pew Research Center, 2017 |
| White wife and Asian husband | 4% | Pew Research Center, 2017 |
The bottom two rows show the same asymmetry as section 2 from the other side. White and Asian couples are nearly three times as likely to pair a White husband with an Asian wife as the reverse, while White and Hispanic couples split almost evenly (Pew Research Center, 2017).
One caveat on the Hispanic figures. Federal statistics record Hispanic origin as an ethnicity, not a race, so a White Hispanic marrying a White non-Hispanic counts as intermarriage here while a Black Hispanic marrying a Black non-Hispanic also does. That definitional choice is why the largest pairing is the one it is. Readers curious about where couples of any kind now meet can see our dating app statistics.
4. Geographic Variation
Local marriage markets explain most of the spread. Metro areas with no numerically dominant group produce the highest rates, and the national figure sits closer to the low end than the high.
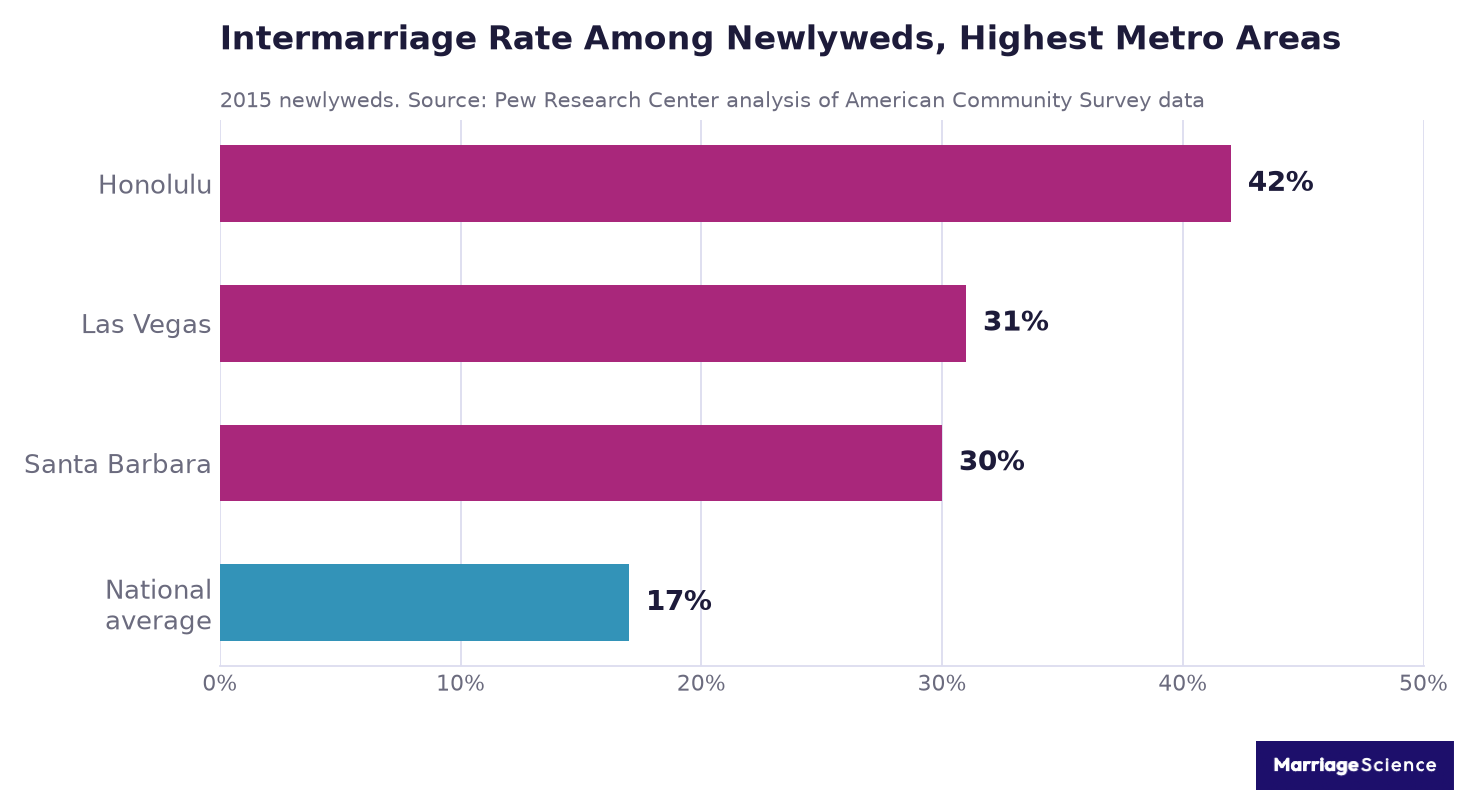
Honolulu’s 42% is two and a half times the national rate. Its marriage market is 42% Asian, 20% non-Hispanic White and 9% Hispanic, with no group anywhere near a majority.
| Metric | Value | Source |
| Honolulu newlyweds intermarried | 42% | Pew Research Center, 2017 |
| Las Vegas newlyweds intermarried | 31% | Pew Research Center, 2017 |
| Santa Barbara newlyweds intermarried | 30% | Pew Research Center, 2017 |
| Metro versus non-metro newlyweds | 18% and 11% | Pew Research Center, 2017 |
| Largest state increases in interracial households, 2000 to 2012-2016 | Hawaii, Oklahoma and D.C., up 4.34 points or more | U.S. Census Bureau, SEHSD 2018-11 |
| States with the smallest increases | 22 states, up less than 2.40 points | U.S. Census Bureau, SEHSD 2018-11 |
| Most common combination by county growth | non-Hispanic White with Hispanic, up in 43.2% of counties | U.S. Census Bureau, SEHSD 2018-11 |
Same-sex couples sit well above the national figure everywhere it has been measured, at 31% interracial against 19% for opposite-sex couples (U.S. Census Bureau, ACS 2022). Our page on same-sex divorce rates covers the rest of that population’s demographics.
5. Public Attitudes Since 1958
Gallup has asked the same question since 1958, which makes this one of the longest continuous opinion series in American polling.
Approval of marriage between Black and White Americans went from 4% to 94% across 63 years. The last decade of that movement came almost entirely from White respondents, whose approval rose to 93% while non-White approval sat at 96% and had been flat.
| Metric | Value | Source |
| Approve of Black-White marriage, 1958 | 4% | Gallup, 2021 |
| Approve, 2013 | 87% | Gallup, 2021 |
| Approve, 2021 | 94% | Gallup, 2021 |
| Approval by race, 2021 | 93% of White adults, 96% of non-White adults | Gallup, 2021 |
| Say more intermarriage is good for society | 39%, up from 24% in 2010 | Pew Research Center, 2017 |
| Would oppose a close relative marrying someone of a different race | 10%, down from 31% in 2000 | Pew Research Center, 2017 |
Read the last two rows against each other. Nearly universal approval in the abstract coexists with 10% who would object within their own family, and only 39% willing to call the trend good for society (Gallup, 2021).
The Gallup question also has a known ceiling problem. Once a measure reaches 94%, the remaining movement is inside the margin of error, and the series stops being able to detect anything.
That is why the Pew items matter more now than the headline approval number. Asking whether someone would object to a relative marrying out, or whether the trend is good for the country, still produces variation; asking whether they approve does not.
None of these questions measures behavior. Approval had already reached 87% by 2013, while the newlywed intermarriage rate Pew measured two years later was 17%, so the two series sit on entirely different scales and neither one predicts the other.

6. Divorce Risk and Marital Stability
This is where most coverage of the topic goes wrong. A single interracial divorce rate exists in the aggregate and tells you almost nothing, because the result flips depending on which spouse is which race.
Compared with White/White couples, marriages with a Black husband and White wife were about twice as likely to divorce by year 10, while marriages with a White husband and Black wife were 44% less likely. Both figures come from the same model, on the same data, adjusted for the same controls.
| Metric | Value | Source |
| Divorce hazard by year 10, Black husband and White wife (vs White/White) | 2.08x | Bratter and King, Family Relations 57(2), 2008 |
| Divorce hazard, White husband and Black wife | 0.56x | Bratter and King, 2008 |
| Divorce hazard, Asian husband and White wife | 1.60x | Bratter and King, 2008 |
| Divorce hazard, White husband and Asian wife | 1.04x | Bratter and King, 2008 |
| Divorce hazard, White and Hispanic White couples | 0.95x, statistically similar to White/White | Bratter and King, 2008 |
| Divorced by year 10, 1985 to 1989 marriage cohort | 55.0% of interracial couples, 35.6% of same-race couples | Bratter and King, 2008 |
| Divorced by year 10, pre-1980 marriage cohort | 46.3% of interracial couples, 51.1% of same-race couples | Bratter and King, 2008 |
| Marital dissolution odds, White-Hispanic couples (vs White/White) | 1.35x | Choi, Goldberg and Denice, Demographic Research 46(33), 2022 |
| Marital dissolution odds, White-Black couples | 1.54x, confidence interval 0.89 to 2.66 | Choi, Goldberg and Denice, 2022 |
The 2022 reanalysis is the one to cite now, because its data run through 2019 while Bratter and King stop at 2002. Its White-Black estimate has a confidence interval that crosses 1, so the higher figure is not statistically distinguishable from no gap at all (Choi, Goldberg and Denice, Demographic Research 46(33), 2022).
Every figure in the table is an association. Interracial couples in these samples differ from same-race couples on age at marriage, education, prior marriage and premarital cohabitation, and the models adjust for some of that but cannot separate the effect of crossing a racial line from the effect of everything correlated with doing so. Bratter and King say as much in their own discussion.
The oldest cohort in the table also reverses the pattern entirely: among couples marrying before 1980, interracial marriages were slightly less likely to end by year 10 than same-race ones. See our divorce statistics page for the national rates all of this sits against.
7. Children and the Multiracial Population
The multiracial population grew almost fourfold between two censuses, and a large share of that is a change in how the question was asked, not a change in who exists.
33.8 million people identified with two or more races in 2020, against 9 million in 2010. The Census Bureau redesigned the race and ethnicity questions and the coding procedures between those two counts.
| Metric | Value | Source |
| Population identifying with two or more races, 2010 and 2020 | 9 million and 33.8 million | U.S. Census Bureau, 2020 Census |
| Increase | 276% | U.S. Census Bureau, 2020 Census |
| Hispanic share of that growth | from 3 million to more than 20 million, almost two thirds of the multiracial total | U.S. Census Bureau, 2020 Census |
| U.S. infants who are multiracial or multiethnic, 2015 | 14% | Pew Research Center, 2017 |
| U.S. infants who were multiracial or multiethnic, 1980 | 5% | Pew Research Center, 2017 |
Treat the 276% figure carefully. The Census Bureau itself attributes much of the change to improvements in the questions and coding, not to demographic change, and comparing 2010 with 2020 on this measure is not like for like (U.S. Census Bureau, 2020 Census release, August 2021).
The infant series is the cleaner indicator of family change, because it is measured the same way across decades and counts births instead of asking adults to describe themselves.
Summary: Interracial Relationships by the Numbers
| Metric | Value | Source |
| U.S. newlyweds intermarried, 2015 | 17% | Pew Research Center, 2017 |
| U.S. newlyweds intermarried, 1967 | 3% | Pew Research Center, 2017 |
| All married Americans intermarried, 2015 | 10%, about 11 million | Pew Research Center, 2017 |
| Asian newlyweds intermarried | 29% | Pew Research Center, 2017 |
| Hispanic newlyweds intermarried | 27% | Pew Research Center, 2017 |
| Black newlyweds intermarried | 18% | Pew Research Center, 2017 |
| White newlyweds intermarried | 11% | Pew Research Center, 2017 |
| Asian women and Asian men intermarried | 36% and 21% | Pew Research Center, 2017 |
| Black men and Black women intermarried | 24% and 12% | Pew Research Center, 2017 |
| U.S.-born Asian newlyweds intermarried | 46% | Pew Research Center, 2017 |
| Largest pairing, Hispanic and White | 42% of intermarried newlyweds | Pew Research Center, 2017 |
| Black and White pairings | 11% of intermarried newlyweds | Pew Research Center, 2017 |
| Highest metro rate, Honolulu | 42% | Pew Research Center, 2017 |
| Metro and non-metro rates | 18% and 11% | Pew Research Center, 2017 |
| Interracial married-couple households, 2000 and 2012-2016 | 7.4% and 10.2% | U.S. Census Bureau, SEHSD 2018-11 |
| Married same-sex couples who were interracial, 2022 | 31%, against 19% of opposite-sex couples | U.S. Census Bureau, ACS 2022 |
| Gallup approval of Black-White marriage, 1958 and 2021 | 4% and 94% | Gallup, 2021 |
| Divorce hazard, Black husband and White wife vs White/White | 2.08x | Bratter and King, 2008 |
| Divorce hazard, White husband and Black wife vs White/White | 0.56x | Bratter and King, 2008 |
| Multiracial population, 2010 and 2020 | 9 million and 33.8 million | U.S. Census Bureau, 2020 Census |
Methodology and Sources
Every figure here comes from a federal statistical agency, a national polling organization with a documented trend, or a peer-reviewed analysis of national survey microdata. We excluded dating-app press releases and the “interracial dating statistics” listicles that recycle them.
- G. Livingston and A. Brown, Intermarriage in the U.S. 50 Years After Loving v. Virginia, Pew Research Center, May 2017, analysing American Community Survey and decennial census data.
- U.S. Census Bureau, Examining Change in the Percent of Married-Couple Households that are Interracial and Interethnic: 2000 to 2012-2016, SEHSD Working Paper 2018-11.
- U.S. Census Bureau, 2020 Census Statistics Highlight Local Population Changes and Nation’s Racial and Ethnic Diversity, August 2021.
- Gallup, U.S. Approval of Interracial Marriage at New High of 94%, fieldwork July 2021.
- J. L. Bratter and R. B. King, “But Will It Last?”: Marital Instability Among Interracial and Same-Race Couples, Family Relations 57(2), 2008, using the 2002 National Survey of Family Growth.
- K. H. Choi, R. E. Goldberg and P. A. Denice, Stability and Outcome of Interracial Cohabitation Before and After Transitions to Marriage, Demographic Research 46(33), 2022, using the 2002 and 2006 to 2019 National Survey of Family Growth.
- U.S. Census Bureau, Some Demographic and Economic Characteristics of Male and Female Same-Sex Couples Differed, American Community Survey 2022.
Two definitional points govern everything above. Newlywed rates run roughly double the all-married rate and the two get swapped constantly, so check which one a figure describes before comparing it with anything. And Hispanic origin is recorded as an ethnicity, not a race, which is why a White Hispanic marrying a White non-Hispanic is counted here as intermarriage.
Census race and ethnicity questions changed in 2000, when respondents could first select more than one race, and again for 2020. Long trend lines that cross those breaks are not like for like, which is the main reason we report dated comparison points instead of continuous series.
The Pew analysis is the most recent full treatment of intermarriage patterns and its data run to 2015. Pew has not published an equivalent update, so a new edition and the 2020 Census detailed demographic tables are the releases most likely to change this page. We update it annually. The rest of our research sits on the Marriage Science statistics hub.



