


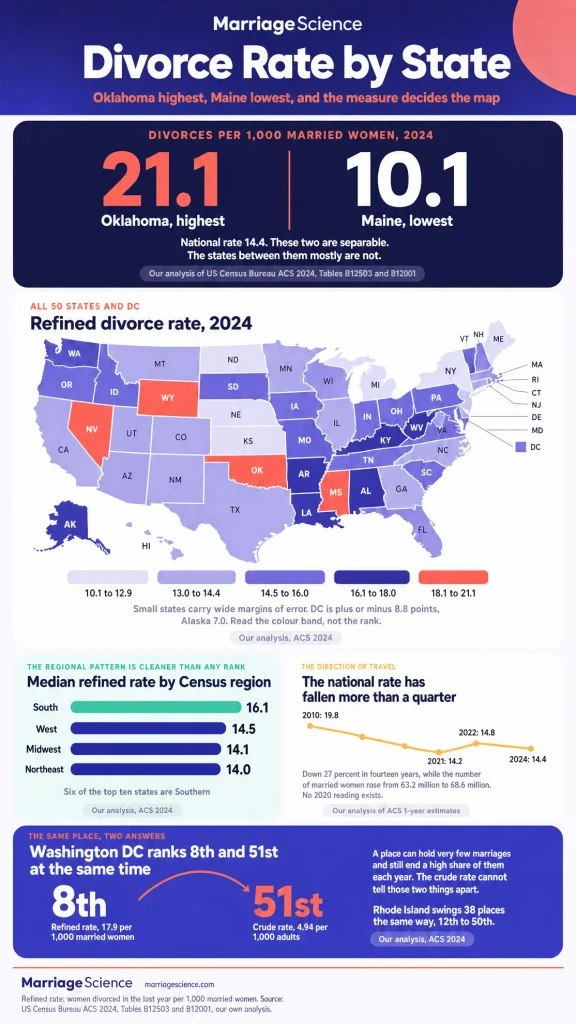
TL;DR: Oklahoma has the highest divorce rate in the country and Maine the lowest, on the measure most demographers use. Swap to the other common measure and the rankings scramble, with Washington DC moving from eighth place to last.
Oklahoma recorded 21.1 divorces per 1,000 married women in 2024, against 10.1 in Maine (our own analysis of US Census Bureau, American Community Survey 2024, Tables B12503 and B12001).
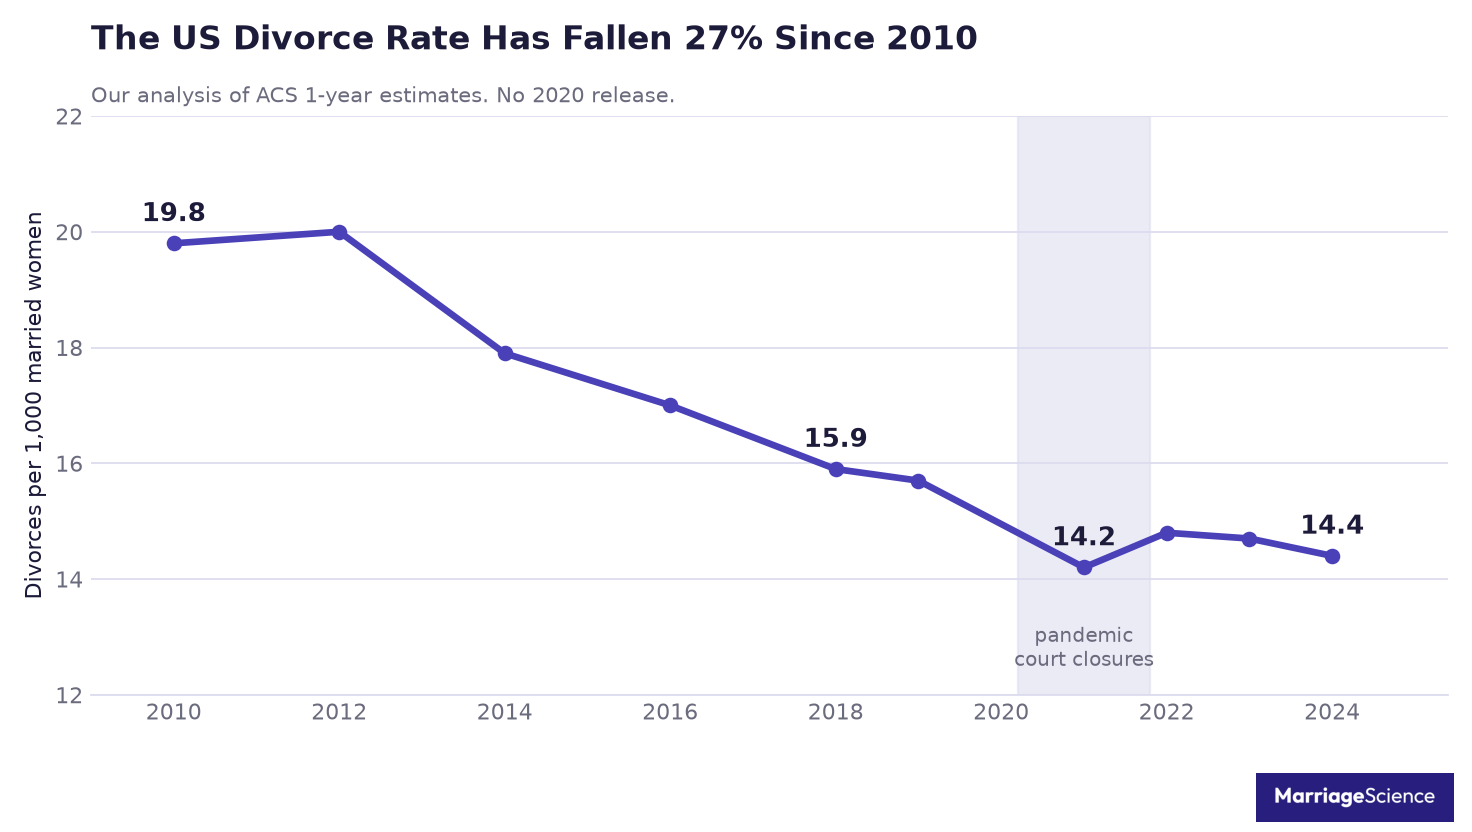
The national figure is 14.4, and it has fallen by more than a quarter since 2010.
Almost every ranking you will find online quotes one number per state and stops there. That hides the thing that actually matters, which is that two defensible definitions of the divorce rate produce two different maps of the country.
We queried the Census API directly, computed both measures for all 50 states and the District of Columbia, and checked every ranking against its margin of error before naming it. The definitions are written out below so anyone can reproduce them.
Key Divorce Rate by State Statistics
- Oklahoma has the highest refined divorce rate at 21.1 per 1,000 married women (our analysis, ACS 2024).
- Maine has the lowest at 10.1, less than half Oklahoma’s rate (our analysis, ACS 2024).
- The national refined rate was 14.4 in 2024, down from 19.8 in 2010 (our analysis, ACS 1-year series).
- 1,868,585 Americans divorced in the past year, 986,810 women and 881,775 men (ACS 2024, Table B12503).
- That is down from 2,358,274 divorces in 2010, a fall of 21% while the adult population grew by 32 million (our analysis, ACS 1-year series).
- Nevada, Mississippi, Wyoming and Alabama follow Oklahoma at 20.3, 19.6, 19.1 and 18.4 (our analysis, ACS 2024).
- Wisconsin, New Jersey, Idaho and South Carolina join Maine at the bottom at 10.9, 11.2, 11.3 and 11.8 (our analysis, ACS 2024).
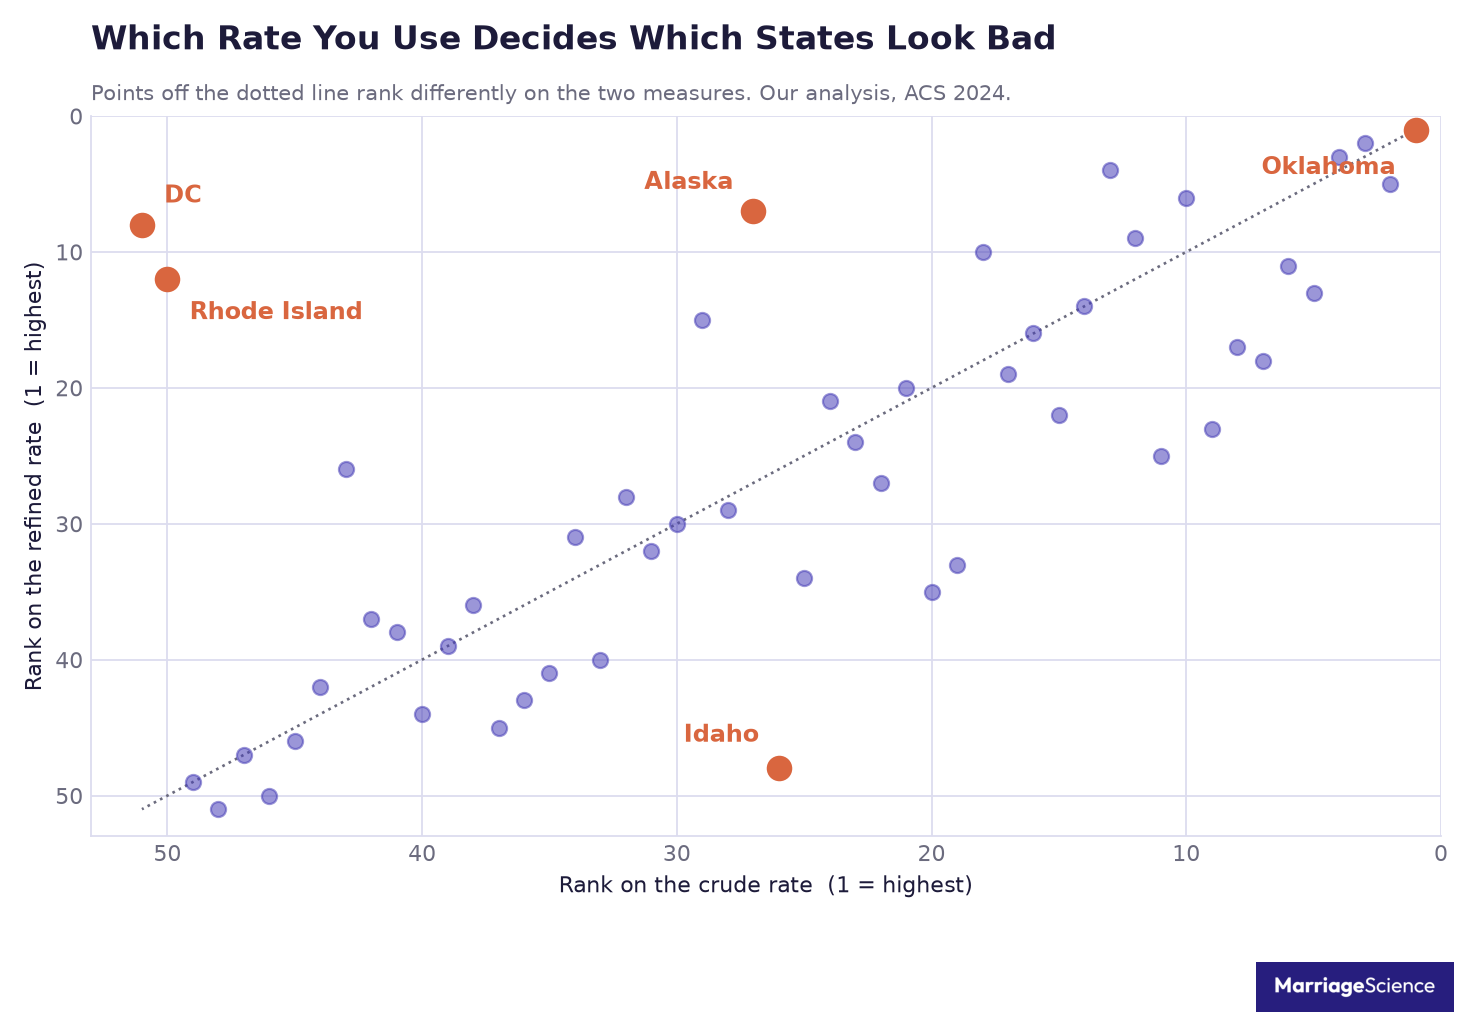
- The District of Columbia ranks 8th on one measure and 51st on the other, a swing of 43 places (our analysis, ACS 2024).
- Rhode Island swings 38 places between the two measures, from 12th to 50th (our analysis, ACS 2024).
- California recorded the most divorces of any state at 192,400, followed by Texas at 184,326 and Florida at 135,707 (ACS 2024, Table B12503).
- The crude divorce rate fell from 9.51 to 6.66 per 1,000 adults between 2010 and 2024 (our analysis, ACS 1-year series).
- The number of married women rose from 63.2 million to 68.6 million across the same period while divorces fell (our analysis, ACS 1-year series).
- The margin of error reaches 8.8 points in the District of Columbia and 7.0 in Alaska, so small-state rankings carry real uncertainty (our analysis, ACS 2024).
- Oklahoma and Maine are separable, the top five are not separable from each other once margins of error are applied (our analysis, ACS 2024).
- There was no 2020 ACS one-year release, so no state divorce rate exists for that year (US Census Bureau).
There Is No Single Divorce Rate by State
Two measures are in common use and they answer different questions.
The refined rate counts women who divorced in the past twelve months per 1,000 women who are currently married. It asks how likely an existing marriage is to end this year, which is what most people mean when they ask about divorce risk.
The crude rate counts every divorce per 1,000 adults aged 15 and over. It asks how much divorce there is in a place, which depends as much on how many people are married as on how those marriages go.
A state where almost nobody marries will always look calm on the crude measure, because there are few marriages available to end. The refined rate strips that out.
The gap between the two is not small. Oklahoma leads on both, but Alabama is second on the crude rate and fifth on the refined one, while Rhode Island is twelfth on the refined rate and second from last on the crude.
We report the refined rate as the headline throughout, because it is the one that answers the question people are actually asking, and we show the crude rate alongside it so you can see where the two disagree.
| Measure | Definition | US value, 2024 |
| Refined divorce rate | Women divorced in the last year per 1,000 married women | 14.4 |
| Crude divorce rate | All divorces in the last year per 1,000 people aged 15 and over | 6.66 |
| Total divorces | Count of people who divorced in the last year | 1,868,585 |
There is a third number in circulation as well, the raw count of divorces, and it points at completely different states.
California recorded 192,400 divorces in the past year, more than any other state. Texas follows at 184,326 and Florida at 135,707.
None of those three appears anywhere near the top of the rate table. California sits 36th on the refined rate at 13.3, below the national average.
New York and Pennsylvania complete the top five by count at 93,140 and 68,103, and both sit in the bottom quarter of the rate table.
They lead on volume because they are the three largest states. Oklahoma, which leads on rate, recorded 32,121 divorces, roughly a sixth of California’s total.
If you are a lawyer sizing a market, the count is the number you want. If you are a person wondering about your own marriage, it tells you nothing at all.
| State | Divorces in the last year | Refined rank |
| California | 192,400 | 36th |
| Texas | 184,326 | 19th |
| Florida | 135,707 | 24th |
| New York | 93,140 | 42nd |
| Pennsylvania | 68,103 | 40th |
| Oklahoma | 32,121 | 1st |
The States With the Highest Divorce Rate
Oklahoma leads at 21.1 divorces per 1,000 married women, about 47% above the national figure of 14.4.
Nevada follows at 20.3, then Mississippi at 19.6, Wyoming at 19.1 and Alabama at 18.4. Arkansas, Alaska and the District of Columbia round out the top eight.
The order inside that group is not solid. Nevada’s margin of error is 4.0 points and Wyoming’s is 5.7, so any of the top five could be first on a different draw of the same survey.
What is solid is the grouping. The South and the Mountain West dominate the top of the table, and no Northeastern state except the District of Columbia and Rhode Island appears in the top twelve.
Oklahoma’s position is the least ambiguous of the high group. Its margin of error is 2.6 points, tighter than every other state above 18, so it is the one top-five entry that is not a coin flip.
Six of the top ten are Southern. That is a larger concentration than chance would produce from 17 Southern jurisdictions out of 51.
| State | Refined rate | Margin of error |
| Oklahoma | 21.1 | 2.6 |
| Nevada | 20.3 | 4.0 |
| Mississippi | 19.6 | 4.4 |
| Wyoming | 19.1 | 5.7 |
| Alabama | 18.4 | 2.3 |
| Arkansas | 18.2 | 3.5 |
| Alaska | 17.9 | 7.0 |
| District of Columbia | 17.9 | 8.8 |
The States With the Lowest Divorce Rate
Maine sits at the bottom with 10.1, under half of Oklahoma’s rate and well outside the margin of error separating the two.
Wisconsin follows at 10.9, then New Jersey at 11.2, Idaho at 11.3 and South Carolina at 11.8.
That bottom group is a stranger mix than the top one. Maine and New Jersey come from the Northeast, Wisconsin from the Midwest, Idaho from the Mountain West, and South Carolina is the single Southern state to reach the bottom five while its neighbors fill the top of the table.
New Jersey is the tightest estimate in the bottom group with a margin of error of 1.3 points, which makes it the most dependable low reading on the table. Maine’s own margin is 2.5, so its exact rank is looser than its position suggests.
Whatever drives a low divorce rate, it is not a single regional culture. Our page on the average marriage age shows Idaho and Maine at opposite ends of that measure while they sit within one point of each other here.
| State | Refined rate | Margin of error |
| Maine | 10.1 | 2.5 |
| Wisconsin | 10.9 | 1.8 |
| New Jersey | 11.2 | 1.3 |
| Idaho | 11.3 | 2.5 |
| South Carolina | 11.8 | 1.9 |
| Montana | 11.9 | 4.0 |
| Minnesota | 12.2 | 1.5 |
| Michigan | 12.3 | 1.3 |
Washington DC Ranks 8th and 51st at the Same Time
This is the clearest demonstration that the measure decides the answer.
On the refined rate the District of Columbia is 8th highest in the country at 17.9. On the crude rate it is 51st out of 51, the lowest divorce rate in America at 4.94 per 1,000 adults.
The mechanism is simple once you see it. A jurisdiction can hold very few marriages and still end a high share of them each year, and the crude rate cannot tell those two things apart.
Both numbers are correct. DC has a small married population relative to its adult population, so there are few marriages to end, which pushes the crude rate down. Among the marriages that do exist, divorce is common, which pushes the refined rate up.
Rhode Island does the same thing at 12th and 50th, a swing of 38 places. Idaho runs the opposite way, 48th on the refined rate and 26th on the crude one.
Any article that gives you one ranked list of states without saying which rate it used has quietly made this choice for you.
| Jurisdiction | Refined rank | Crude rank |
| District of Columbia | 8th | 51st |
| Rhode Island | 12th | 50th |
| Alaska | 7th | 27th |
| Connecticut | 26th | 43rd |
| Idaho | 48th | 26th |
| Colorado | 25th | 11th |
The South Divorces More Than Any Other Region
Grouping the states into the four Census regions makes the pattern much cleaner than any individual ranking.
The South runs a median refined rate of 16.1 across its 17 jurisdictions. The Northeast sits at 14.0, the Midwest at 14.1 and the West at 14.5.
Two points of separation on a median is a large regional gap, and it holds even though the South contains both the highest jurisdiction and one of the lowest.
The West is the widest region internally, running from Idaho at 11.3 to Nevada at 20.3. The Midwest is the tightest, with every state between 10.9 and 16.4.
The South’s lead is not driven by one outlier either. Six of its jurisdictions sit above 17, and only South Carolina falls into the national bottom five.
Regional medians are worth more than single-state ranks here, because averaging across a dozen states shrinks the sampling error that makes any one of them unreliable.
| Census region | Median refined rate | Range |
| South | 16.1 | 11.8 to 21.1 |
| West | 14.5 | 11.3 to 20.3 |
| Midwest | 14.1 | 10.9 to 16.4 |
| Northeast | 14.0 | 10.1 to 17.0 |
Do States Where People Marry Later Divorce Less?
Marrying young is one of the strongest predictors of divorce for an individual couple, so it is natural to expect states that marry late to divorce less. We tested it.
We paired each state’s refined divorce rate with its average age at first marriage from the same survey year, then measured the relationship across all 51 jurisdictions.
The correlation is negative, so later-marrying states do divorce a little less, and it is weak. The coefficient is minus 0.23, which means age at marriage accounts for about 5% of the variation between states.
In plain terms, each additional year of average marriage age comes with about a third of a point off the divorce rate, on a scale that runs from 10 to 21.
The counter-examples are easy to find. Idaho has one of the youngest marriage ages in the country and the fourth lowest divorce rate. The District of Columbia has the oldest and sits eighth highest.
What holds for individuals does not carry up to states. Whatever separates Oklahoma from Maine, it is mostly not the age at which people there get married.
| Test | Result | Reading |
| Correlation, marriage age and divorce rate | Minus 0.23 | Weak and negative |
| Share of state variation explained | About 5% | Almost all of it is something else |
| Effect per extra year of marriage age | Minus 0.36 points | Small against a 10 to 21 range |
The National Divorce Rate Has Fallen by a Quarter
The state map matters less than the direction of travel, and the direction is unambiguous.
The refined rate was 19.8 in 2010. It is 14.4 now, a fall of 27% across fourteen years.
The raw count moved the same way. 2,358,274 people divorced in 2010 against 1,868,585 in 2024, a drop of 21%, and that happened while the adult population grew by roughly 32 million.
Married women became more numerous over the same stretch, rising from 63.2 million to 68.6 million. More marriages, fewer divorces.
The fall was steepest in the first half of the period. The refined rate dropped 3.9 points between 2010 and 2018 and 1.5 points across the six years since, so the decline is slowing without reversing.
The one interruption is 2021, when the rate dropped to 14.2 before rebounding to 14.8 in 2022. Courts closed during the pandemic and the backlog cleared afterwards, so those two years should be read as a pair.
| Year | Refined rate | Total divorces |
| 2010 | 19.8 | 2,358,274 |
| 2014 | 17.9 | 2,162,925 |
| 2018 | 15.9 | 1,997,684 |
| 2021 | 14.2 | 1,831,717 |
| 2022 | 14.8 | 1,878,430 |
| 2023 | 14.7 | 1,867,021 |
| 2024 | 14.4 | 1,868,585 |
How Much of the Ranking Is Noise, and Why Sources Disagree
State divorce rates come from a sample, and small states are sampled thinly.
The District of Columbia carries a margin of error of 8.8 points on a rate of 17.9. Alaska carries 7.0, Delaware 6.6 and Wyoming 5.7. For those places the honest statement is a range and not a rank.
Large states are far tighter. California’s margin is 0.9 points, Texas 1.1 and New York 1.1, so their positions are close to fixed.
Applied to the table, that means Oklahoma at the top and Maine at the bottom is a real result, and the ordering within the top five or the bottom five is not.
The same caution applies to any year-on-year movement for a small state. A jurisdiction with a margin of seven points can appear to jump twenty places between two surveys without anything having happened in it.
We have not seen another ranking of this keyword publish margins of error at all. Every list we checked presents fifty-one ranks as though each one were exact.
The other reason two rankings disagree is definitional. If our numbers do not match another source you have read, that is almost always why, and not an error on either side.
The National Center for Family and Marriage Research publishes the same style of refined rate and reported 14.4 nationally for 2023. Our computation for 2023 gives 14.7.
We could not close that gap by switching the denominator to married women with a spouse present, which gives 16.1, or by removing separated women, which gives 15.2. The most likely explanation is that they work from the microdata files and not the published tables.
We report our own figure with the definition stated instead of quietly adopting theirs. Two numbers three tenths apart with a documented method are worth more than one number nobody can reproduce.
Rankings built on court records instead of survey answers will differ again, because not every state reports divorce counts to the federal government. For the wider set of divorce research see our divorce statistics page, our study of the divorce rate by occupation, and the statistics hub.
All 50 States and DC Ranked
The full table below is ordered by the refined rate, with the crude rate shown alongside so you can see where a state moves between the two.
Read the middle of this table loosely. Ranks 20 through 40 are packed into a band of about three points, which is narrower than the margin of error on several of the states inside it.
| Rank and state | Refined rate | Crude rate |
| 1. Oklahoma | 21.1 | 9.71 |
| 2. Nevada | 20.3 | 8.74 |
| 3. Mississippi | 19.6 | 8.69 |
| 4. Wyoming | 19.1 | 7.74 |
| 5. Alabama | 18.4 | 8.79 |
| 6. Arkansas | 18.2 | 8.02 |
| 7. Alaska | 17.9 | 6.51 |
| 8. District of Columbia | 17.9 | 4.94 |
| 9. Oregon | 17.4 | 7.83 |
| 10. Louisiana | 17.3 | 7.16 |
| 11. Kentucky | 17.2 | 8.40 |
| 12. Rhode Island | 17.0 | 5.08 |
| 13. Tennessee | 16.6 | 8.44 |
| 14. Nebraska | 16.4 | 7.61 |
| 15. South Dakota | 16.4 | 6.47 |
| 16. Washington | 16.4 | 7.40 |
| 17. West Virginia | 16.1 | 8.15 |
| 18. Delaware | 16.0 | 8.18 |
| 19. Texas | 15.7 | 7.37 |
| 20. Vermont | 15.7 | 7.11 |
| 21. Georgia | 15.6 | 6.81 |
| 22. Indiana | 15.6 | 7.51 |
| 23. New Hampshire | 15.5 | 8.14 |
| 24. Florida | 15.3 | 6.89 |
| 25. Colorado | 15.0 | 7.84 |
| 26. Connecticut | 14.6 | 5.61 |
| 27. Arizona | 14.5 | 6.98 |
| 28. North Dakota | 14.4 | 6.32 |
| 29. Ohio | 14.3 | 6.51 |
| 30. Iowa | 14.2 | 6.38 |
| 31. Maryland | 14.1 | 6.22 |
| 32. Massachusetts | 14.0 | 6.32 |
| 33. Missouri | 14.0 | 7.12 |
| 34. Utah | 13.9 | 6.81 |
| 35. Virginia | 13.4 | 7.12 |
| 36. California | 13.3 | 5.90 |
| 37. New Mexico | 13.3 | 5.76 |
| 38. Hawaii | 13.2 | 5.76 |
| 39. Illinois | 13.0 | 5.89 |
| 40. Pennsylvania | 13.0 | 6.23 |
| 41. North Carolina | 12.6 | 6.22 |
| 42. New York | 12.5 | 5.61 |
| 43. Kansas | 12.3 | 6.13 |
| 44. Michigan | 12.3 | 5.79 |
| 45. Minnesota | 12.2 | 5.93 |
| 46. Montana | 11.9 | 5.59 |
| 47. South Carolina | 11.8 | 5.47 |
| 48. Idaho | 11.3 | 6.56 |
| 49. New Jersey | 11.2 | 5.25 |
| 50. Wisconsin | 10.9 | 5.57 |
| 51. Maine | 10.1 | 5.25 |
The same state lines that produce these differences also govern what a couple can agree before marrying. Our prenup guides set out the rules in New Jersey, Michigan, Minnesota, Missouri, Arizona, Indiana, Iowa, Kansas, Nebraska and Hawaii.
Methodology and Sources
Every figure on this page was computed by us from the US Census Bureau API, using American Community Survey one-year estimates. No number was taken from a secondary roundup.
The refined rate divides women who reported divorcing in the past twelve months, Table B12503, by women recorded as now married, Table B12001, multiplied by 1,000. The crude rate divides all people who reported divorcing in the past twelve months by the population aged 15 and over, both from Table B12503.
Margins of error are the published Census margins on the divorce counts, carried through to the rate. Where two states sit within each other’s margin we say so rather than ranking them.
There is no 2020 one-year release, so that year is absent from every series here. We excluded law firm rankings, content-marketing statistics pages and any causal explanation for why a given state sits where it does.



